. 2024 Nov 19;5(12):101097.
doi: 10.1016/j.patter.2024.101097. eCollection 2024 Dec 13.

Cross-modal contrastive learning for unified placenta analysis using photographs

Affiliations

Cross-modal contrastive learning for unified placenta analysis using photographs

Yimu Pan et al. Patterns (N Y). .

Abstract

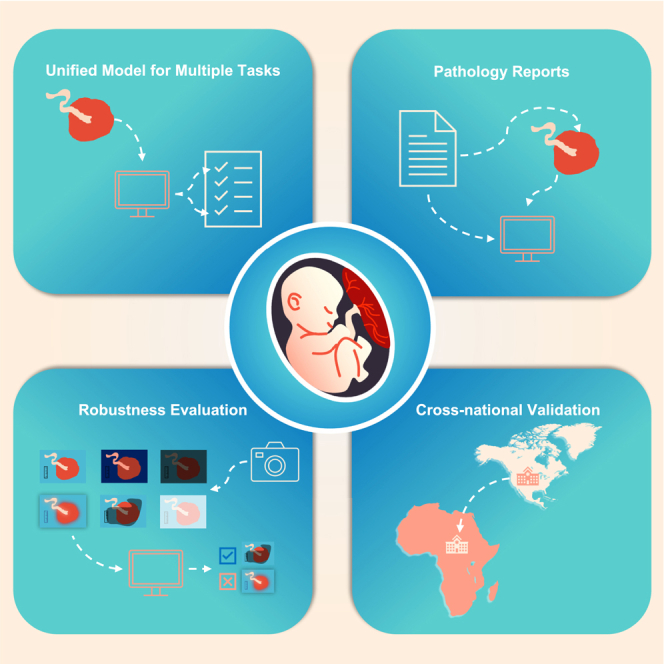
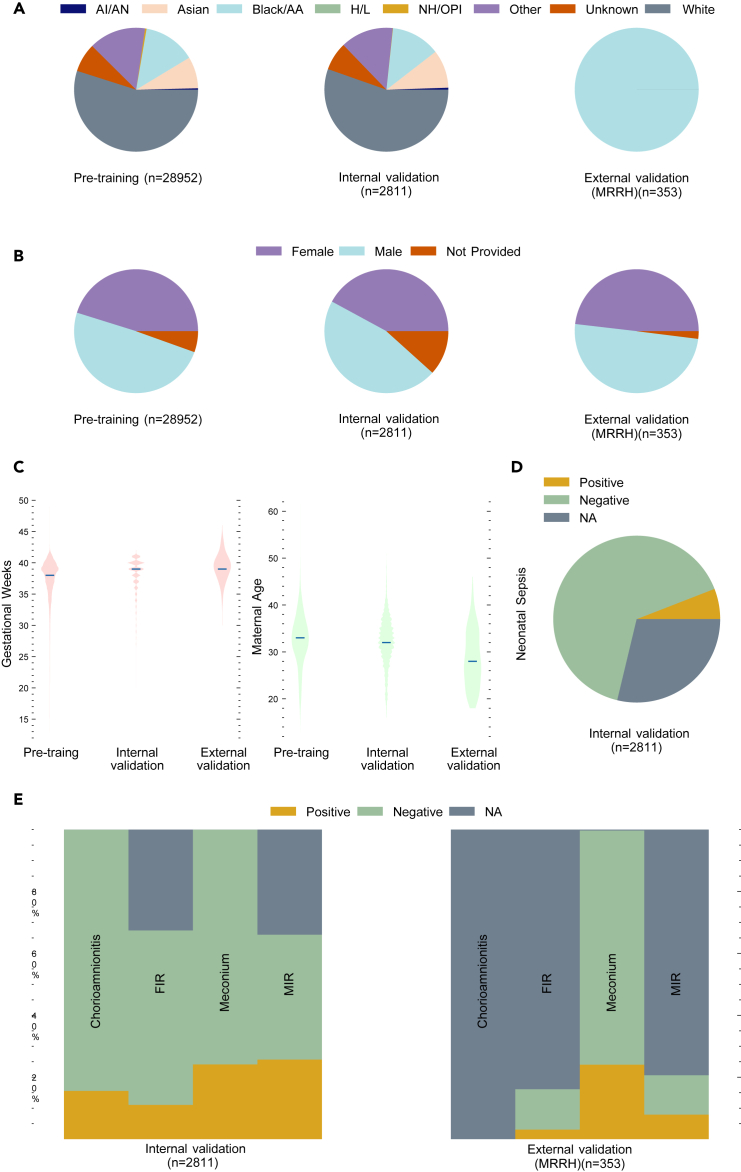
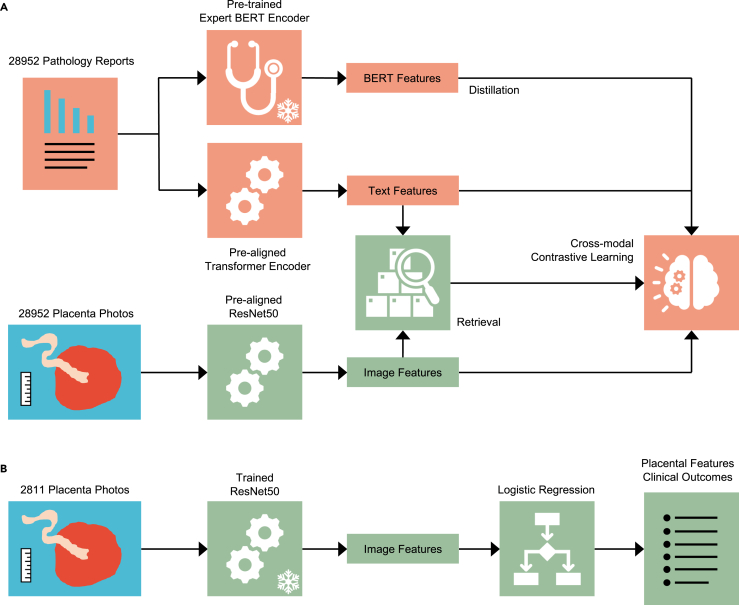
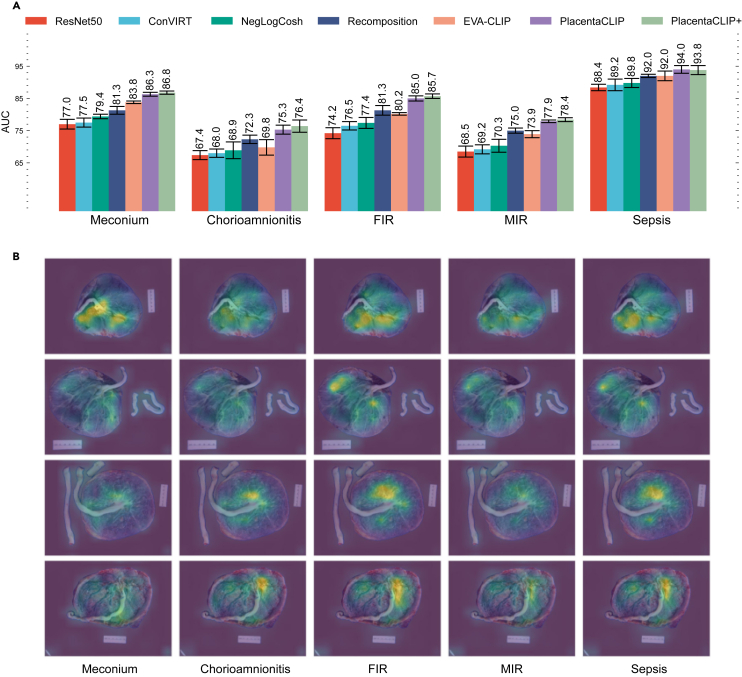
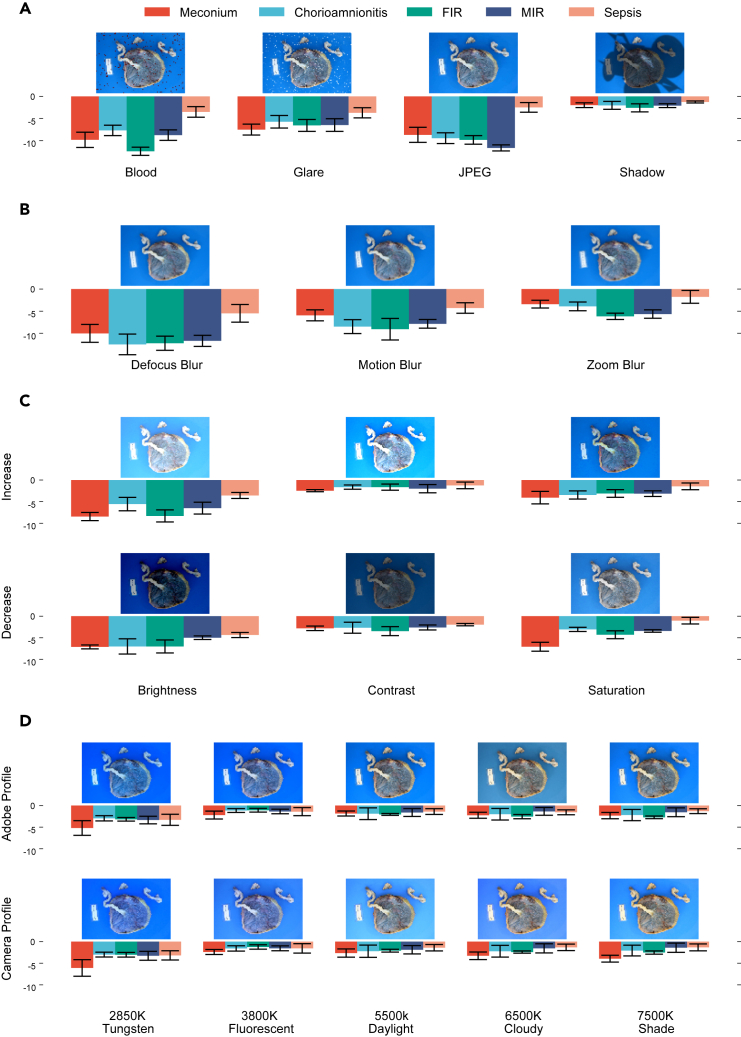
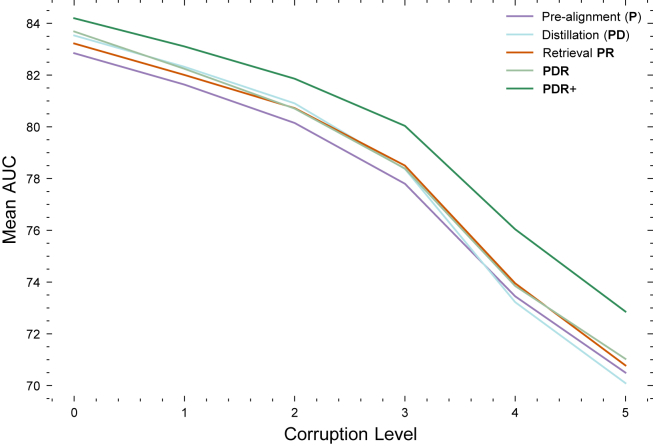
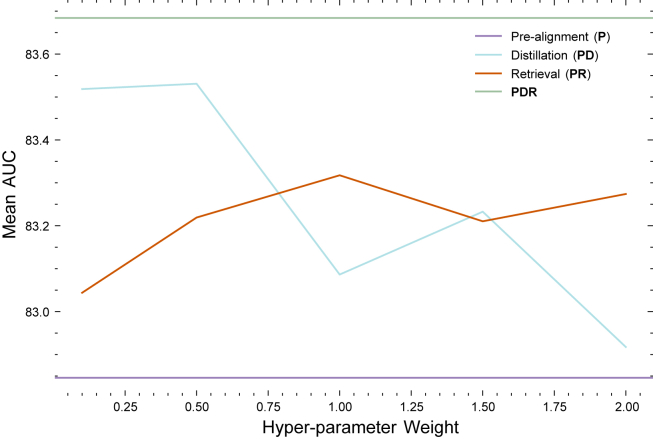
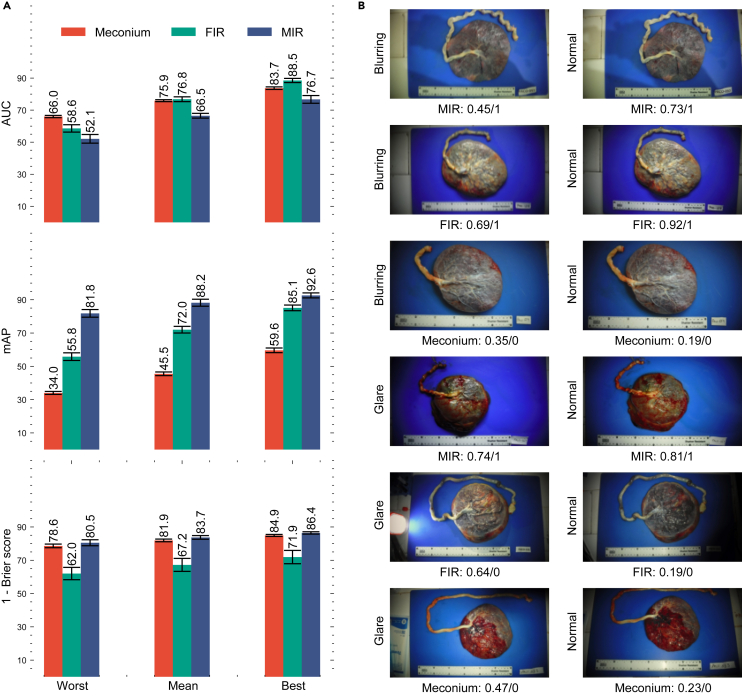
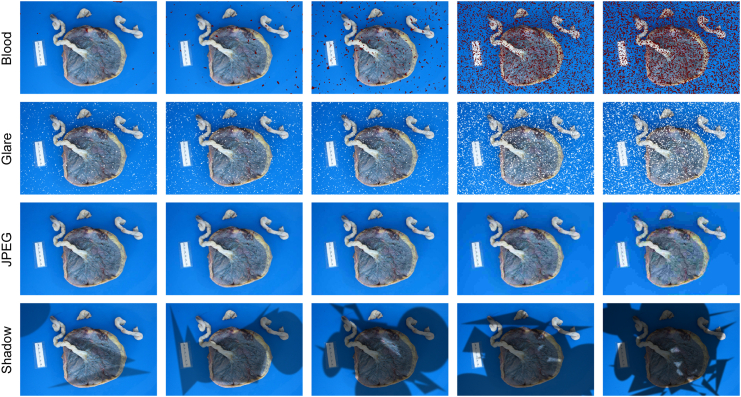
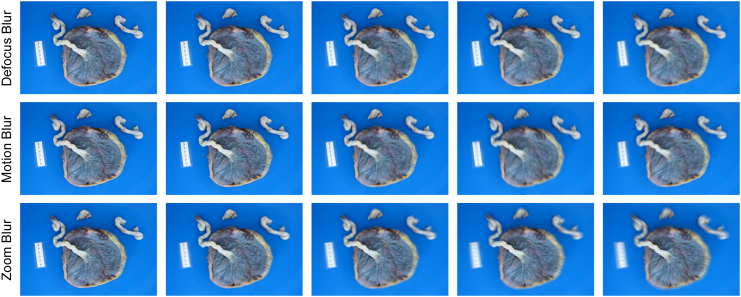
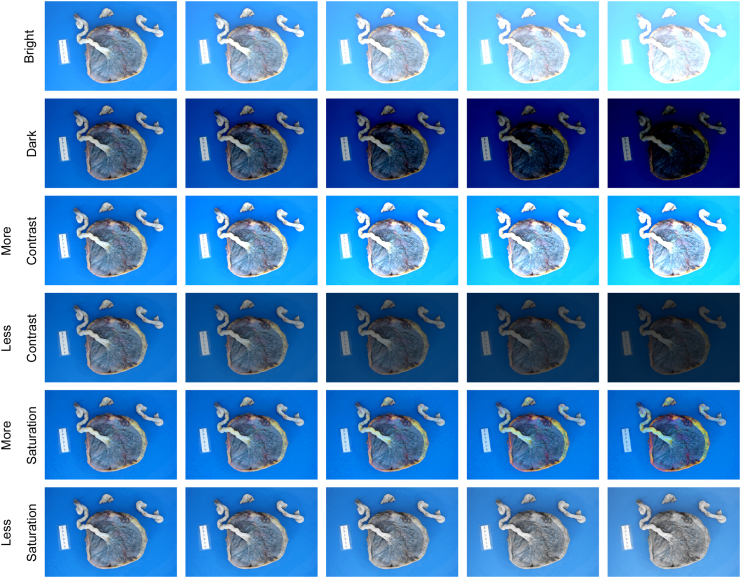
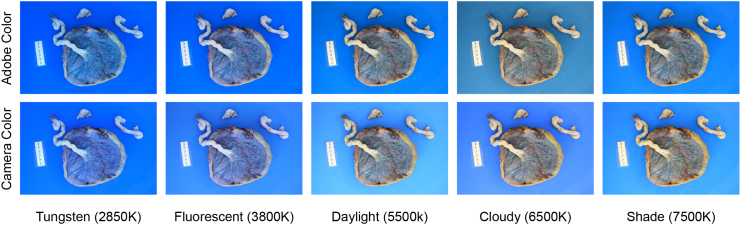
The placenta is vital to maternal and child health but often overlooked in pregnancy studies. Addressing the need for a more accessible and cost-effective method of placental assessment, our study introduces a computational tool designed for the analysis of placental photographs. Leveraging images and pathology reports collected from sites in the United States and Uganda over a 12-year period, we developed a cross-modal contrastive learning algorithm consisting of pre-alignment, distillation, and retrieval modules. Moreover, the proposed robustness evaluation protocol enables statistical assessment of performance improvements, provides deeper insight into the impact of different features on predictions, and offers practical guidance for its application in a variety of settings. Through extensive experimentation, our tool demonstrates an average area under the receiver operating characteristic curve score of over 82% in both internal and external validations, which underscores the potential of our tool to enhance clinical care across diverse environments.

Keywords: contrastive learning; cross-modal; knowledge distillation; placenta analysis; vision and language.


Conflict of interest statement

J.Z.W., A.D.G., and J.A.G. are named inventors on US patent 11,244,450, “Systems and Methods Utilizing Artificial Intelligence for Placental Assessment and Examination.” It is assigned to The Penn State Research Foundation and Northwestern University. These interests do not influence the integrity of the research, and all efforts have been made to ensure that the research was conducted and presented in an unbiased manner.

Figures

None
Graphical abstract
Figure 1
Figure 1
The characteristics of the primary dataset and the external validation dataset (A) Distribution of self-reported race. (B) Distribution of infant sex. (C) Distribution of gestational age and maternal age. (D) Distribution of the neonatal sepsis label from the tuning and validation set. (E) Distribution of placental feature labels. Each placenta from the primary dataset has one image and one pathology report, while placentas from the external validation dataset have a median (25%–75% percentile) of 4 (3–5) images and one pathology report. The NA category represents instances where information could not be derived due to missing data. AI/AN, American Indian or Alaska Native; Black/AA, Black or African American; H/L, Hispanic or Latino; NH/OPI, Native Hawaiian or other Pacific Islander; NMH, Northwestern Memorial Hospital; MRRH, Mbarara Regional Referral Hospital; FIR, fetal inflammatory response; MIR, maternal inflammatory response; NA, not applicable.
Figure 2
Figure 2
An overview of the pre-training and fine-tuning paradigm and the cross-modal contrastive learning algorithm PlacentaCLIP (A) The pre-training stage, where a frozen pre-trained BERT encoder and a trainable transformer text encoder were used to encode the text from pathology reports, while a trainable ResNet50 was used to encode image features. The proposed cross-modal contrastive learning algorithm guides this training stage. BERT, bidirectional encoder representations from transformers. (B) The fine-tuning stage, where the frozen ResNet50, trained in the pre-training stage, was used to extract image features, and logistic regression was applied to these features to predict the placental features or clinical outcomes. The 2,811-image fine-tuning dataset was randomly split into training and validation sets.
Figure 3
Figure 3
Average AUC for four placental feature identification tasks and one clinical outcome prediction task on the primary dataset and visualization of the cross-modal retrieval module (A) The AUC and the corresponding standard deviation from five random splits. Results of ResNet50, ConVIRT, and NegLogCosh are taken from Pan et al. Results of recomposition are taken from Pan et al. The result for EVA-CLIP is from the “EVA02_CLIP_B_psz16_s8B″ model, tuned on our pre-training data. The error bars represent the standard deviations computed from five random splits. (B) The attention weights from the cross-modal retrieval module during the pre-training stage. Different features are retrieved to assist the image encoder pre-training based on query text for better image-text alignment. In the illustration, the full name of each task is used as the text query to retrieve the visual features, except for sepsis, where the concatenation of FIR, MIR, and chorioamnionitis is used as the query. The actual process uses part of the report as the text query. The ground-truth labels for the images from top to bottom are as follows: row 1: −, −, −, −, −; row 2: +, −, −, −, −; row 3: −, −, 1, 1, −; row 4: +, −, 1, 1, −. −: negative; +: positive; 1: stage 1. FIR, fetal inflammatory response; MIR, maternal inflammatory response; PlacentaCLIP+, PlacentaCLIP trained with additional data.
Figure 4
Figure 4
The average AUC performance drop of PlacentaCLIP+ from using the original images to corrupted images on each task identified in the primary dataset The AUC drop (y axis) is computed by subtracting the AUC of PlacentaCLIP+ on the original images from the AUC on corrupted images, averaged across all corruption levels for each random split. Error bars represent the standard deviations computed using five random splits. (A) Performance under different image artifacts. (B) Performance under different types of image blurring. (C) Performance under different exposure artifacts. (D) Performance under different WB inaccuracies. FIR, fetal inflammatory response; MIR, maternal inflammatory response.
Figure 5
Figure 5
Module AUC performance at varying corruption levels At lower corruption levels (below level 3), the distillation module outperformed the retrieval module. As the corruption level increased, the retrieval module showed better performance. Adding the distillation module on top of the retrieval module did not further improve robustness (i.e., the performance of PDR and PR converged as the corruption level increased). These results validate our design; distillation enhances performance, while retrieval improves robustness.
Figure 6
Figure 6
The AUC scores obtained by applying different hyperparameters to the pre-training modules on a subset of the primary dataset
Figure 7
Figure 7
Performance of PlacentaCLIP+ on three placental feature identification tasks in the external validation set from MRRH and some qualitative examples of performance variation (A) The performance for the three identified tasks using the models trained on the NMH dataset. Worst: the metrics were generated by selecting an image for each case where PlacentaCLIP+ performed the worst. Mean: the metrics were generated by averaging the probabilities predicted by PlacentaCLIP+ over all the images for each case. Best: the metrics were generated by selecting the image for each case there PlacentaCLIP+ performed the best. AUC, area under the receiver operating characteristic curve; mAP, mean average precision. (B) Example performance and image quality variation. The examples on the left are more affected by the identified artifacts than those on the right. The reported model performance under each image is presented in the form of a task: prediction/ground truth.
Figure 8
Figure 8
Examples of common image artifacts in placenta photos The images from left to right are in the order of increasing corruption level.
Figure 9
Figure 9
Examples of common image blur in placenta photos The images from left to right are in the order of increasing corruption level.
Figure 10
Figure 10
Examples of common exposure artifacts in placenta photos The images from left to right are in the order of increasing corruption level.
Figure 11
Figure 11
Examples of common WB inaccuracies in placenta photos The images from left to right are in the order of increasing color temperature presets.

Similar articles

Cited by

References

    1. Fitzgerald E., Shen M., Yong H.E.J., Wang Z., Pokhvisneva I., Patel S., O’Toole N., Chan S.-Y., Chong Y.S., Chen H., et al. Hofbauer cell function in the term placenta associates with adult cardiovascular and depressive outcomes. Nat. Commun. 2023;14:7120. doi: 10.1038/s41467-023-42300-8. - DOI - PMC - PubMed
    1. Ursini G., Punzi G., Chen Q., Marenco S., Robinson J.F., Porcelli A., Hamilton E.G., Mitjans M., Maddalena G., Begemann M., et al. Convergence of placenta biology and genetic risk for schizophrenia. Nat. Med. 2018;24:792–801. doi: 10.1038/s41591-018-0021-y. - DOI - PubMed
    1. Reis A.S., Barboza R., Murillo O., Barateiro A., Peixoto E.P.M., Lima F.A., Gomes V.M., Dombrowski J.G., Leal V.N.C., Araujo F., et al. Inflammasome activation and IL-1 signaling during placental malaria induce poor pregnancy outcomes. Sci. Adv. 2020;6 doi: 10.1126/sciadv.aax6346. - DOI - PMC - PubMed
    1. Thornburg K.L., Marshall N. The placenta is the center of the chronic disease universe. Am. J. Obstet. Gynecol. 2015;213:S14–S20. doi: 10.1016/j.ajog.2015.08.030. - DOI - PMC - PubMed
    1. Barker D.J.P., Thornburg K.L. Placental programming of chronic diseases, cancer and lifespan: a review. Placenta. 2013;34:841–845. doi: 10.1016/j.placenta.2013.07.063. - DOI - PubMed

LinkOut - more resources