. 2024 Dec 20;29(2):36.
doi: 10.3892/etm.2024.12786. eCollection 2025 Feb.

Identification of amino acid metabolism‑related genes as diagnostic and prognostic biomarkers in sepsis through machine learning

Affiliations

Identification of amino acid metabolism‑related genes as diagnostic and prognostic biomarkers in sepsis through machine learning

Ye Wen et al. Exp Ther Med. .

Abstract

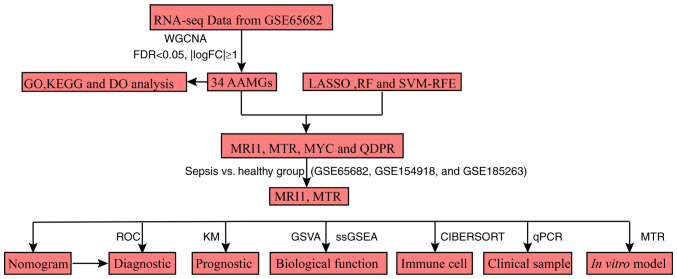
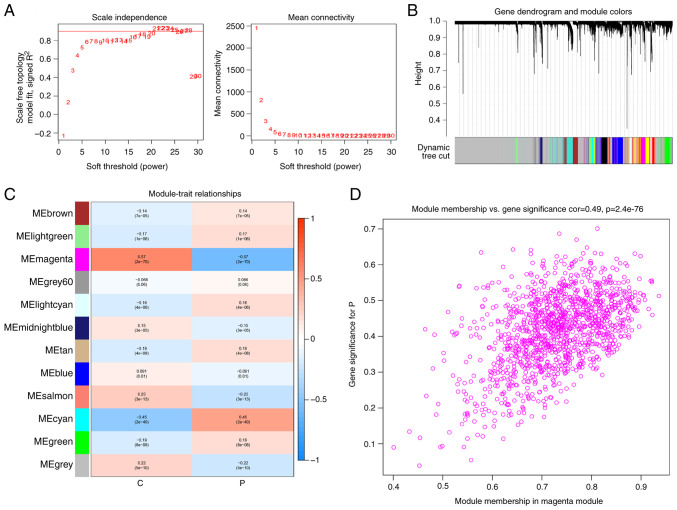
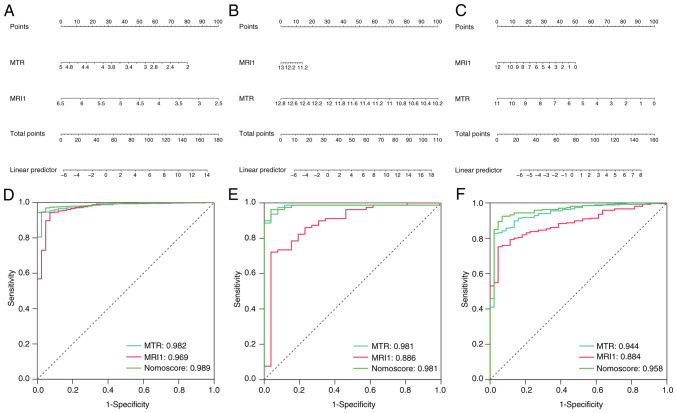
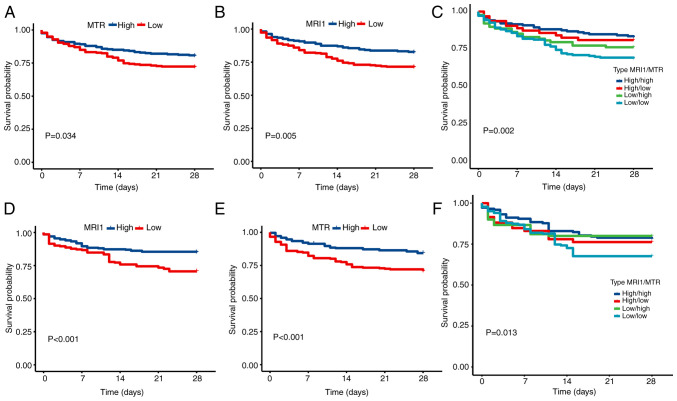
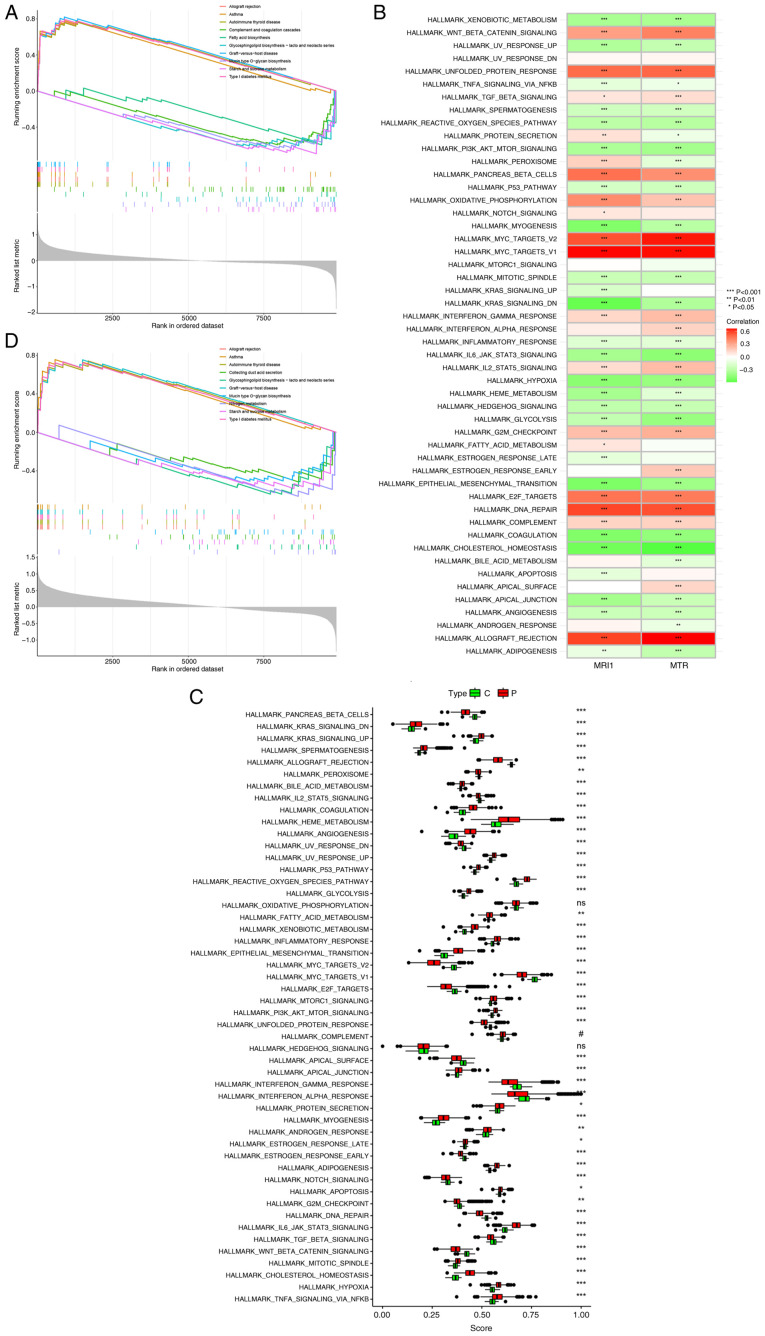
Previous research has highlighted the critical role of amino acid metabolism (AAM) in the pathophysiology of sepsis. The present study aimed to explore the potential diagnostic and prognostic value of AAM-related genes (AAMGs) in sepsis, as well as their underlying molecular mechanisms. Gene expression profiles from the Gene Expression Omnibus (GSE65682, GSE185263 and GSE154918 datasets) were analyzed. Based on weighted gene co-expression network analysis and machine learning algorithms, hub AAMGs were identified in the GSE65682 database. Subsequently, hub AAMGs were evaluated for their expression levels and diagnostic and prognostic significance in sepsis, as well as their interactions with regulatory pathways and role in immune cell infiltration. Additionally, trends in AAMG expression were validated using clinical samples, and their functions in sepsis were confirmed through an in vitro model. In total, four AAMGs were identified, two of which, methionine synthase (MTR) and methionine-R-isomerase 1 (MRI1), demonstrated significant differential expression in the GSE65682, GSE185263 and GSE154918 datasets, which was further validated using clinical samples. A diagnostic nomogram based on MTR and MRI1 expression demonstrated strong diagnostic effectiveness across the three aforementioned databases. Moreover, the expression of both genes were negatively correlated with sepsis prognosis and showed stratified prognostic capabilities. Newly identified pathways included KRAS and IL-2/STAT5 signaling. MTR and MRI1 negatively correlated with the infiltration of inflammatory cells, such as M1 macrophages and neutrophils, and positively correlated with anti-inflammatory cells, such as CD8+ T and dendritic cells. In vitro experiments further demonstrated that overexpression of MTR could mitigate the inhibition of cloning and proliferation induced by LPS and ATP in RAW 264.7 cells. These findings highlighted the potential of MTR and MRI1 as biomarkers for diagnosing and prognosticating sepsis, potentially acting through the regulation of methionine in the pathophysiology of this disease. The present study provided new insights into the role of AAM in the mechanisms underlying sepsis and in the potential development of future targeted therapies.

Keywords: amino acid metabolism; disease markers; inflammation; methionine synthase; methionine-R-isomerase 1; outcome prediction; sepsis.


Conflict of interest statement

The authors declare that they have no competing interests.

Figures

Figure 1
Figure 1
Flow chart of the present study. RNA-seq, RNA sequencing; WGCNA, weighted gene co-expression network analysis; FDR, false discovery rate; FC, fold-change; GO, Gene Ontology; KEGG, Kyoto Encyclopedia of Genes and Genomes; DO, Disease Ontology; AAMG, amino acid metabolism-related genes; LASSO, least absolute shrinkage and selection operator; RF, random forest; SVM-RFE, support vector machine-recursive feature elimination; MRI1, methionine-R-isomerase 1; MTR, methionine synthase; MYC, MYC proto-oncogene; QDPR, quinoid dihydropteridine reductase; ROC, receiver operating characteristic; KM, Kaplan-Meier; GSVA, gene set variation analysis; ssGSEA, single-sample gene set enrichment analysis; RT-qPCR, reverse transcription-quantitative PCR.
Figure 2
Figure 2
WGCNA identifies the module with the strongest correlation to sepsis. (A) Network topology analysis under various soft-threshold powers. (B) Clustering dendrogram of genes with different similarities based on topological overlap and assigned module color. (C) Module-trait association. Each row corresponded to a module while each column corresponded to a feature. Correlations and corresponding P-values (in parentheses) are provided for each module. (D) Relevance of members in the magenta module with sepsis. ME, module membership; C, control; P, patient with sepsis.
Figure 3
Figure 3
Biological functions of differentially expressed AAMGs. (A) Heatmap and (B) volcano plots of differently expressed AAMGs between sepsis and healthy groups. (C) Venn diagram showing the intersection of WGCNA and DIFF AAMGs. (D) Gene Ontology, (E) Kyoto Encyclopedia of Genes and Genome and (F) Disease Ontology analysis of the 34 AAMGs. C, control; P, patient with sepsis; AAMGS, amino acid metabolism-related genes; WGCNA, weighted gene co-expression network analysis; DIFF, differentially expressed.
Figure 4
Figure 4
Identification of hub AAMGs through machine learning. AAMGs screening in a three machine learning algorithms model, which included (A) LASSO, (B) SVM-REF and (C) random forest. (D) Venn diagram showing that four candidates diagnostic AAMGs were identified via the aforementioned three algorithms. AAMGS, amino acid metabolism-related genes; LASSO, least absolute shrinkage and selection operator; SVM-RFE, support vector machine-recursive feature elimination.
Figure 5
Figure 5
Expression patterns of hub AAMGs across different datasets. Boxplots showing the differences in expression levels of MRI1, MTR, MYC and QDPR between the sepsis and healthy groups in the (A) GSE65682, (B) GSE154918 and (C) GSE185263 datasets. Data are presented as mean with standard deviation. MRI1, methylthioribose-1-phosphate isomerase 1; MTR, methionine synthase; MYC, MYC proto-oncogene; QDPR, quinoid dihydropteridine reductase; C, control; P, patient with sepsis.
Figure 6
Figure 6
Diagnostic value of MTR and MRI1 in sepsis. Nomograms of the (A) GSE65682, (B) GSE154918 and (C) GSE185263 datasets for diagnosing sepsis. Receiver operating characteristic curve of MTR and MRI1 and nomograms showed the diagnostic values of MTR and MRI1 in (D) GSE65682, (E) GSE154918 and (F) GSE185263 datasets. MTR, methionine synthase; MRI1, methylthioribose-1-phosphate isomerase 1.
Figure 7
Figure 7
Prognostic predictive value of MTR and MRI1 in sepsis. (A) Kaplan-Meier survival curve based on the expression of MTR in the GSE65682 cohort. (B) Kaplan-Meier survival curve based on the expression of MRI1 in the GSE65682 cohort. (C) Kaplan-Meier survival curve based on the combined expression of MTR and MRI1 in the GSE65682 cohort. (D) Kaplan-Meier survival curve for MTR expression, specifically in the internal validation subset of the GSE65682 cohort. (E) Kaplan-Meier survival curve for MRI1 expression in the internal validation subset of the GSE65682 cohort. (F) Kaplan-Meier survival curve for the combined expression of MTR and MRI1 in the internal validation subset of the GSE65682 cohort. MTR, Methionine synthase; MRI1, methylthioribose-1-phosphate isomerase 1.
Figure 8
Figure 8
Potential biological functions of MTR and MRI1. (A) Gene set enrichment analysis plot of the top five pathways in MTR. (B) Pathways associated with MTR and MRI1. (C) Boxplots presenting the differences between sepsis and healthy groups. (D) Gene set enrichment analysis plot of the top five pathways in MRI1. Data are presented as mean with standard deviation. *P<0.05, **P<0.01, ***P<0.001. ns, not significant. MTR, Methionine synthase; MRI1, methylthioribose-1-phosphate isomerase 1; C, control; P, patient with sepsis.
Figure 9
Figure 9
Relationship between MTR and MRI1 expression levels and immune cell infiltration abundance in Sepsis. Lollipop charts of the correlation between immune cell infiltration abundance and the expression levels of (A) MTR and (B) MRI1. Data are presented as mean with standard deviation. MTR, Methionine synthase; MRI1, methylthioribose-1-phosphate isomerase 1; abs(cor), the absolute value of the correlation coefficient.
Figure 10
Figure 10
The role of MTR in sepsis. (A) Comparison of mRNA expression levels of MTR and MRI1 in peripheral blood samples between five patients with sepsis and five healthy individuals. (B) mRNA expression level of MTR between the control and LPS + ATP-induced groups. (C) mRNA and protein expression levels of MTR in cells transfected with different vectors. (D) Differences in cell survival rate between the control and LPS + ATP-induced groups (**P<0.01 vs. LPS + ATP group). (E) Protein expression levels of MTR across cells transfected with different vectors. Comparison of (F) colony formation and (G) proliferation rates among cells transfected with different vectors (scale bar, 50 µm). **P<0.01. LPS, lipopolysaccharide; MTR, methionine synthase; OE, overexpression; NC, negative control.

References

    1. Becker JU, Theodosis C, Jacob ST, Wira CR, Groce NE. Surviving sepsis in low-income and middle-income countries: New directions for care and research. Lancet Infect Dis. 2009;9:577–582. doi: 10.1016/S1473-3099(09)70135-5. - DOI - PubMed
    1. Fleischmann C, Scherag A, Adhikari NKJ, Hartog CS, Tsaganos T, Schlattmann P, Angus DC, Reinhart K. Assessment of global incidence and mortality of hospital-treated sepsis. Current estimates and limitations. Am J Respir Crit Care Med. 2016;193:259–272. doi: 10.1164/rccm.201504-0781OC. International Forum of Acute Care Trialists. - DOI - PubMed
    1. Guliciuc M, Porav-Hodade D, Chibelean BC, Voidazan ST, Ghirca VM, Maier AC, Marinescu M, Firescu D. The role of biomarkers and scores in describing urosepsis. Medicina (Kaunas) 2023;59(597) doi: 10.3390/medicina59030597. - DOI - PMC - PubMed
    1. Dai W, Shen J, Yan J, Bott AJ, Maimouni S, Daguplo HQ, Wang Y, Khayati K, Guo JY, Zhang L, et al. Glutamine synthetase limits β-catenin-mutated liver cancer growth by maintaining nitrogen homeostasis and suppressing mTORC1. J Clin Invest. 2022;132(e161408) doi: 10.1172/JCI161408. - DOI - PMC - PubMed
    1. Sivanand S, Vander Heiden MG. Emerging roles for branched-chain amino acid metabolism in cancer. Cancer Cell. 2020;37:147–156. doi: 10.1016/j.ccell.2019.12.011. - DOI - PMC - PubMed

LinkOut - more resources