. 2024 Dec 24:15:1503018.
doi: 10.3389/fimmu.2024.1503018. eCollection 2024.

CD28 shapes T cell receptor signaling by regulating Lck dynamics and ZAP70 activation

Affiliations

CD28 shapes T cell receptor signaling by regulating Lck dynamics and ZAP70 activation

Kumarkrishna Raychaudhuri et al. Front Immunol. .

Abstract

Introduction: T cell activation requires T cell receptor (TCR) engagement by its specific ligand. This interaction initiates a series of proximal events including tyrosine phosphorylation of the CD3 and TCRζ chains, recruitment, and activation of the protein tyrosine kinases Lck and ZAP70, followed by recruitment of adapter and signaling proteins. CD28 co-stimulation is also required to generate a functional immune response. Currently we lack a full understanding of the molecular mechanism of CD28 activation.

Methods: We employed TIRF microscopy to establish detailed spatial and kinetic relationships among these molecules in live Jurkat and murine primary T cells. We used anti-TCR (CD3) antibodies to trigger formation of TCR microclusters (MC), which are submicron-sized basic signaling units formed during T cell activation. Using this model, we aimed to delineate how the CD28 co-stimulatory signal alters the kinetics and molecular stoichiometry of TCR proximal signaling events, and how these effects could affect the immune response.

Results: Our results show that CD28 co-stimulation specifically accelerated recruitment of ZAP70 to the TCRζ chain in MCs and increased ZAP70 activation. CD28-mediated acceleration of ZAP70 recruitment was driven by enhanced Lck recruitment to the MCs. A greater spatial separation between active and inactive species of Lck was also observed in the MCs as a consequence of CD28 co-stimulation.

Conclusion: These results suggest that CD28 co- stimulation may lower the TCR activation threshold by enhancing the activated form of Lck in the TCR MCs.

Keywords: CD28 co-stimulation; Lck; T cell signaling; ZAP70; and kinetic proof-reading; microcluster.


Conflict of interest statement

The authors declare that the research was conducted in the absence of any commercial or financial relationships that could be construed as a potential conflict of interest.

Figures
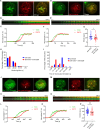
Figure 1
Figure 1
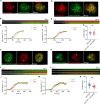
CD28 co-stimulation accelerates recruitment of ZAP70 to TCRζ in the microclusters of induced T cells. Jurkat T cells (A–I) or mouse primary T cells (J–P) were transfected to express TCRζ-Emerald (green) and ZAP70-Apple (red) and were activated on coverslips coated with either anti-CD3 alone (A, J) (Jurkat: n = 50 microclusters (MC), more than 7 (>7) cells; mouse primary T cells: n = 89 MC, >8 cells) or with anti-CD3 + anti-CD28 (D, M) (Jurkat: n = 52 MC, >7 cells; Mo-primary T cells: n = 59 MC, >5 cells) antibodies. 120 time-lapse images were acquired every 3s at 21°C using TIRF microscopy. (A, D, J, M) Sum of all the image stacks for the individual time points (Max intensity projection) of representative Jurkat T cells or mouse primary T cells stimulated as indicated above. (B, E, K, N) Time-lapse montage of representative microclusters from (A, D, H, K) as indicated by white boxes. (C, F, L, O) Representative relative intensity plot of the individual microclusters, as defined in the materials and methods section, indicated in (A, D, J, M), respectively. (G, P) Kinetic lags, as defined in the materials and methods section, measured between TCRζ and ZAP70 with indicated stimulatory antibodies. Each point represents the time lag, as defined in the materials and methods section, at half-max intensity of an individual microcluster. (H) Distribution of average kinetic lags across specified time bins. (I) Distribution of percentage of microclusters formed at specified time intervals of the first kinetic lag bin, as defined in the materials and methods section, (0-25s) in (H). Data presented as mean ± SEM. Populations were analyzed using Mann-Whitney (Jurkat data) and Welch’s (mouse primary T cells) t-tests. *p < 0.05, **p < 0.01. Scale bar: 5μm.
Figure 2
Figure 2
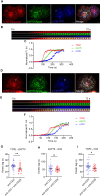
The effect of CD28 co-stimulation is less pronounced in regulating the kinetic lag between ZAP70 and signaling domain proteins. Jurkat T cells (A–G) or mouse primary T cells (H–N) were transfected to express ZAP70-Apple (red) and GRB2-Emerald (green) or ZAP70-Emerald (green) and GRB2-Apple (red), respectively. Cells were activated on coverslips coated with either anti-CD3 alone (A, H) (Jurkat: n = 40 MC, >8 cells; Mo-primary T cells: n = 52 MC, >8 cells) or with anti-CD3 + anti-CD28 (D, K) (Jurkat: n = 41 MC, >11 cells; Mo-primary T cells: n = 40 MC, >6 cells) antibodies. 120 time-lapse images were acquired every 3s at 21°C using TIRF microscope. (A, D, H, K) Max intensity projection of representative Jurkat T cells or mouse primary T cells stimulated as indicated above. (B, E, I, L) Time-lapse montage of representative microclusters from (A, D, H, K) respectively, as indicated. (C, F, J, M) Representative relative intensity plot of the individual microclusters indicated by white boxes in (A, D, H, K) respectively. (G, N) Kinetic lags measured between ZAP70 and GRB2 with indicated stimulatory antibodies. Data presented as mean ± SEM. Populations were analyzed using Student’s t-tests. ***p<0.001, ns, not significant. Scale bar: 5μm.
Figure 3
Figure 3
Recruitment of E3 ligase c-Cbl to the TCRζ but not to ZAP70 is accelerated by CD28 co-stimulation. Jurkat T cells were transfected to express TCRζ-Turquoise (red), ZAP70-Apple (green) and c-Cbl-YFP (blue). Cells were activated on coverslips coated with either anti-CD3 alone (A) (TCRζ-ZAP70 lag: n = 36 MC; TCRζ-c-Cbl lag: n = 39 MC; ZAP70-c-Cbl: n = 35 MC) or with anti-CD3 + anti-CD28 (D) (TCRζ-ZAP70 lag: n = 35 MC; TCRζ-c-Cbl lag: n = 35 MC; ZAP70-c-Cbl: n = 36 MC) antibodies. 120 time-lapse images were acquired every 3s at 21°C using TIRF microscope. (A, D) Max intensity projection of representative Jurkat T cells stimulated as indicated above. (B, E) Time-lapse montage of representative microclusters from (A, D), as indicated by white boxes, respectively. (C, F) Representative relative intensity plot of the individual microclusters indicated in (A, D), respectively. (G–I) Kinetic lags measured between proteins as indicated in the figure under either anti-CD3 (>6 cells) or anti-CD3+anti-CD28 (>4 cells) stimulation. Data presented as mean ± SEM. Populations were analyzed using Student’s (TCRζ-ZAP70 lag), and Welch’s t-tests (TCRζ-c-Cbl lag and ZAP70-c-Cbl lag). *p < 0.05, **p < 0.01, ns, not significant. Scale bar: 5μm.
Figure 4
Figure 4
Acceleration of the TCRζ-ZAP70 kinetic lag mediated by CD28 is abolished in CD28 KO cells. Mouse primary T cells from mice genetically manipulated to lack CD28 were transfected to express TCRζ-Emerald (green) and ZAP70-Apple (red) (A–G) or ZAP70-Emerald (green) and GRB2-Apple (red) (H–N). Cells were activated on coverslips coated with either anti-CD3 alone (A, H) (TCRζ-ZAP70 lag: n = 124 MC, >6 cells; ZAP70-GRB2 lag: n = 46 MC, >9 cells) or with anti-CD3 + anti-CD28 (D, K) (TCRζ-ZAP70 lag: n = 69 MC, >5 cells; ZAP70-Grab2 lag: n = 16 MC, >7 cells) antibodies. 120 time-lapse images were acquired every 3s at 21°C using TIRF microscope. (A, D, H, K) Max intensity projection of representative CD28-deficient primary T cells stimulated as indicated above. (B, E, I, L) Time-lapse montage of representative microclusters from (A, D, H, K), respectively, as indicated by white boxes. (C, F, J, M) Representative relative intensity plot of the individual microclusters indicated in (A, D, H, K) respectively. (G, N) Kinetic lags measured between TCRζ and ZAP70 with indicated stimulatory antibodies. Data presented as mean ± SEM. Populations were analyzed using Welch’s (TCRζ-ZAP70 lag), and Student’s t-tests (ZAP70-GRB2 lag). ns, not significant. Scale bar: 5μm.
Figure 5
Figure 5
Lck localization and activation is regulated by CD28 co-stimulation. Jurkat T cells were transfected to express Lck-Emerald (green) and ZAP70-Apple (red). Cells were activated on coverslips coated with either anti-CD3 alone or with anti-CD3 + anti-CD28. 120 time-lapse images were acquired every 3s at 21°C using TIRF microscope (A–D). (A) Max intensity projection of a representative Jurkat T cell becoming activated on coverslip-bound anti-CD3 and anti-CD28 antibody (Left). Time-lapse montage (Right) of a section of the cell as indicated by white box shows early dynamics and priming action of Lck at sites where a ZAP70 microcluster would form. (B) Normalized fluorescence intensity over time of Lck at ZAP70 microclusters in cells stimulated as indicated. The two-tailed Mann-Whitney U-test was used to calculate p-values, with p-values <= 0.05 denoted as a red bar. (C) Percent overlap of Lck at ZAP70 microclusters as a function of time in cells stimulated as indicated. (D) Frequency of change between “Lck ON” and “Lck OFF” state of ZAP70 microclusters in cells stimulated as indicated. (E) Jurkat T cells were stimulated with anti-CD3 alone or with anti-CD3 + anti-CD28 coated coverslips for 5 minutes and then stained with total Lck, pTCRζ-Y142 and ZAP70-pY319. Graph shows colocalization of Lck with pTCRζ-Y142 and ZAP70-pY319 and in cells stimulated as indicated. (F) Jurkat T cells were stimulated with anti-CD3 alone, anti-CD3 + B7.1 and anti-CD3 + B7.2 coated coverslips for 5 minutes and then stained with Lck-pY395 and Lck-pY505. Graph shows fraction of overlap of Lck-pY394 (activating phosphorylation) with Lck-pY505 (inhibitory phosphorylation) on cells stimulated as indicated. Data presented as mean ± SEM. Populations were analyzed using Welch’s (TCRζ-ZAP70 lag), and Student’s t-tests (ZAP70-GRB2 lag). *p < 0.05, **p < 0.01, ****p < 0.0001. Scale bar: 5μm.
Figure 6
Figure 6
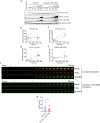
CD28 co-stimulation increases ZAP70 activation and accelerates onset of calcium flux. (A–E) Jurkat cells were stimulated on plate bound anti-CD3 alone or anti-CD3 + anti-CD28 for indicated durations. Lysates were resolved by SDS-PAGE and Western blot was performed with indicated antibodies (A). (B–E) Band intensities were calculated using ImageJ and normalized intensities were plotted for indicated proteins at each time point. (F, G) Jurkat T cells were transfected to express the calcium indicator GCaMP6s (green) and TCRζ-Apple (red). Cells were activated on coverslips coated with either anti-CD3 alone or with anti-CD3 + anti-CD28. 200 time-lapse images were acquired every 2s at 21°C using TIRF microscope. Red and green triangles in F shows appearance of TCRζ MC and GCaMPs respectively. Time lag between onset of TCRζ and GCaMP6s intensities in cells (n = 39 for anti-CD3 and n= 30 for anti-CD3 +anti-CD28) stimulated as indicated (G). Data presented as mean ± SEM (n = 3 for all other experiments). Populations analyzed using 2-way ANOVA (B–D) and Mann-Whitney test (G). *p < 0.05, ns, not significant.

Update of

References

    1. Balagopalan L, Kortum RL, Coussens NP, Barr VA, Samelson LE. The linker for activation of T cells (LAT) signaling hub: from signaling complexes to microclusters. J Biol Chem. (2015) 290:26422–9. doi: 10.1074/jbc.R115.665869 - DOI - PMC - PubMed
    1. Yi J, Balagopalan L, Nguyen T, Mcintire KM, Samelson LE. TCR microclusters form spatially segregated domains and sequentially assemble in calcium-dependent kinetic steps. Nat Commun. (2019) 10:277. doi: 10.1038/s41467-018-08064-2 - DOI - PMC - PubMed
    1. Balagopalan L, Raychaudhuri K, Samelson LE. Microclusters as T cell signaling hubs: structure, kinetics, and regulation. Front Cell Dev Biol. (2020) 8:608530. doi: 10.3389/fcell.2020.608530 - DOI - PMC - PubMed
    1. Grakoui A, Bromley SK, Sumen C, Davis MM, Shaw AS, Allen PM, et al. . The immunological synapse: a molecular machine controlling T cell activation. Science. (1999) 285:221–7. doi: 10.1126/science.285.5425.221 - DOI - PubMed
    1. Houtman JC, Yamaguchi H, Barda-Saad M, Braiman A, Bowden B, Appella E, et al. . Oligomerization of signaling complexes by the multipoint binding of GRB2 to both LAT and SOS1. Nat Struct Mol Biol. (2006) 13:798–805. doi: 10.1038/nsmb1133 - DOI - PubMed

MeSH terms

Substances

LinkOut - more resources