

The systemic inflammation response index (SIRI) predicts survival in advanced non-small cell lung cancer patients undergoing immunotherapy and the construction of a nomogram model
- PMID: 39776905
- PMCID: PMC11703897
- DOI: 10.3389/fimmu.2024.1516737
The systemic inflammation response index (SIRI) predicts survival in advanced non-small cell lung cancer patients undergoing immunotherapy and the construction of a nomogram model
Abstract
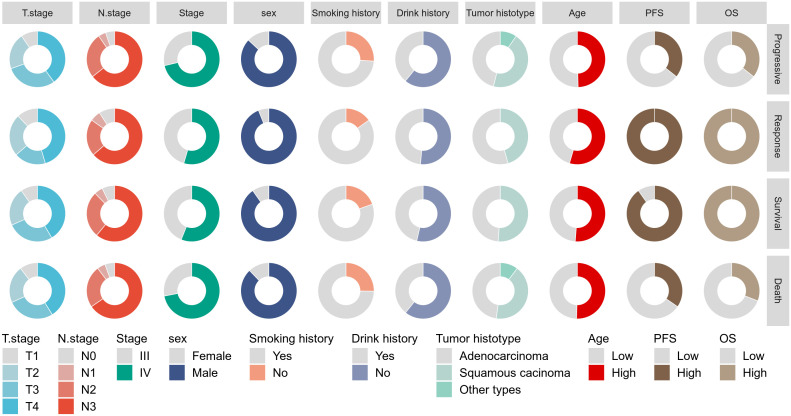
Background: Inflammation and immune evasion are associated with tumorigenesis and progression. The Systemic Inflammation Response Index (SIRI) has been proposed as a pre-treatment peripheral blood biomarker. This study aims to compare the relationship between SIRI, various serum biomarkers, and the prognosis of NSCLC patients before and after treatment.
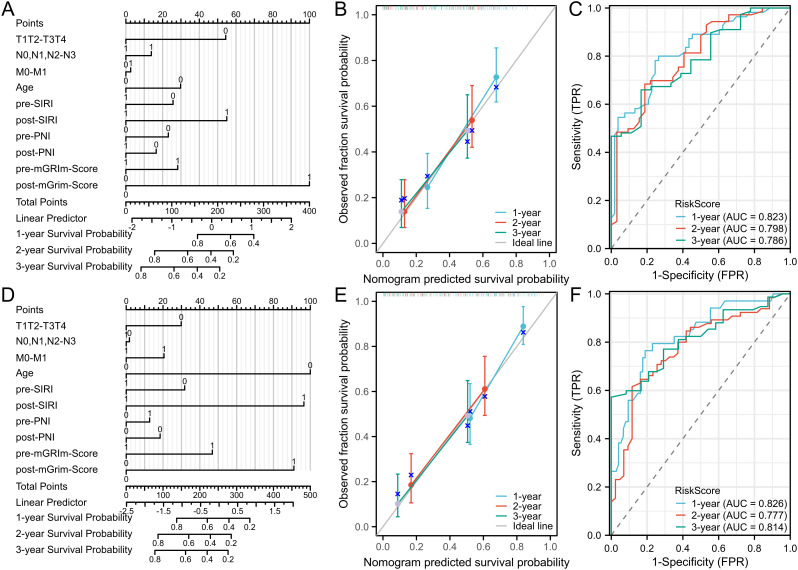
Methods: A retrospective study was conducted on advanced NSCLC patients treated with anti-PD-1 drugs from December 2018 to September 2021. Peripheral blood markers were measured pre- and post-treatment, and hazard ratios were calculated to assess the association between serum biomarkers and progression-free survival (PFS) and overall survival (OS). Kaplan-Meier curves and Cox proportional hazards models were employed for survival analysis. A nomogram model was built based on multivariate Cox proportional hazards regression analysis using the R survival package, with internal validation via the bootstrap method (1,000 resamples). Predictive performance was expressed using the concordance index (C-index), and calibration plots illustrated predictive accuracy.The application value of the model was evaluated by decision curve analysis (DCA).
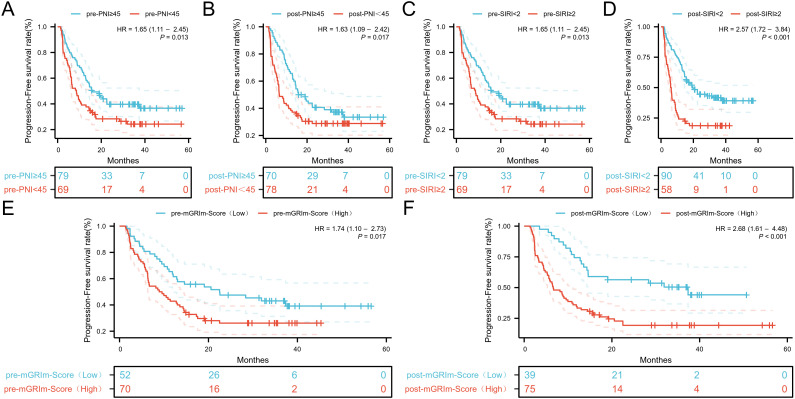
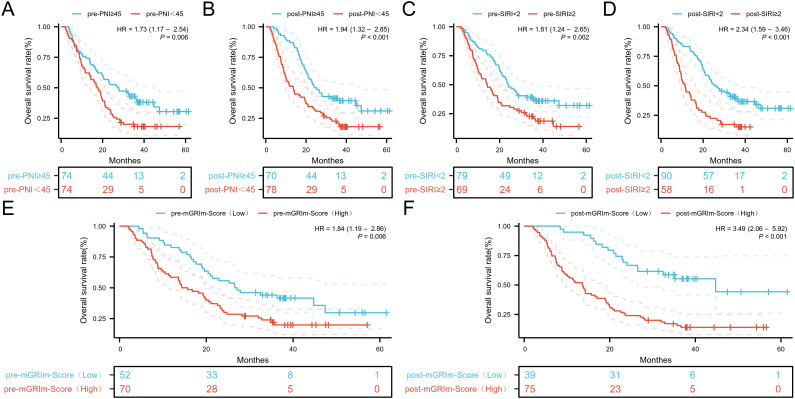
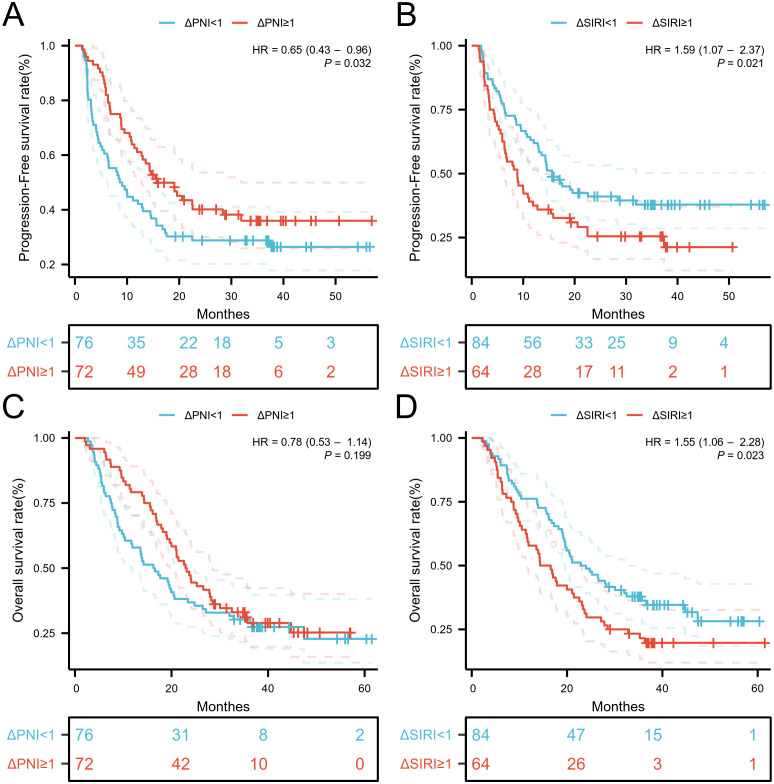
Results: Among 148 advanced NSCLC patients treated with PD-1 inhibitors, the median PFS was 12.9 months (range: 5.4-29.2 months), and the median OS was 19.9 months (range: 9.6-35.2 months). Univariate analysis identified pre- and post-treatment SIRI, mGRIm-Score, and PNI as independent prognostic factors for both PFS and OS (p < 0.05). Multivariate analysis demonstrated that high post-SIRI and post-mGRIm-Score independently predicted poor PFS (P < 0.001, P = 0.004) and OS (P = 0.048, P = 0.001). The C-index of the nomogram model for OS was 0.720 (95% CI: 0.693-0.747) and for PFS was 0.715 (95% CI: 0.690-0.740). Internal validation via bootstrap resampling (B = 1,000) showed good agreement between predicted and observed OS and PFS at 1, 2, and 3 years, as depicted by calibration plots.
Conclusion: SIRI is an important independent predictor of early progression in advanced NSCLC patients treated with PD-1 inhibitors and may assist in identifying patients who will benefit from PD-1 inhibitors therapy in routine clinical practice.
Keywords: immunotherapy; nomogram model; non-small cell lung cancer; prognostic; systemic inflammation response index.
Copyright © 2024 Tang, Zhang, Jia, Wang, Wu, Xu, Ren and Liang.
Conflict of interest statement
The authors declare that the research was conducted in the absence of any commercial or financial relationships that could be construed as a potential conflict of interest.
Figures
Similar articles
-
Construction of a prognostic model for extensive-stage small cell lung cancer patients undergoing immune therapy in northernmost China and prediction of treatment efficacy based on response status at different time points.J Cancer Res Clin Oncol. 2024 May 15;150(5):255. doi: 10.1007/s00432-024-05767-6. J Cancer Res Clin Oncol. 2024. PMID: 38750370 Free PMC article.
-
Predictive value of inflammation and nutritional index in immunotherapy for stage IV non-small cell lung cancer and model construction.Sci Rep. 2024 Jul 30;14(1):17511. doi: 10.1038/s41598-024-66813-4. Sci Rep. 2024. PMID: 39080372 Free PMC article.
-
Development of a lung immune prognostic index-based nomogram model for predicting overall survival and immune-related adverse events in non-small cell lung cancer patients treated with sintilimab.Front Immunol. 2025 May 8;16:1569689. doi: 10.3389/fimmu.2025.1569689. eCollection 2025. Front Immunol. 2025. PMID: 40406139 Free PMC article.
-
Prognostic significance of programmed cell death ligand 1 blood markers in non-small cell lung cancer treated with immune checkpoint inhibitors: a systematic review and meta-analysis.Front Immunol. 2024 Jun 10;15:1400262. doi: 10.3389/fimmu.2024.1400262. eCollection 2024. Front Immunol. 2024. PMID: 38915398 Free PMC article.
-
Single or combined immune checkpoint inhibitors compared to first-line platinum-based chemotherapy with or without bevacizumab for people with advanced non-small cell lung cancer.Cochrane Database Syst Rev. 2020 Dec 14;12(12):CD013257. doi: 10.1002/14651858.CD013257.pub2. Cochrane Database Syst Rev. 2020. Update in: Cochrane Database Syst Rev. 2021 Apr 30;4:CD013257. doi: 10.1002/14651858.CD013257.pub3. PMID: 33316104 Free PMC article. Updated.
Cited by
-
Pathological complete response and prognostic predictive factors of neoadjuvant chemoimmunotherapy in early stage triple-negative breast cancer.Front Immunol. 2025 May 12;16:1570394. doi: 10.3389/fimmu.2025.1570394. eCollection 2025. Front Immunol. 2025. PMID: 40421023 Free PMC article. Clinical Trial.
-
Nomogram based on the advanced lung cancer inflammation index and other relevant clinical factors for patients with cervical squamous cell carcinoma undergoing concurrent chemoradiotherapy.BMC Cancer. 2025 Jul 1;25(1):1043. doi: 10.1186/s12885-025-14465-6. BMC Cancer. 2025. PMID: 40597903 Free PMC article.
-
Prognostic value of systemic inflammation response index in patients with glioma: a meta-analysis.Front Immunol. 2025 May 23;16:1576845. doi: 10.3389/fimmu.2025.1576845. eCollection 2025. Front Immunol. 2025. PMID: 40486512 Free PMC article.
-
"Pre-Treatment" and "Post-Treatment" Systemic Inflammatory Markers: Is There Any Prognostic Role for Metastatic Cervical Cancer on Bevacizumab Containing Treatment?Medicina (Kaunas). 2025 Jun 17;61(6):1100. doi: 10.3390/medicina61061100. Medicina (Kaunas). 2025. PMID: 40572788 Free PMC article.
-
Low serum neopterin early indicates durable benefits of atezolizumab and pembrolizumab therapy in advanced lung cancer.Sci Rep. 2025 Apr 16;15(1):13078. doi: 10.1038/s41598-025-97792-9. Sci Rep. 2025. PMID: 40240475 Free PMC article.
References
MeSH terms
Substances
LinkOut - more resources
Full Text Sources
Medical