. 2024 Dec 11;7(6):790-801.
doi: 10.1002/agm2.12385. eCollection 2024 Dec.

SAHA inhibits lung fibroblast activation by increasing p66Shc expression epigenetically

Affiliations

SAHA inhibits lung fibroblast activation by increasing p66Shc expression epigenetically

Yiheng Dong et al. Aging Med (Milton). .

Abstract

Objectives: To investigate the effects of suberoylanilide hydroxamic acid (SAHA) on lung fibroblast activation and to examine the role of p66Shc in this process.

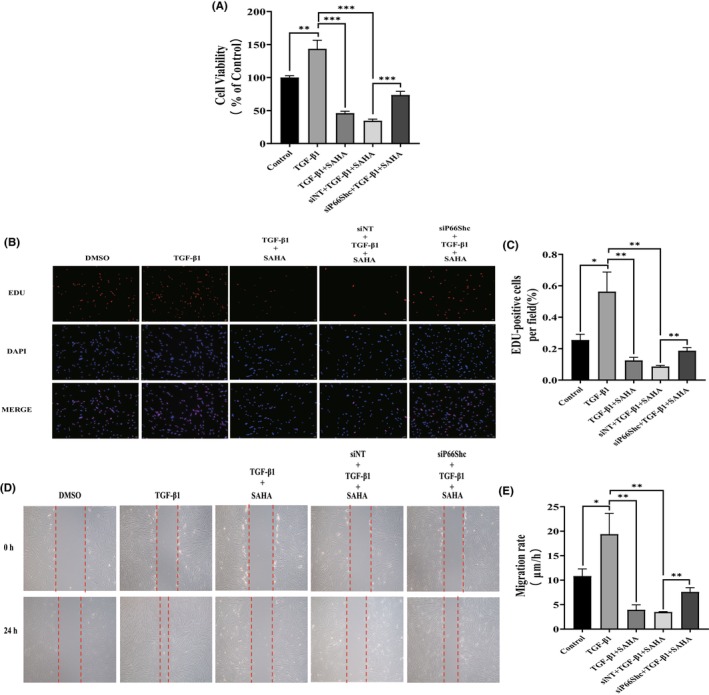
Methods: An in vitro pulmonary fibrosis model was established using transforming growth factor-β (TGF-β)-induced MRC-5 lung fibroblasts. The proliferation and migration capacities of MRC-5 cells, along with the expression of fibrosis-related genes, were assessed following treatment with SAHA and/or silence of p66Shc.

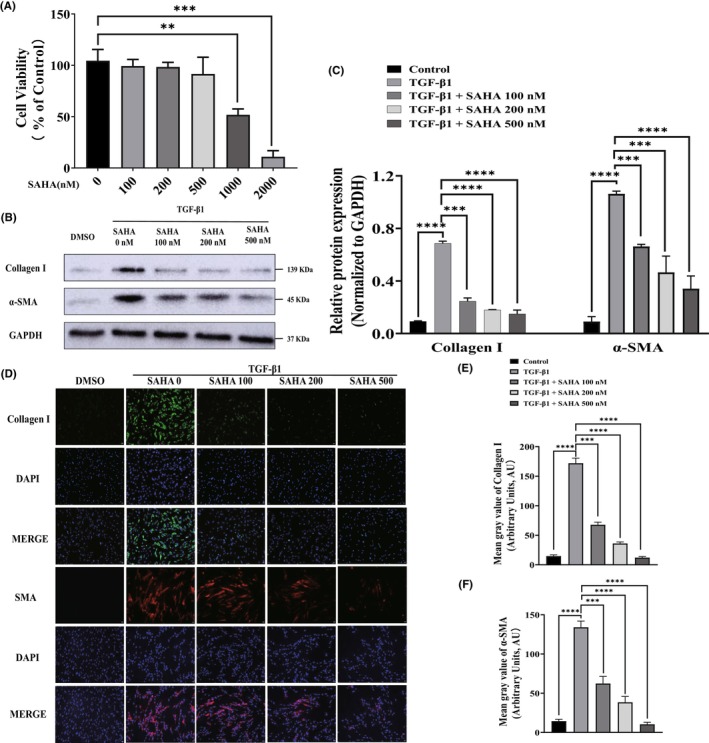
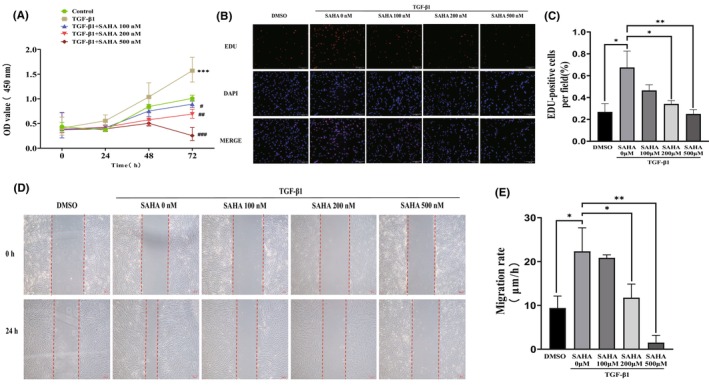
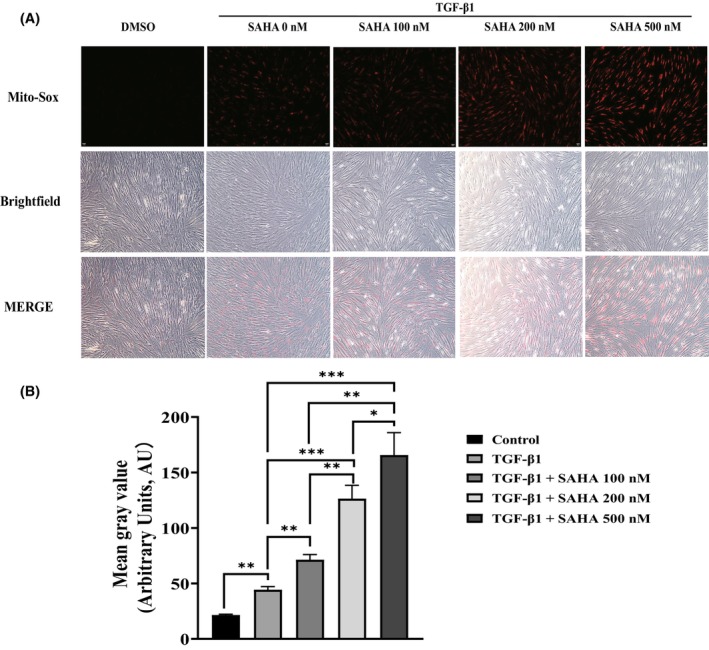
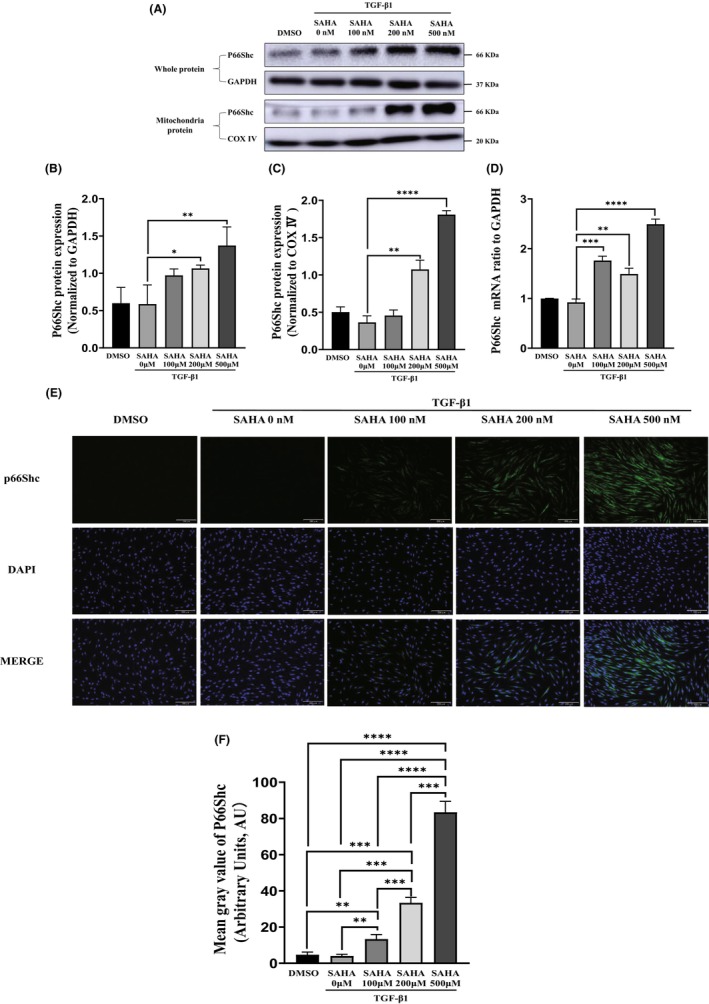
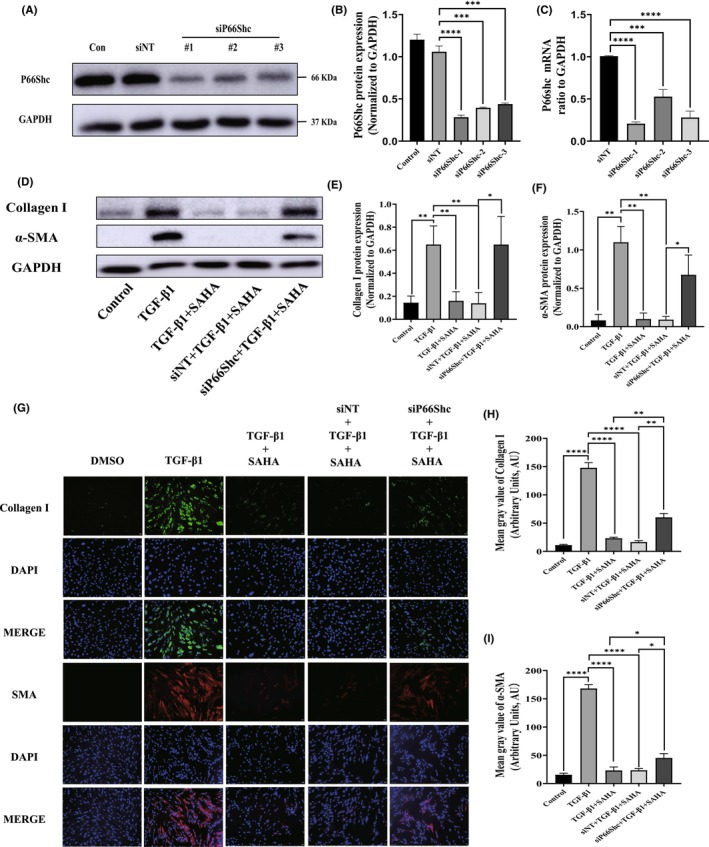
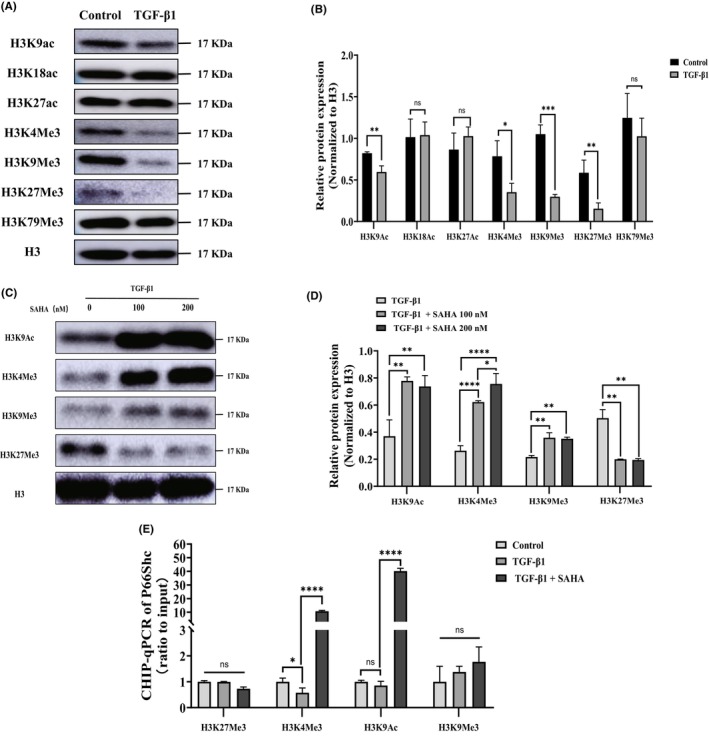
Results: In TGF-β-induced MRC-5 lung fibroblasts, SAHA treatment significantly inhibited cell proliferation and migration, as well as the expression of fibrosis-related genes, including collagen I and α-smooth muscle actin (SMA). Western blot and immunofluorescence assays revealed that SAHA increased p66Shc expression in both whole cells and mitochondria. Additionally, mito-SOX assay confirmed that SAHA treatment led to a marked accumulation of mitochondrial reactive oxygen species (ROS). However, silencing of p66Shc significantly reversed the aforementioned effects of SAHA on MRC-5 cells. Furthermore, chromatin immunoprecipitation (ChIP) assays demonstrated that SAHA enhanced active histone markers, H3K9Ac and H3K4Me3, in the p66Shc gene region.

Conclusions: SAHA alleviates lung fibroblast activation and migration by increasing p66Shc expression and mitochondrial ROS generation through epigenetic modifications of histone 3.

Keywords: SAHA; histone modification; lung fibroblasts; p66Shc; pulmonary fibrosis.


Conflict of interest statement

The authors declare that the research was conducted in the absence of any commercial or financial relationships that could be construed as a potential conflict of interest.

Figures

FIGURE 1
FIGURE 1
SAHA inhibited TGF‐β1‐induced activation of lung fibroblasts. (A) The viability of MRC‐5 cells incubated with different concentrations of SAHA for 24 h (n = 3). (B, C) Western blot analysis and quantification of collagen I and α‐SMA protein levels in MRC‐5 cells treated with different concentrations of SAHA for 24 h in the presence of TGF‐β1 (n = 3). (D, E, and F) Immunofluorescence images and quantification of collagen I (green) and α‐SMA (red) in TGF‐β1‐induced MRC‐5 cells treated with different concentrations of SAHA (n = 3). The bars represent the mean ± SD of three separate experiments. * indicates p < 0.050, ** indicates p < 0.010, *** indicates p < 0.001, **** indicates p < 0.0001.
FIGURE 2
FIGURE 2
SAHA inhibits TGF‐β1‐induced proliferation and migration of MRC‐5 cells. (A) The CCK‐8 assay of MRC‐5 cells exposed to different concentrations of SAHA for 24, 48, and 72 h in the presence of TGF‐β1 (n = 3). (B, C) Fluorescence images and quantification of EdU incorporation assay in MRC‐5 cells co‐cultured with TGF‐β1 and different concentrations of SAHA for 24 h (n = 3). (D, E) Images and quantification of wound healing assay in MRC‐5 cells treated with TGF‐β1 and different concentrations of SAHA for 24 h (n = 3). The bars represent the mean ± SD of three separate experiments. * indicates p < 0.050, ** indicates p < 0.010, *** indicates p < 0.001, **** indicates p < 0.0001. # indicates p < 0.050, ## indicates p < 0.010, ### indicates p < 0.001.
FIGURE 3
FIGURE 3
SAHA increases mitochondrial ROS in MRC‐5 cells. (A) Fluorescence and bright‐field images of MRC‐5 cells treated with mito‐SOX red after exposure to TGF‐β1 and different concentrations of SAHA (n = 3). (B) Quantification of mean gray value of mito‐SOX (n = 3). The bars represent the mean ± SD of three separate experiments. * indicates p < 0.050, ** indicates p < 0.010, *** indicates p < 0.001.
FIGURE 4
FIGURE 4
SAHA increases the expression of p66Shc. (A, B, C, and D) Protein expression (both whole‐cell protein and mitochondrial protein) and mRNA expression of p66Shc in MRC‐5 cells treated with TGF‐β1 and different concentrations of SAHA (n = 3). (E, F) Immunofluorescence images and quantification of p66Shc (green) in MRC‐5 cells treated with TGF‐β1 and different concentrations of SAHA (n = 3). The bars represent the mean ± SD of three separate experiments. * indicates p < 0.050, ** indicates p < 0.010, *** indicates p < 0.001, **** indicates p < 0.0001.
FIGURE 5
FIGURE 5
Silencing p66Shc inhibits the differentiation of lung fibroblasts. (A, B, and C) Protein and mRNA expression of p66Shc in MRC‐5 cells transfected with either NC siRNA or p66Shc siRNA for 24 h (n = 3). (D, E, and F) Protein and mRNA expression of collagen I and α‐SMA in MRC‐5 cells transfected with either NC siRNA or p66Shc siRNA for 24 h in the presence of TGF‐β1 and SAHA (n = 3). (G, H, and I) Immunofluorescence images and quantification of collagen I (green) and α‐SMA (red) in MRC‐5 cells (n = 3). The bars represent the mean ± SD of three separate experiments. * indicates p < 0.050, ** indicates p < 0.010, *** indicates p < 0.001, **** indicates p < 0.0001.
FIGURE 6
FIGURE 6
Silencing p66Shc inhibits the proliferation and migration of lung fibroblasts. (A) Cell viability of MRC‐5 cells exposed to SAHA and TGF‐β1, and transfected with either NC siRNA or p66Shc siRNA for 24 h (n = 3). (B and C) Immunofluorescence images and statistical analysis of EdU incorporation assay in MRC‐5 cells transfected with either NC siRNA or p66Shc siRNA and co‐cultured with TGF‐β1 and SAHA (n = 3). (D and E) Images and statistical analysis of the wound healing assay in MRC‐5 cells transfected with either NC siRNA or p66Shc siRNA and treated with TGF‐β1 and SAHA (n = 3). The bars represent the mean ± SD of three separate experiments. * indicates p < 0.050, ** indicates p < 0.010, *** indicates p < 0.001, **** indicates p < 0.0001.
FIGURE 7
FIGURE 7
Histone modifications mediate the upregulation of p66Shc expression by SAHA. (A, B, C, and D) Acetylation and methylation modifications of histone H3 in lung fibroblasts after treatment with TGF‐β1 and SAHA (n = 3). (E) Modification of histone H3 in the region of the p66Shc gene after TGF‐β1 and SAHA treatment (n = 3). The bars represent the mean ± SD of three separate experiments. * indicates p < 0.050, ** indicates p < 0.010, *** indicates p < 0.001, **** indicates p < 0.0001.

Similar articles

Cited by

References

    1. Spagnolo P, Kropski JA, Jones MG, et al. Idiopathic pulmonary fibrosis: disease mechanisms and drug development. Pharmacol Ther. 2021;222:107798. doi:10.1016/j.pharmthera.2020.107798 - DOI - PMC - PubMed
    1. Cho SJ, Stout‐Delgado HW. Aging and Lung Disease. Annu Rev Physiol. 2020;82:433‐459. doi:10.1146/annurev-physiol-021119-034610 - DOI - PMC - PubMed
    1. Moss BJ, Ryter SW, Rosas IO. Pathogenic mechanisms underlying idiopathic pulmonary fibrosis. Annu Rev Pathol. 2022;17:515‐546. doi:10.1146/annurev-pathol-042320-030240 - DOI - PubMed
    1. Alder JK, Armanios M. Telomere‐mediated lung disease. Physiol Rev. 2022;102:1703‐1720. doi:10.1152/physrev.00046.2021 - DOI - PMC - PubMed
    1. Spencer LG, Loughenbury M, Chaudhuri N, Spiteri M, Parfrey H. Idiopathic pulmonary fibrosis in the UK: analysis of the British Thoracic Society electronic registry between 2013 and 2019. ERJ Open Res. 2021;7:00187‐2020. doi:10.1183/23120541.00187-2020 - DOI - PMC - PubMed

LinkOut - more resources