. 2024 Nov 28:89:e549-e560.
doi: 10.5114/pjr/193968. eCollection 2024.

Neurocysticercosis: unwinding the radiological conundrum

Affiliations

Neurocysticercosis: unwinding the radiological conundrum

Sharath Kumar Goddu Govindappa et al. Pol J Radiol. .

Abstract

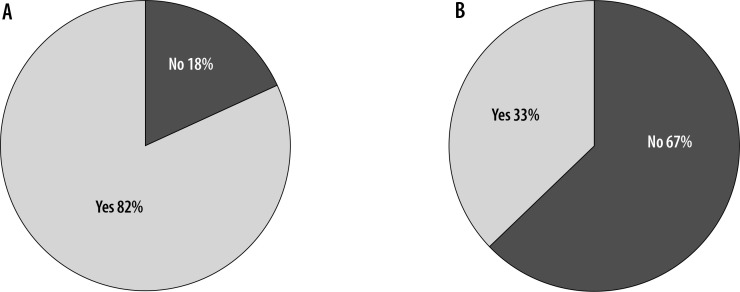
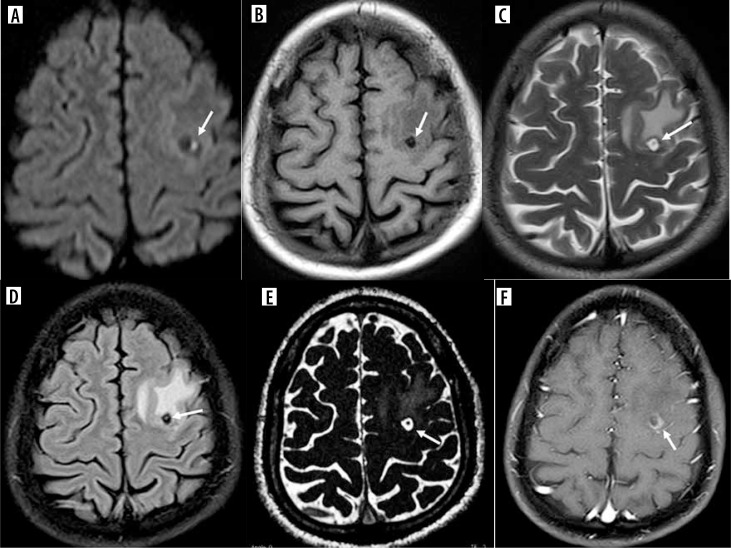
Purpose: To study the distinct imaging characteristics of parenchymal neurocysticercosis (NCC) that aid in distinguishing it from other diseases.

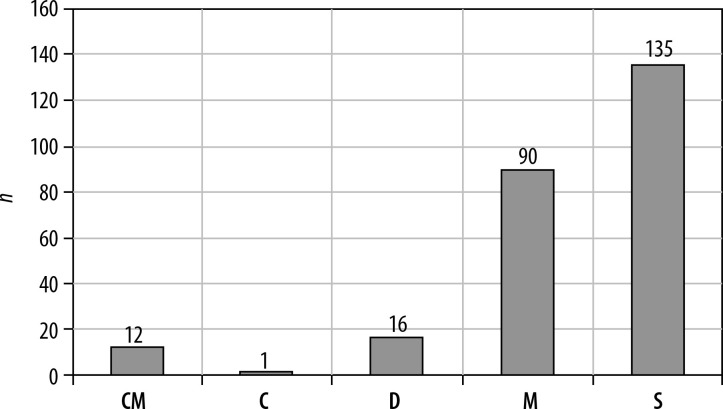
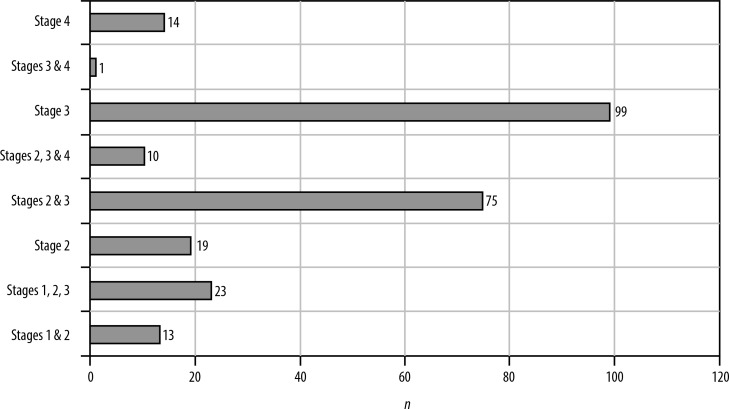
Material and methods: Two hundred fifty patients with NCC were selected based on identification of the scolex. T2 weighted, T1 fluid attenuated inversion recovery (FLAIR), T2 FLAIR, susceptibility weighted imaging, constructive interference in steady state, diffusion weighted imaging, and T1 weighted contrast sequences were performed. The imaging characteristics of the cysts at various stages were analyzed.

Results: This study presents previously undocumented imaging findings of NCC, establishing absolute, major, and minor criteria for its diagnosis based on magnetic resonance imaging features.

Conclusions: Utilizing imaging criteria for diagnosing NCC, as per the study's sequences, can effectively narrow down differential diagnoses and lead to accurate identification.

Keywords: Taenia solium; corona sign; degenerating neurocysticercus cyst; magnetic resonance imaging; neurocysticercosis; scolex.


Figures

Figure 1
Figure 1
Patients with neurocysticercosis aged from 7 to 70 years
Figure 2
Figure 2
Number of lesions in each category. CM – conglomerated multiple, C – calcified, D – disseminated, M – multiple, S – single
Figure 3
Figure 3
Intracranial neurocysticercosis lesions in our patients. A) Post-contrast fat saturated T1 coronal image shows a solitary ring enhancing lesion (arrow) in the right occipital cortex minimal perilesional edema. B) T2 coronal image shows few conglomerated lesions (arrow) in the occipital lobe with moderate perilesional edema. C) Post-contrast fat-saturated T1 axial image shows multiple small ring enhancing lesions in bilateral cerebral hemispheres (arrow). D) Axial CT shows a calcified lesion (circle)
Figure 4
Figure 4
Different combinations of stages of neurocysticercosis during the study
Figure 5
Figure 5
Stages of neurocysticercosis (NCC). A) Coronal T1 FLAIR image shows a well-defined cystic lesion with iso or hyperintense scolex in the background of hypointensity (arrow) in the right occipital cortex, representing the vesicular stage. Note that there is no perilesional edema. B) Axial T2 image shows a round hyperintense cystic lesion with hypointense rim and a scolex, associated with perilesional edema representing the colloidal stage (arrow). C, D) Stage 3 of NCC showing diffusion restriction of the cyst with perilesional edema suggesting a degenerating cyst (arrows). E) Axial CT showing calcified cyst depicting stage 4 disease (circle)
Figure 6
Figure 6
Scolex appearance in difference sequences. A) Axial CISS image showing hypointense scolex in the background of hyperintense cyst (arrow) in left frontal cortex. B) Axial SWI image showing hypointense scolex (arrow) in left occipital cortex. C) Axial DWI image reveals hyperintense scolex within the hypointense cyst in head of left caudate nucleus (arrow)
Figure 7
Figure 7
Shape of scolices. A, B) Axial CISS images showing nodular and comma-shaped scolices respectively (arrows). C) Coronal CISS shows septate scolex (arrow)
Figure 8
Figure 8
A, B) T2 and CISS axial images showing typical appearance of neurocysticercosis cyst as central hyperintense contents with hypointense rim (arrows)
Figure 9
Figure 9
Pie charts showing number of neurocysticercosis patients showing hypointense wall and cyst suppression on T2-FLAIR. A) T2 hypointense wall, B) T2 FLAIR suppression
Figure 10
Figure 10
A) T2 axial image reveals hyperintense cyst with hypointense wall in the right parietal cortex (arrow). B) T2 FLAIR axial image of the same patient showing inversion of the cyst contents and hyperintense rim (arrow)
Figure 11
Figure 11
Colloidal stage of neurocysticercosis. A, B) Axial DWI and T1 images show hypointense cyst and hyperintense scolex within (arrows). C) Axial T2 image reveals hyperintense cyst with hypointense rim and scolex (arrow). D) Axial T2 FLAIR image shows inversion of cyst contents with hyperintense scolex within (arrow). E) Axial CISS depicts similar appearance of the cyst as that of T2 weighted image (arrow). F) Axial T1 post-contrast image shows ring enhancing lesion and a tiny enhancing scolex (arrow). Note the associated perilesional edema in all the sequences
Figure 12
Figure 12
Granular nodular stage of neurocysticercosis (NCC). A, B) Axial DWI and ADC images showing restricted diffusion of the cyst (arrows). C) Axial T2 FLAIR image shows no inversion of the cyst contents (arrow). D, E) SWI and T2 images showing nodular NCC as hypointense nodules (arrow). E) Axial T1 post-contrast image shows ring enhancing cystic lesion (arrow). Note the perilesional edema in all the sequences
Figure 13
Figure 13
Corona sign in neurocysticercosis (NCC). A) Sagittal non-contrast T1 image shows hypointense cyst with isointense rim and edema (arrow). B) Corona sign depiction on contrast image shows non-enhancing hypointense center (long arrow), surrounded by a thick enhancing rim (curved arrow) and finally the perilesional edema as blurred or hazy enhancement (short arrow). C) Solar corona having similar appearance. D-F) Coronal, axial and sagittal T1 contrast images reveal corona sign of NCC
Figure 14
Figure 14
Calcified stage of neurocysticercosis. A) Axial CT shows calcified nodule with perilesional edema in left parietal cortex (arrow). B) Axial T2 image of the same patient shows calcified nodule as hypointense nodule with perilesional edema (arrow). C) Axial post-contrast T1 image of the same patient shows ring enhancement of the same calcified lesion (arrow).
Figure 15
Figure 15
Typical appearance of tuberculosis caseating granuloma. A, B) Axial T2 sequence and zonal diagram shows central zone of T2 hypointensity surrounded by zone of intermediate intensity and the peripheral hyperintense zone (arrow)

Similar articles

Cited by

References

    1. Del Brutto OH. Neurocysticercosis. Neurohospitalist 2014; 4: 205-212. - PMC - PubMed
    1. Del Brutto OH. Human cysticercosis (Taenia solium). Trop Parasitol 2013; 3: 100-103. - PMC - PubMed
    1. Rajshekhar V. Evolution of concepts in the management of cysticercosis of the brain: Then (1970) and now (2018). Neurol India 2018; 66: 919-927. - PubMed
    1. Tharmalingam J, Prabhakar AT, Gangadaran P, Dorny P, Vercruysse J, Geldhof P, et al. . Host Th1/Th2 immune response to Taenia soliumcyst antigens in relation to cyst burden of neurocysticercosis. Parasite Immunol 2016; 38: 628-634. - PubMed
    1. Arora N, Tripathi S, Sao R, Mondal P, Mishra A, Prasad A. Molecular neuro-pathomechanism of neurocysticercosis: how host genetic factors influence disease susceptibility. Mol Neurobiol 2018; 55: 1019-1025. - PubMed

LinkOut - more resources