Review
. 2025 Jan 8;17(1):104.
doi: 10.1007/s40820-024-01611-1.

Local Strain Engineering of Two-Dimensional Transition Metal Dichalcogenides Towards Quantum Emitters

Affiliations
Review

Local Strain Engineering of Two-Dimensional Transition Metal Dichalcogenides Towards Quantum Emitters

Ruoqi Ai et al. Nanomicro Lett. .

Abstract

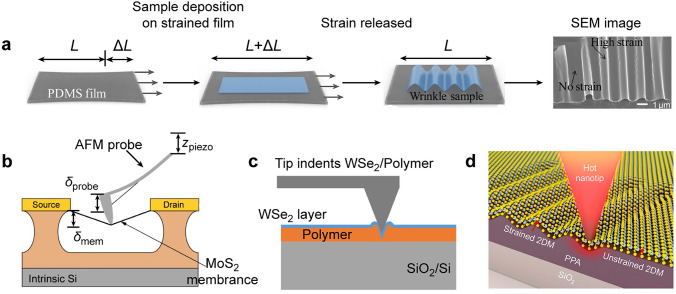
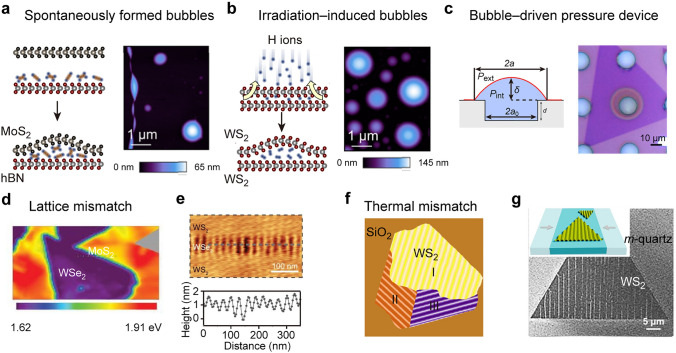
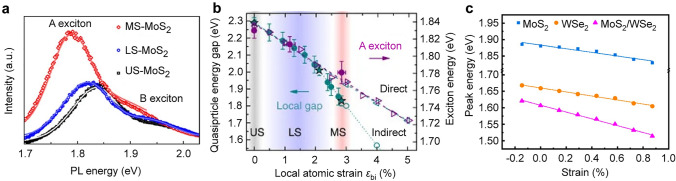
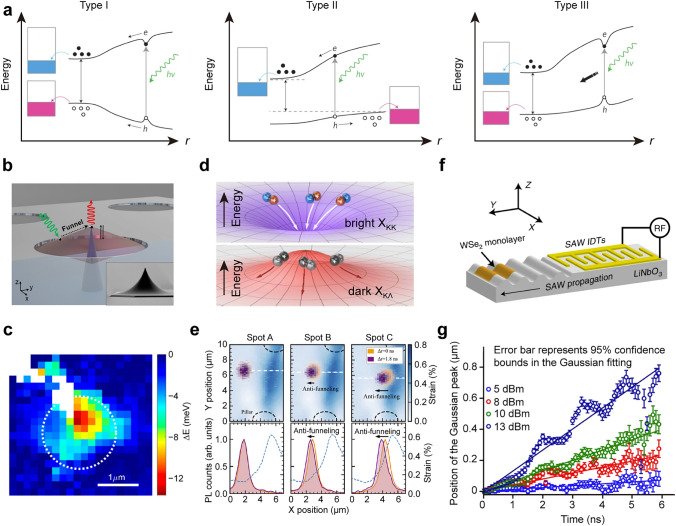
Two-dimensional transition metal dichalcogenides (2D TMDCs) have received considerable attention in local strain engineering due to their extraordinary mechanical flexibility, electonic structure, and optical properties. The strain-induced out-of-plane deformations in 2D TMDCs lead to diverse excitonic behaviors and versatile modulations in optical properties, paving the way for the development of advanced quantum technologies, flexible optoelectronic materials, and straintronic devices. Research on local strain engineering on 2D TMDCs has been delved into fabrication techniques, electronic state variations, and quantum optical applications. This review begins by summarizing the state-of-the-art methods for introducing local strain into 2D TMDCs, followed by an exploration of the impact of local strain engineering on optical properties. The intriguing phenomena resulting from local strain, such as exciton funnelling and anti-funnelling, are also discussed. We then shift the focus to the application of locally strained 2D TMDCs as quantum emitters, with various strategies outlined for modulating the properties of TMDC-based quantum emitters. Finally, we discuss the remaining questions in this field and provide an outlook on the future of local strain engineering on 2D TMDCs.

Keywords: Excitonic behaviors; Local strain; Quantum emitters; Two-dimensional transition metal dichalcogenides.


Conflict of interest statement

Declarations. Conflict of Interest: The authors declare no interest conflict. They have no known competing financial interests or personal relationships that could have appeared to influence the work reported in this paper.

Figures

Fig. 1
Fig. 1
Creating local strain with pre-strained elastomer substrates and nanotips. a Schematic diagram showing the wrinkles formed in WSe2 layers through buckling-induced delamination. The last image is a representative scanning electron microscope (SEM) image of the obtained wrinkle structures. L represents the original length of substrates. ΔL is the change in the length variation of the elastomeric substrates relative to their original length during the stretching process. Reproduced with permission from [46]. Copyright 2017 American Chemical Society. b Setup for measuring the electrical properties of a suspended MoS2 membrane under strain applied by an AFM tip connected to a piezo scanner. The vertical displacement of the scanner (δpiezo) induces deformation in the centrally located MoS2 membrane. The deflection of the cantilever is δprobe. The vertical displacement of the membrane is δmem. Reproduced with permission from [51]. Copyright 2015 American Chemical Society. c An AFM tip applying local force on a WSe2/PMMA layer. Reproduced with permission from [52]. Copyright 2019 American Chemical Society. d Schematic of strain deformation of 2D materials using t-SPL technique. Reproduced with permission from [53]. Copyright 2020 American Chemical Society
Fig. 2
Fig. 2
Local strain induced by lattice and thermal mismatch and bubbles. a Spontaneously formed bubbles. Left: Schematic illustration of bubbles fabricated by the spontaneous process. Right: AFM image for the bubbles produced in a MoS2/hBN vertical heterostructure. Reproduced with permission from [72]. Copyright 2021 American Physical Society. b Irradiation-induced bubbles. Left: Schematic illustration of bubbles fabricated with ion irradiation. Right: AFM image for the bubbles produced in a WS2/WS2 homostructure. Reproduced with permission from [72]. Copyright 2021 American Physical Society. c Bubble-driven pressure device. Left: Schematic diagram of a bubble-driven device by utilizing pressure difference. The chamber pressure is Pint, and the external pressure is Pext = 1 atm. The bubble radius and height are represented by a and δ, respectively. a0 represents the radius of the cylindrical microcavity. Right: Bright field optical microscope image of a formed bubble. Reproduced with permission from [83]. Copyright 2017 American Chemical Society. d PL mapping for the lateral WSe2/MoS2 heterostructures with PL peak variation in MoS2 region. Reproduced with permission from [87]. Copyright 2015 Springer Nature. e Lattice mismatch-induced ripples. Top: Representative AFM image of WS2/WSe2 superlattices. Bottom: Height profile extracted from the dashed line in the top AFM image. Reproduced with permission from [88]. Copyright 2018 AAAS. f Three rippling domains marked by I, II, and III induced by thermal mismatch in CVD-grown WS2 flake during cooling. Reproduced with permission from [89]. Copyright 2021 American Chemical Society. g SEM image for the WS2 wrinkles formed on m-quartz substrates. Inset schematic shows the thermal mismatch-induced strain distributing in a specific orientation. Reproduced with permission from [90]. Copyright 2021 American Chemical Society
Fig. 3
Fig. 3
Local strain induced by patterned templates. a Schematic showing a gold nanodisk covered with a monolayer WS2 and schematic showing the working principle of the syructures. The E(A), E(G), and E(LX) represent the energy levels of the neutral excitons, ground state excitons, and strain-localized excitons, represpectively. Reproduced with permission from [107]. Copyright 2022 American Chemical Society. b PL spectra obtained from 1L WSe2 placed on GaP substrate (red) and GaP nanoantennas (orange). Inset image: AFM image of a monolayer WSe2 on the top of GaP nanoantennas. The strain is localized within the edges of the nanoantennas. Reproduced with permission from [116]. Copyright 2019 Springer Nature. c AFM image of monolayer WSe2 wrinkles on the nanocone array. The scale bar is 500 nm. Reproduced with permission from [103]. Copyright 2024 Springer Nature. d AFM phase image of monolayer WS2 deposited on the pre-patterned donut array. e PL spectra obtained from the positions A–C shown in inset image. Inset image: AFM image collected from a single donut covered with a layer of WS2. The height of the donut is 20 nm. The blue line represents the height profile of the donut. Reproduced with permission from [120]. Copyright 2019 AAAS. f Top: Schematic illustrating the cross-section of the monolayer WS2 grown on the suspended Si3N4/Si substrate. Bottom: Band structure of the monolayer WS2 between the pore and wall. Reproduced with permission from [121]. Copyright 2023 American Chemical Society
Fig. 4
Fig. 4
Local strain-modulated excitonic properties. a PL spectra collected from the most strained-MoS2 (MS-MoS2, red symbol), less strained-MoS2 (LS-MoS2, blue symbol), and unstrained-MoS2 (US-MoS2, black symbol). b Theoretical and experimental results for the exciton energy (magenta, right axis) and the quasiparticle energy (cyan, left axis). The hollow symbol represents theoretical data, and the solid symbol represents experimental data. Reproduced with permission from [130]. Copyright 2015 Springer Nature. c Deformation peak energy of the intralayer excitons in MoS2, WSe2 and the interlayer exciton in MoS2/WSe2 as a function of strain. The solid symbols represent the measured data. The dashed lines represent the linear fitting results. Reproduced with permission from [123]. Copyright 2021 American Chemical Society
Fig. 5
Fig. 5
Exciton funnelling and anti-funnelling effects. a Three funnelling mechanisms originating from a different band bending, and exciton binding profiles for the strain-engineered 2D TMDCs. Reproduced with permission from [131]. Copyright 2012 Springer Nature. b Schematic showing dynamic control of exciton flux through a cantilever with a sharp tip applied on a WSe2 layer. The WSe2 layer is suspended on a transmission electron microscopy (TEM) grid. The inset SEM image shows the actual tip. c Spatial map of the free-exciton energy shift due to the indentation. The white dashed circle represents the region collected for the fitting analysis. Reproduced with permission from [21]. Copyright 2020 American Chemical Society. d Schematic illustrating the strain-induced funnelling of the bright exciton (top panel) and anti-funnelling of the dark exciton (bottom panel). The opposite energy shifts of XΚΛ and XΚΚ lead to reverse spatial energy gradients, giving rise to the propagation of dark exciton to the low-strain region. e Exciton anti-funnelling effect in strained WS2 monolayer. Top: Time-resolved PL collected from the strained WS2 region between two micropillars (black dash lines) at a delay time of 0 ns (orange) and 1.8 ns (purple) after the pulsed excitation. The blue map image corresponds to the measured strain distribution profile in the WS2 layer caused by the micropillars. Spot A: Excitation spot is far from a strain gradient, no exciton prepagation can be observed. Spots B and C: When the excitation spot is positioned close to a significant strain gradient, exciton anti-funnelling towards low-strain regions can be observed. Bottom: PL intensity profiles are collected along the horizontal dashed lines crossing the excitation spot in the top images. Reproduced with permission from [136]. Copyright 2021 Springer Nature. f Schematic illustrating the arrangement of a monolayer WSe2 transferred onto a SAW delay line. g Spatial evolution of the Gaussian exciton density peak as a function of time. The circles represent the exciton density peak extracted using Gaussian fitting. Different colors correspond to the data collected under different excitation powers. The error bars represent the 95% confidence interval of the Gaussian fit. Solid lines are the approximate linear fit. Reproduced with permission from [137]. Copyright 2022 Springer Nature
Fig. 6
Fig. 6
Exciton-exciton interactions. a Exciton-to-trion conversion of WS2 monolayer at various strain levels. Top: Strain- and power-dependent PL spectra of monolayer WS2 suspended over a hole. εmax is the maximal strain reached underneath the AFM tip. The blue curve represents the PL spectrum collected from unstrained regions under an excitation power of 30 μW. The red and purple curves correspond to the PL spectra collected from the strained region (εmax = 1.5%) under excitation power of 8 nW and 30 μW, respectively. Bottom: Strain-dependent PL spectra for the n-doped WS2 sample collected under different strains. Two PL peaks can be detected in the unstrained region, one of which locates at 1.965 eV corresponding to trions. Reproduced with permission from [22]. Copyright 2020 Springer Nature. b Tip-enhanced PL spectra collected from monolayer MoS2 under a series of dynamic strain. The white and black dashed lines correspond to the energy of neutral exciton (X0) and trion (X). The dynamic strain is realized by pressing the gold tip onto MoS2 and subsequently releasing it from MoS2. Reproduced with permission from [23]. Copyright 2022 AAAS. c Evolution of the linewidth of interlayer trion (Γ, yellow), interlayer exciton intensity (IIX, red), and intensity ratio of interlayer exciton and interlayer trion (IIX/IIX–, blue) as the tip‒sample distance changes. When the distance increased to 10 nm, the Γ and IX– increased, meaning the hot e induced IX– generation. Reproduced with permission from [140]. Copyright 2023 Springer Nature. d Hybridization of dark exciton and defect states. Top: Schematic showing the band structure of WSe2 in the K and K′ valleys under different strain levels. The strain for the right panel is 1.2%, and the strain for the left panel is 2.4%. Bottom: Calculated band structures of WSe2 under strain of 1.2% and 2.4%. e Evolution of PL spectra mapping as a function of strain. When the energy of dark excitons matches either D1 or D2 energy, the oscillator strength shows significant enhancements and the anti-crossing behavior becomes apparent. The strain is about 1.2% and 2.4% for the observation of hybridization with D1 and D2, respectively. Reproduced with permission from [141]. Copyright 2022 Springer Nature. f Strain effect on exciton hybridation and gyromagnetic factor. Top: Strain dependence of the energy of coupled direct (A exc., red) and indirect exciton (I exc., blue) described by the upper (U) and lower (L) branches. Bottom: Measured and calculated g-factor as a function of biaxial strain. The yellow circles represent g-factors collected in the Bitter magnet. The yellow diamonds represents g-factors measured in the superconducting magnet. The solid and dashed lines were obtained under the assumption of gI > 0 and gI < 0, respectively. gI represents the g-factor for the indirect exciton. Reproduced with permission from [142]. Copyright 2022 American Physical Society
Fig. 7
Fig. 7
Phase transition and nonlinear optics under local strain effects. a Top: Schematic showing the change in atomic structures of MoTe2 with tensile strain. Bottom: Barrier energy of the phase transition lowered by tensile strain. Reproduced with permission from [153]. Copyright 2015 American Chemical Society. b Schematic illustrating the phase transition from the 2H to 1T′ phase as the crack propagates along the MoSe2/WSe2 alloy at a strain of 2.15%. Two different crystal structures occur in the displaying region. The green atoms are located at the interface of the 2H and 1T′ phases. Reproduced with permission from [155]. Copyright 2018 American Chemical Society. c Phase transition of 1T′ WTe2 as a function of strain along a and b directions. Black circles represent the measured data. Reproduced with permission from [156]. Copyright 2020 American Physical Society. d SHG intensity response for the flat, folded (1 layer and 3 layers), and strained wrinkled (5 layers) regions of WS2 layers. Reproduced with permission from [157]. Copyright 2020 American Chemical Society. e Polar image of the measured SHG intensity from the bare MoS2 monolayer (red) and the MoS2/TiO2 hybrid structure (blue) as a function of the polarization angle of the pump light. The stacking angle between the crystal orientation of MoS2 layer and the orientation of TiO2 nanowire is 0°. Reproduced with permission from [158]. Copyright 2019 American Chemical Society. f Reversible strain manipulation. Top: Schematc of the optical fiber nanowire coupled with a WS2 monolayer. Bottom: Measured SHG intensity of WS2 monolayer coupled optical fiber nanowires as the function of the strain. Reproduced with permission from [159]. Copyright 2019 Springer Nature
Fig. 8
Fig. 8
Single-photon emission in 2D TMDCs. a Spatially-resolved color-coded PL intensity map in the wavelength range of 660–830 nm. b Second-order photon correlation measurement from a representative quantum emitter at a nanopillar location. The red line represents the fitting results with g2(0) = 0.07 ± 0.04 and τ = 2.8 ± 0.2 ns. c PL spectra obtained from the indicated nanopillar locations shown in (a). The red and black lines with weaker signals correspond to PL spectra collected from unstrained regions of the WSe2 monolayer and bilayer, respectively. Reproduced with permission from [26]. Copyright 2017 Springer Nature. d PL intensity map of the quantum emitter in a WSe2 monolayer as a function of the polarization detection angle and photon energy. Five pairs of cross-linearly polarized spectral doublets are identified. e Distribution of the fine structure splitting is measured from 16 individual quantum emitters in the WSe2 monolayer. Reproduced with permission from [204]. Copyright 2015 Springer Nature. f Magnetic field dependence of PL spectra collected at the edge spot of a WSe2 monolayer. The top and bottom panels correspond to the PL spectra resolved in σ + and σ– circular polarizations, respectively. The extracted g-factors of the emission lines from the two quantum emitters are 9.5 and 12.4. Reproduced with permission from [206]. Copyright 2015 Springer Nature
Fig. 9
Fig. 9
Integration of photonic nanostructures and quantum emitters. a Electric field enhancement contours in the x–y plane, with the excitation along the x-axis. The diameter and the height of each GaP nanopillar are 150 and 200 nm, respectively. The spacing between two nanopillars is 50 nm. Scale bar: 150 nm. b Relationship between the decay time and the PL intensity in every pulse. The red and blue spots correspond to the data collected from the single photon emitters formed on GaP dimer nanoantennas and on SiO2 nanopillars, respectively. The red and the blue regions represent the formed emitters with quantum efficiency > 10% and < 10%, respectively. c Relationship between the occurrence of an emitter and the excitation power density. A pulse energy of 1fJ corresponds to the energy density per pulse of 30 nJ cm−2. The single-photon emitters coupled with GaP dimer nanopillars can be observed at low excitation power. Reproduced with permission from [117]. Copyright 2021 Springer Nature. d Molecular dynamics simulation of the strain field in a WSe2 monolayer induced by a gold nanostar. The top panel is the atomic model. The inset images show the contact region between the WSe2 monolayer and the arms of the gold nanostars. The bottom panels are the cross-section views of the inset region from the top panel. Reproduced with permission from [111]. Copyright 2020 American Chemical Society. e Polar plot of the polarization features of three individual quantum emitters collected from the rectangular nanopillars. Reproduced with permission from [110]. Copyright 2018 Optica Publishing Group. f Measurements of the spontaneous emission lifetime in coupled and uncoupled states. The solid gray line represents a mono-exponential fit with a system response of 65 ps. The grey squares represent the instrument response function for back-reflected laser light. Blue triangles indicate results for the isolated quantum emitter without the cavity. Red circles represent results for the same emitter coupled to the nanocavity. Reproduced with permission from [39]. Copyright 2018 Springer Nature
Fig. 10
Fig. 10
Engineering of quantum emitters. a Histogram showing the distribution of emitter numbers measured at high irradiation power of 106 electrons μm−2. b Distribution of g(2)(0) for the emitters after irradiation engineering. c Second-order correlation function measurement on the emitters at 150 K. Reproduced with permission from [30]. Copyright 2021 Springer Nature. d Representative PL spectra for the strained WSe2 region before and after e-beam irradiation. e Second-order correlation function measurement on the emitters shown in (d). f Schematic showing the bandgap of the strained WSe2 before and after e-beam irradiation. Reproduced with permission from [254]. Copyright 2022 Wiley–VCH GmbH. g Band structure calculation for WSe2 monolayer with adsorbed molecules. Left: Density functional theory calculation for nitrophenyl (NPh) oligomer physisorbed on monolayer WSe2 with a Se vacancy. Right: Schematic illustrating the mechanism for the quenching effect. The black arrows represent the coupling between the NPh orbitals and defect states in WSe2. VBM represents the valence band maximum. h PL mapping images collected before and after 4-nitrobenzenediazonium (4-BND) treatment. The bottom image involves maximum PL intensity for wavelengths between 720 and 800 nm only. Reproduced with permission from [37]. Copyright 2023 Springer Nature
Fig. 11
Fig. 11
Chirality and electrical excitation of quantum emitters. a Degree of circular polarization as a function of magnetic field recorded from different quantum emitters. Reproduced with permission from [269]. Copyright 2023 Springer Nature. b Circular polarization-resolved PL spectra collected from an indentation under the excitation of σ + polarization. c Distribution of antiferromagnetic order in atomic NiPS3 structure. d Schematic illustrating the cross-section of an indentation region. e Magnetic-field image recorded from an indentation. Reproduced with permission from [272]. Copyright 2023 Springer Nature. f Schematic diagram of the graphene/WSe2/h-BN/graphene vertical heterostructure supported on the polymer substrate. An AFM tip is used to induce indentation in the vertical heterostructure. g Band diagram of the deformed heterostructure at an external bias. EF represents the Fermi level of the bottom graphene layer. EDefect represents the defect band state of WSe2. EB, ED, and EV are the bright excitonic band, dark excitonic band, and valence band state of WSe2, respectively. h PL spectra collected from the indentation region under the bias voltage of 6.0 V (top) and 2.0 V (bottom). Reproduced with permission from [273]. Copyright 2021 AAAS. i Schematic diagram for gate-dependent electroluminescence measurements. The electron density rises with the increase of gate voltage. j Electroluminescence mapping collected under the injection current of 5 nA. Reproduced with permission from [274]. Copyright 2022 American Chemical Society

Similar articles

References

    1. X.D. Duan, C. Wang, A.L. Pan, R. Yu, X.F. Duan, Two-dimensional transition metal dichalcogenides as atomically thin semiconductors: opportunities and challenges. Chem. Soc. Rev. 44, 8859–8876 (2015). 10.1039/C5CS00507H - PubMed
    1. K. Kang, S. Xie, L. Huang, Y. Han, P.Y. Huang et al., High-mobility three-atom-thick semiconducting films with wafer-scale homogeneity. Nature 520, 656–660 (2015). 10.1038/nature14417 - PubMed
    1. H. Zhang, B. Abhiraman, Q. Zhang, J. Miao, K. Jo et al., Hybrid exciton-plasmon-polaritons in van der Waals semiconductor gratings. Nat. Commun. 11, 3552 (2020). 10.1038/s41467-020-17313-2 - PMC - PubMed
    1. L.H. Zeng, S.H. Lin, Z.J. Li, Z.X. Zhang, T.F. Zhang et al., Fast, self-driven, air-stable, and broadband photodetector based on vertically aligned PtSe2/GaAs heterojunction. Adv. Funct. Mater. 28, 1705970 (2018). 10.1002/adfm.201705970
    1. X. Xu, T. Schultz, Z. Qin, N. Severin, B. Haas et al., Microstructure and elastic constants of transition metal dichalcogenide monolayers from friction and shear force microscopy. Adv. Mater. 30, 1803748 (2018). 10.1002/adma.201803748 - PubMed

LinkOut - more resources