

Noninvasive blood-brain barrier integrity mapping in patients with high-grade glioma and metastasis by multi-echo time-encoded arterial spin labeling
- PMID: 39777739
- PMCID: PMC11893035
- DOI: 10.1002/mrm.30415
Noninvasive blood-brain barrier integrity mapping in patients with high-grade glioma and metastasis by multi-echo time-encoded arterial spin labeling
Abstract
Purpose: In brain tumors, disruption of the blood-brain barrier (BBB) indicates malignancy. Clinical assessment is qualitative; quantitative evaluation is feasible using the K2 leakage parameter from dynamic susceptibility contrast MRI. However, contrast agent-based techniques are limited in patients with renal dysfunction and insensitive to subtle impairments. Assessing water transport times across the BBB (Tex) by multi-echo arterial spin labeling promises to detect BBB impairments noninvasively and potentially more sensitively. We hypothesized that reduced Tex indicates impaired BBB. Furthermore, we assumed higher sensitivity for Tex than dynamic susceptibility contrast-based K2, because arterial spin labeling uses water as a freely diffusible tracer.
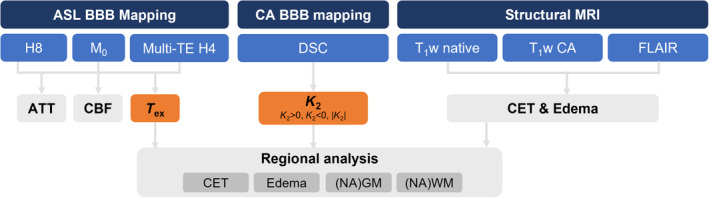
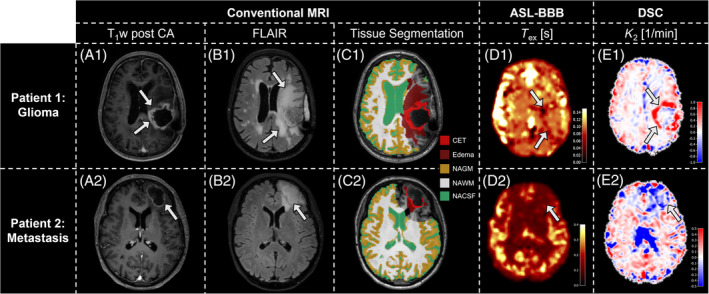
Methods: We acquired 3T MRI data from 28 patients with intraparenchymal brain tumors (World Health Organization Grade 3 & 4 gliomas [n = 17] or metastases [n = 11]) and 17 age-matched healthy controls. The protocol included multi-echo and single-echo Hadamard-encoded arterial spin labeling, dynamic susceptibility contrast, and conventional clinical imaging. Tex was calculated using a T2-dependent multi-compartment model. Areas of contrast-enhancing tissue, edema, and normal-appearing tissue were automatically segmented, and parameter values were compared across volumes of interest and between patients and healthy controls.
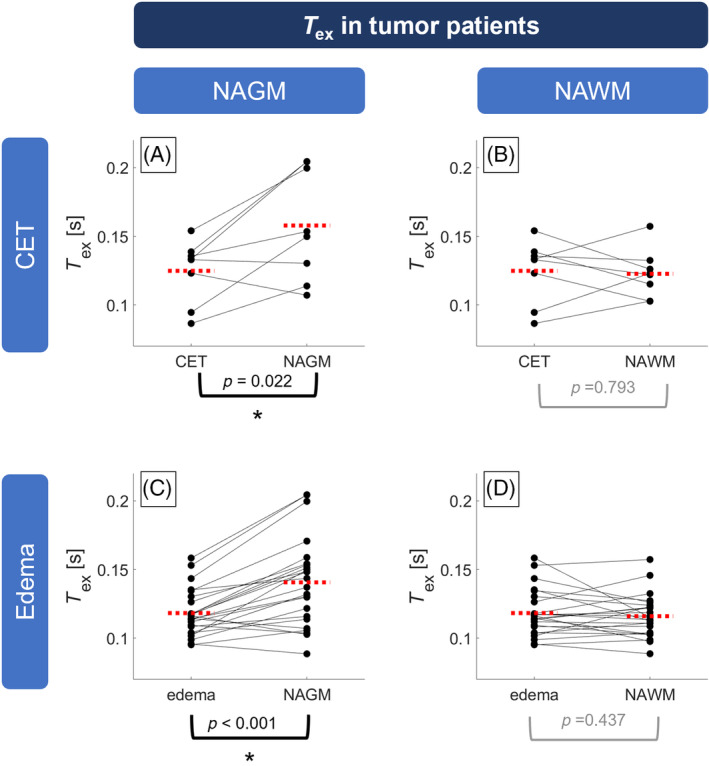
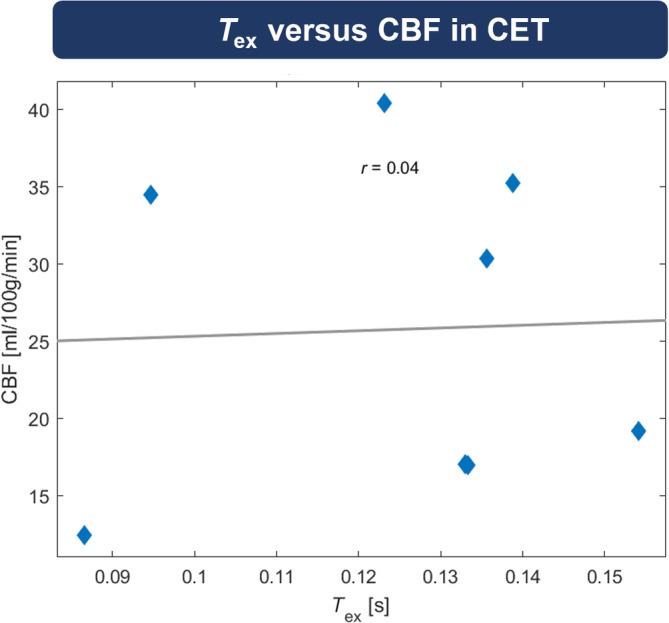
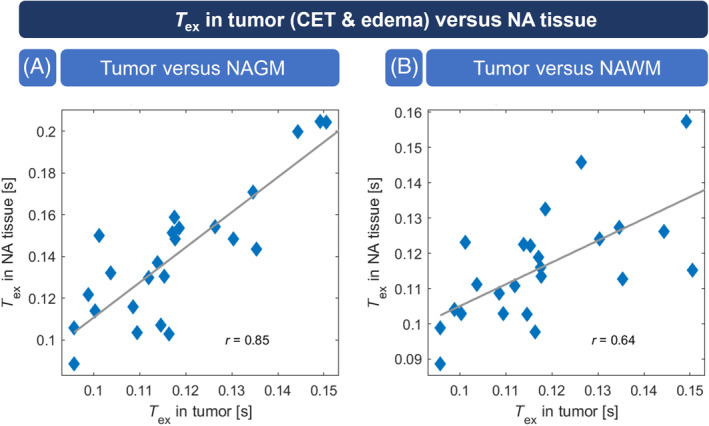
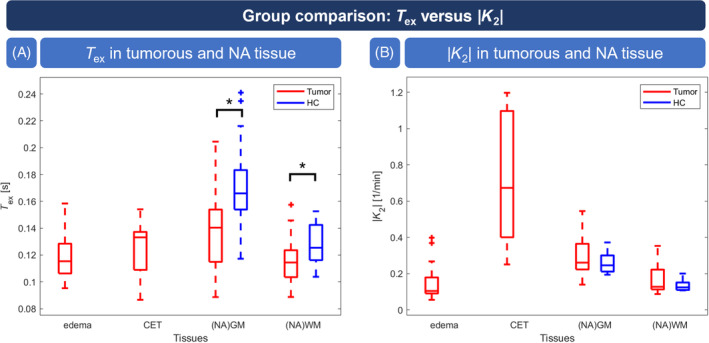
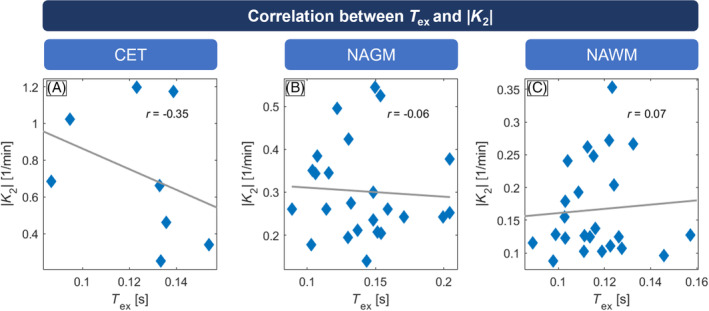
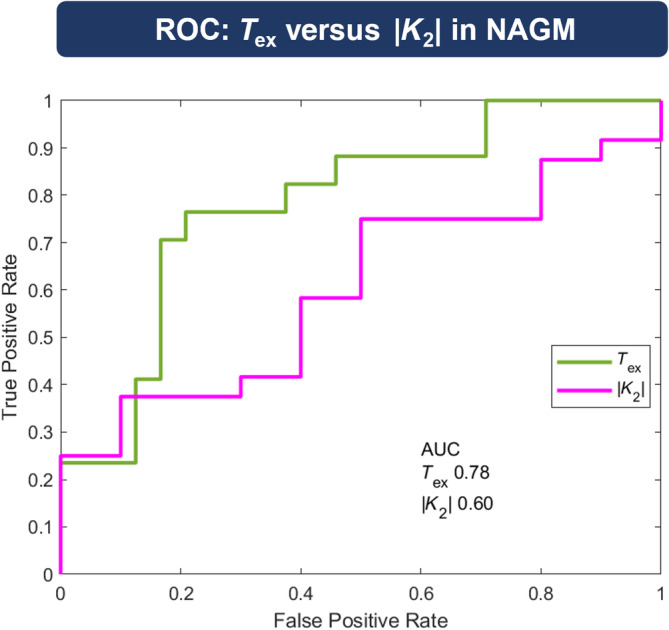
Results: Tex was significantly reduced (-20.3%) in contrast-enhancing tissue compared with normal-appearing gray matter and correlated well with |K2| (r = -0.347). Compared with healthy controls, Tex was significantly lower in tumor patients' normal-appearing gray matter (Tex,tumor = 0.141 ± 0.032 s vs. Tex,HC = 0.172 ± 0.036 s) and normal-appearing white matter (Tex,tumor = 0.116 ± 0.015 vs. Tex,HC = 0.127 ± 0.017 s), whereas |K2| did not differ significantly. Receiver operating characteristic analysis showed a larger area under the curve for Tex (0.784) than K2 (0.604).
Conclusion: Tex is sensitive to pathophysiologically impaired BBB. It agrees with contrast agent-based K2 in contrast-enhancing tissue and indicates sensitivity to subtle leakage.
Keywords: arterial spin labeling (ASL); blood–brain barrier (BBB); brain tumor; dynamic susceptibility contrast (DSC); leakage; magnetic resonance imaging (MRI).
© 2025 The Author(s). Magnetic Resonance in Medicine published by Wiley Periodicals LLC on behalf of International Society for Magnetic Resonance in Medicine.
Conflict of interest statement
Stephan Kaczmarz is an employee of Philips GmbH Market DACH. Matthias J.P. van Osch and Lena Václavů receive research support from Philips.
Figures
Similar articles
-
Assesment of perfusion in glial tumors with arterial spin labeling; comparison with dynamic susceptibility contrast method.Eur J Radiol. 2014 Oct;83(10):1914-9. doi: 10.1016/j.ejrad.2014.07.002. Epub 2014 Jul 15. Eur J Radiol. 2014. PMID: 25087109
-
Tumor recurrence versus treatment effects in glioma: A comparative study of three dimensional pseudo-continuous arterial spin labeling and dynamic susceptibility contrast imaging.Medicine (Baltimore). 2017 Dec;96(50):e9332. doi: 10.1097/MD.0000000000009332. Medicine (Baltimore). 2017. PMID: 29390403 Free PMC article.
-
The Consistence of Dynamic Contrast-Enhanced MRI and Filter-Exchange Imaging in Measuring Water Exchange Across the Blood-Brain Barrier in High-Grade Glioma.J Magn Reson Imaging. 2023 Dec;58(6):1850-1860. doi: 10.1002/jmri.28729. Epub 2023 Apr 6. J Magn Reson Imaging. 2023. PMID: 37021659
-
Differentiation Between High-Grade Glioma and Brain Metastasis Using Cerebral Perfusion-Related Parameters (Cerebral Blood Volume and Cerebral Blood Flow): A Systematic Review and Meta-Analysis of Perfusion-weighted MRI Techniques.J Magn Reson Imaging. 2025 Feb;61(2):758-768. doi: 10.1002/jmri.29473. Epub 2024 Jun 20. J Magn Reson Imaging. 2025. PMID: 38899965
-
The QIBA Profile for Dynamic Susceptibility Contrast MRI Quantitative Imaging Biomarkers for Assessing Gliomas.Radiology. 2024 Dec;313(3):e232555. doi: 10.1148/radiol.232555. Radiology. 2024. PMID: 39656118 Review.
References
-
- Abbott NJ, Ronnback L, Hansson E. Astrocyte‐endothelial interactions at the blood‐brain barrier. Nat Rev Neurosci. 2006;7:41‐53. - PubMed
-
- Dickie BR, Parker GJM, Parkes LM. Measuring water exchange across the blood‐brain barrier using MRI. Prog Nucl Magn Reson Spectrosc. 2020;116:19‐39. - PubMed
-
- Jain RK, Di Tomaso E, Duda DG, Loeffler JS, Sorensen AG, Batchelor TT. Angiogenesis in brain tumours. Nat Rev Neurosci. 2007;8:610‐622. - PubMed
-
- Wolburg H, Noell S, Fallier‐Becker P, Mack AF, Wolburg‐Buchholz K. The disturbed blood–brain barrier in human glioblastoma. Mol Aspects Med. 2012;33:579‐589. - PubMed
MeSH terms
Substances
Grants and funding
- Evangelisches Studienwerk Villigst Personal Grant to GH
- 395030489/Deutsche Forschungsgemeinschaft
- 547163214/Deutsche Forschungsgemeinschaft
- 825664/European Union's Horizon 2020 Research and Innovation Program
- Philips
- JPND2020-568-106/EU Joint Program for Neurodegenerative Disease Research
- Research Foundation - Flanders (FWO)
- Canadian Institutes of Health Research (CIHR)
- 01ED2107/BMBF
- Research Council of Norway
- Netherlands Organisation for health Research and Development
- 121N030/The Scientific and Technological Research Council of Turkey (TUBITAK)
- 10510032120006/MODEM
- WE.30-2022-04/Alzheimer Nederland
- 20212/NWO_/Dutch Research Council/Netherlands
LinkOut - more resources
Full Text Sources
Medical
