. 2025 Jan 15;39(1):e70291.
doi: 10.1096/fj.202400766R.

Signaling via retinoic acid receptors mediates decidual angiogenesis in mice and human stromal cell decidualization

Affiliations

Signaling via retinoic acid receptors mediates decidual angiogenesis in mice and human stromal cell decidualization

Qingshi Zhao et al. FASEB J. .

Abstract

At the maternal-fetal interface, tightly regulated levels of retinoic acid (RA), the physiologically active metabolite of vitamin A, are required for embryo implantation and pregnancy success. Herein, we utilize mouse models, primary human cells, and pharmacological tools to demonstrate how depletion of RA signaling via RA receptor (RAR) disrupts implantation and progression of early pregnancy. To inhibit RAR signaling during early pregnancy, BMS493, an inverse pan-RAR agonist that prevents RA-induced differentiation, was administered to pregnant mice during the peri-implantation period. Attenuation of RA/RAR signaling prior to embryo implantation results in implantation failure, whereas attenuation of RA/RAR signaling after embryo implantation disrupts the post-implantation decidual vasculature and results in pregnancy failure by mid-gestation. To inhibit RAR signaling during human endometrial stromal cell (HESC) decidualization, primary HESCs and decidualized primary HESCs were transfected with silencing RNA specific for human RARA. Inhibition of RA/RARA signaling prevents initiation of HESC decidualization, but not maintenance of the decidualized HESC phenotype. These data show that RA/RAR signaling is required for maintenance of the decidual vasculature that supports early pregnancy in mice, and distinct RAR signaling is required for initiation, but not maintenance of primary HESC decidualization in vitro.


Conflict of interest statement

The authors have declared that no conflict of interest exists.

Figures

FIGURE 1
FIGURE 1
Expression of RA pathway components in early mouse pregnancy. Gene expression determined by RT‐qPCR normalized to levels of 18 s. The average transcript level at embryonic day (E) 0.5 uteri was set to 1. (A) Schematic of the retinoid metabolism pathway. (B) Relative mRNA expression of Prl8a2 in E0.5 uteri and deciduae at E5.5 and E7.5. (C) Relative mRNA expression of RA pathway genes in E0.5 uteri and deciduae at E5.5 and E7.5. RNA was extracted from 4 to 8 unique biological samples, each represented by a symbol. Asterisks denote statistical significance, which was determined by Kruskal–Wallis tests with post hoc multiple comparisons tests. Data are presented as median + IQR. *p < .05, **p < 0.01.
FIGURE 2
FIGURE 2
Spatial transcriptomics analysis of RA pathway components in the E7.5 decidual site. (A) Spatial map of the gastrulation stage conceptus (C) and four uterine microenvironments, the mesometrial decidua (MD), vascular sinus zone (VSZ), fetal‐maternal interface (FMI) in the decidual site. Bubbles in the same uterine microenvironment are labeled with one color. (B) mRNA expression of genes involved in decidualization in the MD, VSZ, FMI, C, and DZ. (C) mRNA expression of RA pathway components within MD, VSZ, FMI, C, and DZ. The color of the bubble is associated with the level of gene expression. The size of the bubble indicates the percent of cells expressing the gene.
FIGURE 3
FIGURE 3
Systemic administration of BMS493 disrupts pregnancy. (A–C) Experimental design for administration of BMS493 via oral gavage. Black arrows indicate days of BMS493 administration, black arrowheads indicate day of embryo implantation, and red arrows indicate day of euthanasia. (D) Number of implantation sites at E7.5 after DMSO (control, n = 4 dams) or increasing concentrations of BMS493 (15 μg/g, 30 μg/g, 60 μg/g body weight with n = 3 dams per concentration) was administered from E2.5 to E6.5. (E) Number of implantation sites at E7.5 after DMSO (n = 6 dams) or increasing concentrations of BMS493 (n = 3–7 dams) was administered from E4.5 to E6.5. (F) Number of implantation sites at E9.5 after DMSO (n = 4 dams) or 60 μg/g BMS493 (n = 4 dams) was administered from E4.5 to E6.5. (G) Uterine horns at E9.5 after treatment with DMSO or 60 μg/g BMS493 from E4.5 to E6.5. (H) Representative images of decidual sites at E7.5 after treatment with DMSO or 60 μg/g BMS493. (I) Representative images of H&E‐stained sections of implantation sites from DMSO‐treated (i) and 60 μg/g BMS493‐treated dams with (ii) and without (iii) an embryo. (J) Quantification of embryo size in two implantation sites per dam for DMSO (n = 4) and 60 μg/g BMS493 (n = 4) treated dams. Each dam is represented by a unique shape. (K) mRNA expression of Cyp26a1, Cyp26b1 and Rarb in the liver samples at E7.5 after treatment with DMSO or 60 μg/g body weight BMS493 from E2.5 to E6.5. (L) mRNA expression of Cyp26a1, Cyp26b1 and Rarb in decidual sites at E7.5 after treatment with DMSO or 60 μg/g body weight BMS493 from E4.5 to E6.5. Gene expression was determined by RT‐qPCR normalized to levels of 18 s. The average transcript level after BMS493 treatment was set to 1. Data are presented as median + IQR. Statistical difference was determined by Mann–Whitney U test with *p < .05. AM, anti‐mesometrial; CTL, control; e, embryo; ns, not significant.
FIGURE 4
FIGURE 4
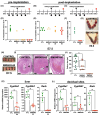
BMS493 mediated disruption of RAR signaling alters angiogenic gene expression and decidual vasculature. (A) E7.5 spatial transcriptomics analysis of angiogenic genes in the gastrulation stage conceptus and uterine microenvironments, the mesometrial decidua (MD), vascular sinus zone (VSZ), fetal‐maternal interface (FMI) and decidualization zone (DZ). The color of the bubble is associated with the level of gene expression. The size of the bubble indicates the percent of cells expressing the gene. (B) mRNA expression of Angpt2, Tek, Dll4, Notch4, Vegfa, and Vegfr2 in E7.5 decidual sites after treatment with DMSO or 60 μg/g BMS493 from E4.5 to E6.5. Gene expression was determined by RT‐qPCR normalized to levels of 18 s. The average transcript level after DMSO treatment was set to 1. (C–H) Expression of CD34 in E7.5 implantation sites was analyzed by immunohistochemistry. (C) Representative images after DMSO (n = 4 dams) or 60 μg/g BMS493 (n = 4 dams) was administered from E4.5 to E6.5. (D) Schematic to illustrate how the decidua and decidual vessels were analyzed. The total area of the decidua (highlighted yellow) was calculated as the total area of the decidual site minus the area of the implantation chamber. The anti‐mesometrial region (highlighted blue) excludes the implantation chamber and vascular sinus folds. The area of decidua (E), %CD34+ endothelial cells in the decidua (F), relative area of the anti‐mesometrial region (G) and %CD34+ endothelial cells in the anti‐mesometrial region were determined in two implantation sites per dam. Each dam is represented by a unique shape. Data in B and E–H are presented as median + IQR. Asterisks denote statistical significance, which was determined by Mann Whitney U test. *p < .05, ***p < .001. AM, anti‐mesometrial; AMR, anti‐mesometrial region; CTL, control; e, embryo; ic, implantation chamber; ns, not significant.
FIGURE 5
FIGURE 5
Expression of RA pathway components in human endometrium and primary HESCs. Representative H&E images of proliferative (A) and mid‐secretory (B) phase human endometrium. (C) mRNA expression of RA pathway genes in the human endometrium during the proliferative and mid‐secretory phases (n = 4 subjects in each phase). pHESCs were isolated from the proliferative phase of four subjects denoted as PR1, PR2, PR3, PR4, and maintained in basal media. (D) Representative image of pHESCs on day 0 (D0). pHESCs were exposed to differentiation media containing estradiol (E2), progesterone (P4), and cAMP (EPC) for 6 days. (E) Representative image of dpHESCs on day 6 (D6) after exposure to EPC differentiation media. mRNA expression of IGFBP1 (F) and PRL (G) in day 0 pHESCs and day 6 dpHESCs. (H) mRNA expression of RA pathway genes in day 0 pHESCs and day 6 dpHESCs. Gene expression was determined by RT‐qPCR normalized to levels of 18 s. The average transcript level in proliferative phase endometrium and day 0 pHESCs was set to 1. Data are presented as median + IQR. Statistical difference was determined by Mann Whitney U test. *p < .05, **p < .01, ****p < .0001. Scale bars A and B = 50 μm. Scale bars D and E = 200 μm. dpHESCs, decidualized primary HESCs; MS, mid‐secretory; ns, not significant; pHESCs, primary HESCs; PROL, proliferative; spA, spiral artery.
FIGURE 6
FIGURE 6
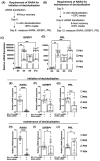
RARA knockdown inhibits initiation but not maintenance of decidualization in primary HESCs. (A) Experimental design to assess initiation of decidualization in pHESCs transfected with RARA siRNA. (B) Experimental design to assess maintenance of decidualization in dpHESCs transfected with RARA siRNA. mRNA levels of IGFBP1 (C) and PRL (D) measured on day 0 (D0) pHESCs isolated from the proliferative phase of four subjects denoted as PR1, PR2, PR3, PR4), day 6 (D6) dpHESCs, day 9 (D9) (3 days after dpHESCs were transfected with non‐target siRNA), and day 12 (D12) (6 days after dpHESCs were transfected with non‐target siRNA. RARA (E), IGFBP1 (F), and PRL (G) mRNA levels in pHESCs transfected with non‐target or RARA siRNA and then exposed to EPC differentiation media for 6 days. RARA (H), IGFBP1 (I), and PRL (J) mRNA levels in dpHESCs transfected with non‐target or RARA siRNA and then exposed to EPC differentiation media for an additional 6 days. Gene expression was analyzed via RT‐qPCR normalized to levels of 18 s. Data are presented as median + IQR. Statistical difference was determined by Mann–Whitney U tests or Kruskal–Wallis tests with post hoc multiple comparisons tests. **p < .01, ***p < .001, ****p < .0001. dpHESCs, decidualized primary HESCs; pHESCs, primary HESCs; ns, not significant.
FIGURE 7
FIGURE 7
RARA knockdown in primary HESCs does not alter VEGFA and ANGPT2 levels. VEGFA (A) and ANGPT2 (B) mRNA expression in proliferative and mid‐secretory phase human endometrium (n = 4 subjects in each phase). VEGFA (C) and ANGPT2 (D) in day 0 (D0) pHESCs isolated from the proliferative phase of four subjects denoted as PR1, PR2, PR3, PR4 and day 6 (D6) dpHESCs. VEGFA (E), and ANGPT2 (F) mRNA levels in pHESCs transfected with non‐target or RARA siRNA and then exposed to EPC differentiation media for 6 days. Gene expression was determined by RT‐qPCR normalized to levels of 18 s. Data are presented as median + IQR. Statistical difference was determined by Mann–Whitney U test. *p < .05, **p < .01. dpHESCs, decidualized primary HESCs; pHESCs, primary HESCs; MS, mid‐secretory; PROL, proliferative.

References

    1. Massri N, Loia R, Sones L, Arora R, Douglas NC. Vascular changes in the cycling and early pregnant uterus. JCI Insight. 2023;8(11):e163422. - PMC - PubMed
    1. Wang H, Dey SK. Roadmap to embryo implantation: clues from mouse models. Nat Rev Genet. 2006;7(3):185‐199. - PubMed
    1. Mori M, Bogdan A, Balassa T, Csabai T, Szekeres‐Bartho J. The decidua‐the maternal bed embracing the embryo‐maintains the pregnancy. Semin Immunopathol. 2016;38(6):635‐649. - PMC - PubMed
    1. Wang X, Wu SP, DeMayo FJ. Hormone dependent uterine epithelial‐stromal communication for pregnancy support. Placenta. 2017;60(suppl. 1):S20‐S26. - PMC - PubMed
    1. Muter J, Kong CS, Brosens JJ. The role of decidual subpopulations in implantation, menstruation and miscarriage. Front Reprod Health. 2021;3:804921. - PMC - PubMed

LinkOut - more resources