. 2025 Jan;31(1):e70210.
doi: 10.1111/cns.70210.

Rnf40 Exacerbates Hypertension-Induced Cerebrovascular Endothelial Barrier Dysfunction by Ubiquitination and Degradation of Parkin

Affiliations

Rnf40 Exacerbates Hypertension-Induced Cerebrovascular Endothelial Barrier Dysfunction by Ubiquitination and Degradation of Parkin

Chengkun Kou et al. CNS Neurosci Ther. 2025 Jan.

Abstract

Aims: We aimed to investigate the role of Rnf40 in hypertension-induced cerebrovascular endothelial barrier dysfunction and cognitive impairment.

Methods: We employed microarray data analysis and integrated bioinformatics databases to identify a novel E3 ligase, Rnf40, that targets Parkin. To understand the role of RNF40 in hypertension-induced cerebrovascular endothelial cell damage, we used pAAV-hFLT1-MCS-EGFP-3×Flag-mir30shRnf40 to establish an Rnf40-deficient model in spontaneously hypertensive rats (SHRs). We also evaluated the cerebrovascular endothelial barrier function, cerebral blood flow, and cognitive performance.

Results: We observed reduced mitophagy in cerebrovascular endothelial cells of SHRs compared with that in Wistar-Kyoto rats. Rnf40 facilitated K48-linked polyubiquitination and degradation of Parkin, thereby inhibiting mitophagy. In the Rnf40-deficient SHR model, knocking down Rnf40 restored mitophagy in cerebrovascular endothelial cells. Additionally, levels of tight junction proteins and cerebrovascular endothelial barrier function improved following Rnf40 downregulation. Rnf40 depletion also improved global cognitive performance and restored cerebral blood flow in SHRs.

Conclusion: Our findings suggest that increased Rnf40 levels exacerbate hypertension-induced cerebrovascular endothelial barrier dysfunction by ubiquitinating Parkin.

Keywords: Rnf40; cerebrovascular endothelial barrier; cognition; endothelial cell; hypertension; mitophagy.


Conflict of interest statement

The authors declare no conflicts of interest.

Figures

FIGURE 1
FIGURE 1
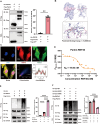
Deficiency in cerebrovascular endothelial barrier and mitophagy in SHRs, accompanied by Rnf40 overexpression. (A) Protein levels of tight junction proteins detected using Western blotting (n = 6). (B) Relative permeability index of the blood–brain barrier assessed using the FITC–dextran permeability assay. Statistical significance was determined using Student's t‐test (mean ± SD, n = 6). (C) Protein levels of mitophagy markers detected via Western blotting (mean ± SD, n = 6). (D) Escape latency and activity heatmap in the Morris Water Maze. Statistical analysis using Student's t‐test (mean ± SD, n = 8). (E) Differential gene expression between WKY rats and SHRs, with the Venn diagram identifying Rnf40 as a potentially overexpressed E3 ligase of Parkin in SHRs. (F) Mass spectrometry results depicting proteins interacting with Rnf40. (G) Relative Rnf40 mRNA expression in cerebrovascular endothelial cells of SHRs compared with that in WKYs via qRT‐PCR (mean ± SD, n = 6). (H) Representative immunoblot showing decreased tight junction protein levels in cerebrovascular endothelial cells of SHRs compared with that in WKYs (mean ± SD, n = 6). (I) Representative images from immunohistochemistry showing Rnf40 expression, with quantification of positive area percentage. Scale bar = 40 μm. Statistical analysis using Student's t‐test (mean ± SD, n = 6). SHRs, spontaneously hypertensive rats; WKY rats, Wistar‐Kyoto rats. **: p < 0.01; ***: p < 0.001; ****: p < 0.0001.
FIGURE 2
FIGURE 2
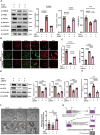
Rnf40 interacts with and ubiquitinates Parkin. (A) Detection of His‐Rnf40 protein in an anti‐Flag immunoprecipitate from HEK293T cells overexpressing Flag‐Parkin and His‐Rnf40 using Western blotting (mean ± SD, n = 6). (B) Structural overview and detailed 3D protein–ligand interaction analysis of Parkin and Rnf40. A salt bridge and over 10 hydrogen bonds exist between the two proteins. (C) Co‐localization analysis for Rnf40 and Parkin. The Pearson correlation coefficient was calculated. Scale bar = 40 μm. (D) Microscale thermophoresis assay depicting the binding of fluorescently labeled Parkin to Rnf40. Rnf40 titration from 0.15 nM to 5 μM yielded a KD of 19.5 nM. (E) HEK293T cells co‐transfected with Flag‐Parkin, HA‐Ub, and His‐Rnf40, followed by MG‐132 treatment (20 μM, 4 h). Flag‐Parkin was immunoprecipitated with an anti‐Flag antibody, and Parkin ubiquitination was detected with an anti‐HA antibody using Western blotting (mean ± SD, n = 6). (F) HEK‐293T cells transiently transfected with Flag‐Parkin, His‐Rnf40, and HA‐tagged wild‐type or mutant ubiquitin, then treated with MG‐132 (20 μM, 4 h). Flag‐Parkin immunoprecipitation using an anti‐Flag antibody reveals Parkin ubiquitination with an anti‐HA antibody using Western blotting (mean ± SD, n = 6). **: p < 0.01; ****: p < 0.0001.
FIGURE 3
FIGURE 3
Rnf40 degrades Parkin and diminishes mitophagy. (A) Protein levels of Rnf40 and Parkin following Ang II treatment (100 nM) for 24 h in cerebrovascular tissue detected via Western blotting (mean ± SD, n = 6). (B) Western blot detection of Rnf40 and Parkin protein levels following Rnf40 knockdown (mean ± SD, n = 6). (C) Analysis of Parkin degradation in hCMEC/D3 cells co‐transfected with varying His‐Rnf40 amounts (mean ± SD, n = 6). (D and E) Determination of Parkin protein half‐life via Western blotting after treating hCMEC/D3 cells with cycloheximide (CHX, 100 mg/mL) (mean ± SD, n = 6). (D) Representative Western blot image. (E) Quantitative analysis of Parkin protein levels. (F) Representative image of mitophagy ratio in endothelial cells measured using Mt‐Keima staining. Scale bar = 50 μm. Mt‐Keima in free mitochondria has its excitation maxima near 458 nm at pH = 8, and mito‐lysosomes have an excitation maxima near 561 nm at pH = 4. The histogram depicts the ratiometric fluorescence for endothelial cells to describe the mitophagy ratio. One‐way ANOVA followed by the Tukey multiple comparison test was used to compare the difference between groups (mean ± SD, n = 6). Ang II, angiotensin II. **: p < 0.01; ***: p < 0.001; ****: p < 0.0001.
FIGURE 4
FIGURE 4
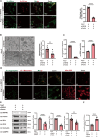
Rnf40 reduces mitophagy and increases endothelial cell permeability. (A) Protein levels of mitophagy markers following Ang II treatment (100 nM) for 24 h and Rnf40 knockdown in endothelial cells detected via Western blotting (mean ± SD, n = 6). (B and C) JC‐1 and mito‐SOX analysis in endothelial cells. (B) Representative images of JC‐1 and Mito‐SOX fluorescence microscopy. JC‐1 was used to access the mitochondrial membrane potential, and Mito‐SOX was used to quantify the mitochondrial superoxide levels. (C) Quantitative analysis of JC‐1 aggregate/monomer ratios and Mito‐SOX fluorescence intensities (mean ± SD, n = 6). (D) Protein levels of tight junction proteins detected using Western blotting after AngII treatment (100 nM) for 24 h and Rnf40 knockdown (mean ± SD, n = 6). (E) FITC–dextran permeability assay results depicting endothelial permeability. One‐way ANOVA followed by the Tukey multiple comparison test was used to compare the difference between groups (mean ± SD, n = 6). (F) Representative images of the endothelial cell mitochondrial structure using TEM with quantification of mitophagosomes (mean ± SD, n = 6). (G) The flow diagram of in vitro endothelial permeability assays. Ang II, angiotensin II; mito‐SOX, mitochondrial superoxide; FITC, fluorescein isothiocyanate; TEM: transmission electron microscopy. *: p < 0.05; **: p < 0.01; ***: p < 0.001; ****: p < 0.0001.
FIGURE 5
FIGURE 5
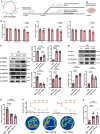
Rnf40 inhibits Parkin‐dependent mitophagy, increasing endothelial permeability. (A) Mitophagy ratio in endothelial cells assessed using Mt‐Keima staining after Parkin knockdown. Scale bar = 50 μm. The histogram depicts the ratiometric fluorescence for endothelial cells to describe the mitophagy ratio. Statistical significance was assessed using Student's t‐test (mean ± SD, n = 6). (B) Representative TEM images of the endothelial cell mitochondrial structure with quantification of mitophagosomes (mean ± SD, n = 6). (C and D) JC‐1 aggregate/monomer ratios and Mito‐SOX fluorescence analysis (mean ± SD, n = 6). (E) Protein levels of tight junction proteins following Parkin knockdown detected using Western blotting (mean ± SD, n = 6). (F) FITC–dextran permeability assay results depicting endothelial permeability after Parkin knockdown. One‐way ANOVA followed by the Tukey multiple comparison test was used to compare the difference between groups (mean ± SD, n = 6). Ang II, angiotensin II; mito‐SOX, mitochondrial superoxide; FITC, fluorescein isothiocyanate; TEM: transmission electron microscopy. **: p < 0.01; ****: p < 0.0001.
FIGURE 6
FIGURE 6
Silencing Rnf40 modulates Parkin‐dependent mitophagy and preserves cognitive function in SHRs. (A) AAV vector structure and experimental flow diagram (Created in BioRender. Kou, C. (2024) BioRender.com/c52o084). (B) The blood pressure after treatment for SHRs (mean ± SD, n = 8). (C) Western blot analysis of Rnf40 and mitophagy protein levels following Rnf40 knockdown (mean ± SD, n = 6). (D) Tight junction protein levels detected using Western blotting (mean ± SD, n = 6). (E) BBB permeability was assessed using the FITC–dextran assay. One‐way ANOVA with Tukey's test was used to compare the difference between groups (mean ± SD, n = 6). (F) Escape latency and heatmap analysis in the MWM. Statistical significance was assessed using Student's t‐test (mean ± SD, n = 8). (G) Time spent in the quadrant area of the MWM probe trial. One‐way ANOVA followed by the Tukey multiple comparison test was used to compare the difference between groups (mean ± SD, n = 8). BBB, blood brain barrier; MWM, morris water maze; SHRs, spontaneously hypertensive rats. **: p < 0.01; ***: p < 0.001; ****: p < 0.0001.

Similar articles

References

    1. Al‐Makki A., DiPette D., Whelton P. K., et al., “Hypertension Pharmacological Treatment in Adults: A World Health Organization Guideline Executive Summary,” Hypertension 79 (2022): 293–301. - PMC - PubMed
    1. Mogi M., Ikegawa Y., Haga S., Hoshide S., and Kario K., “Hypertension Facilitates Age‐Related Diseases. ~ Is Hypertension Associated With a Wide Variety of Diseases?,” Hypertension Research 47 (2024): 1246–1259. - PubMed
    1. Santisteban M. M. and Iadecola C., “Hypertension, Dietary Salt and Cognitive Impairment,” Journal of Cerebral Blood Flow and Metabolism 38 (2018): 2112–2128. - PMC - PubMed
    1. Nakamura Y., Kabayama M., Godai K., et al., “Longitudinal Association of Hypertension and Dyslipidemia With Cognitive Function in Community‐Dwelling Older Adults: The SONIC Study,” Hypertension Research 46 (2023): 1829–1839. - PMC - PubMed
    1. Baggeroer C. E., Cambronero F. E., Savan N. A., Jefferson A. L., and Santisteban M. M., “Basic Mechanisms of Brain Injury and Cognitive Decline in Hypertension,” Hypertension 81 (2024): 34–44. - PMC - PubMed