. 2025 Apr;292(8):1887-1903.
doi: 10.1111/febs.17387. Epub 2025 Jan 8.

Identification of an exosite at the neutrophil elastase/alpha-1-antitrypsin interface

Affiliations

Identification of an exosite at the neutrophil elastase/alpha-1-antitrypsin interface

Roberto Gangemi et al. FEBS J. 2025 Apr.

Abstract

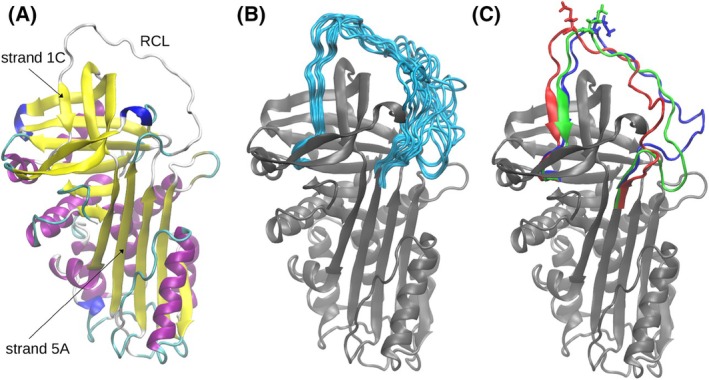
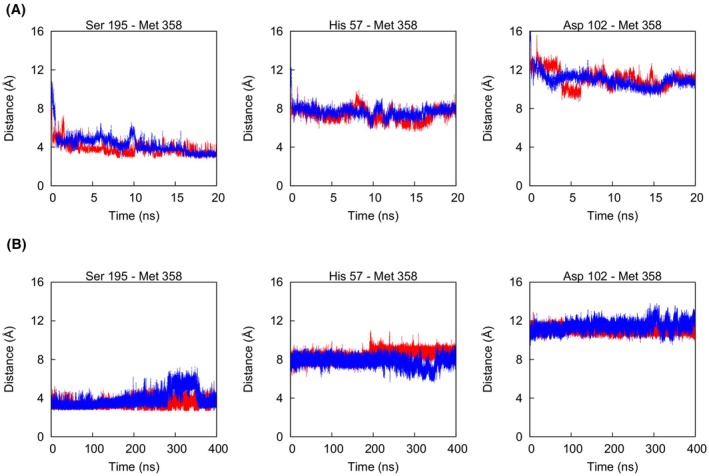
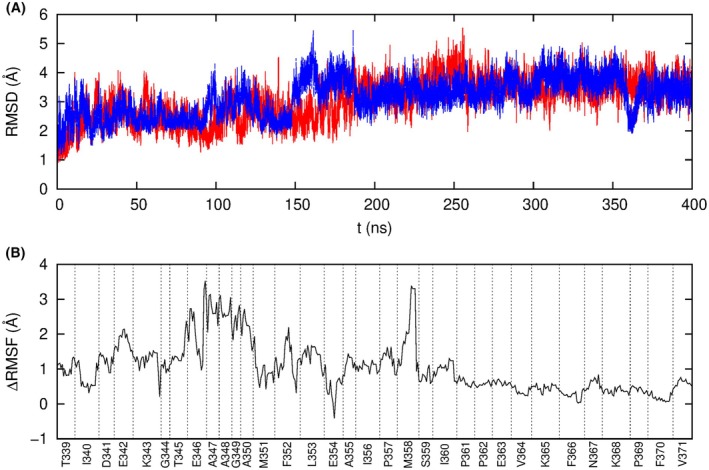
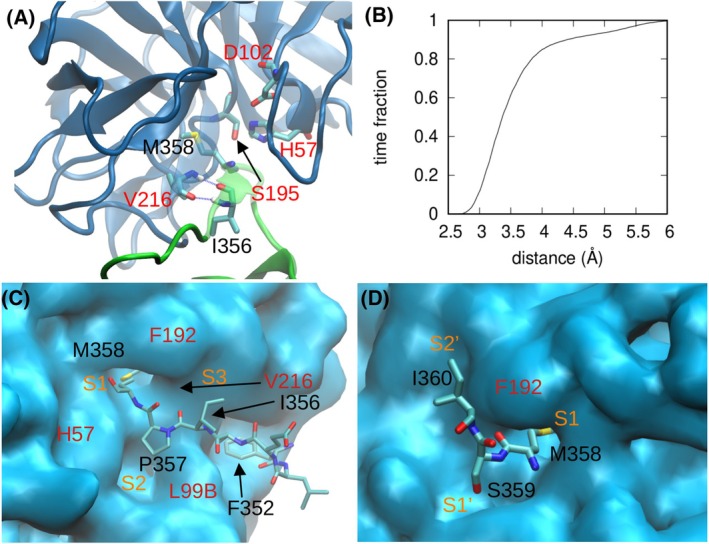
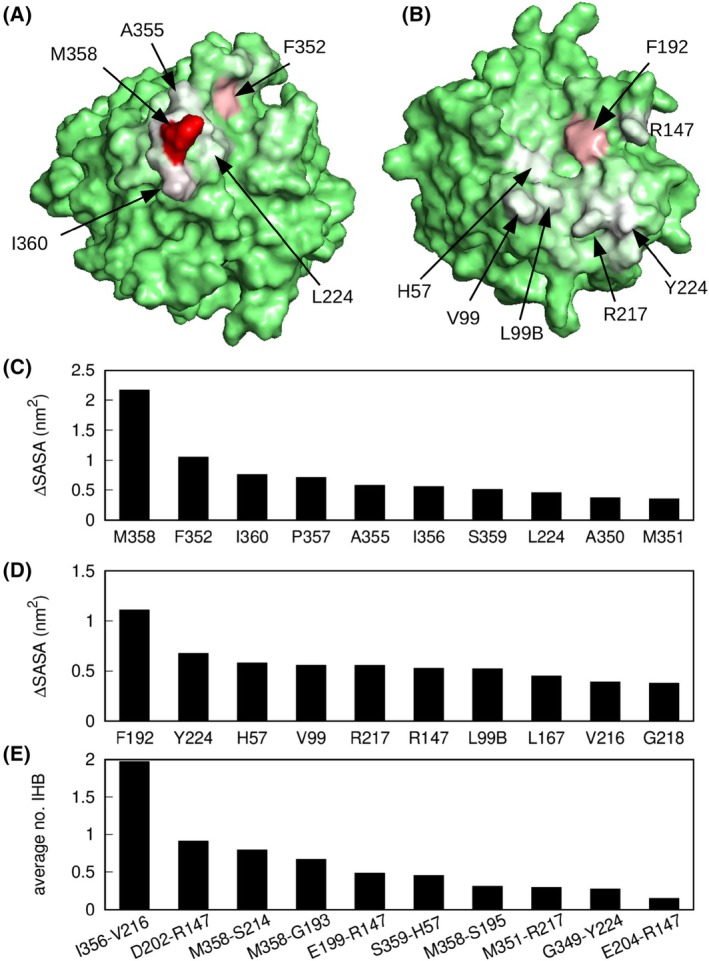
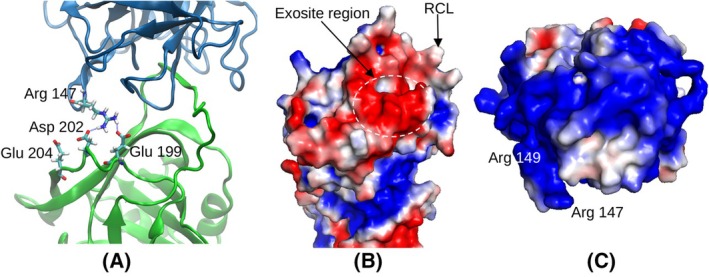
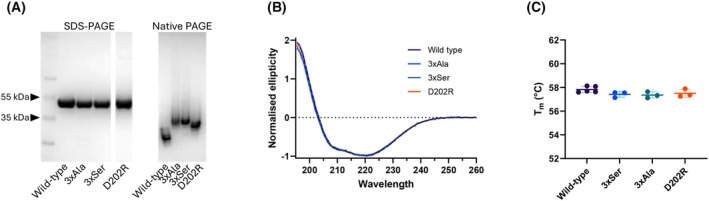
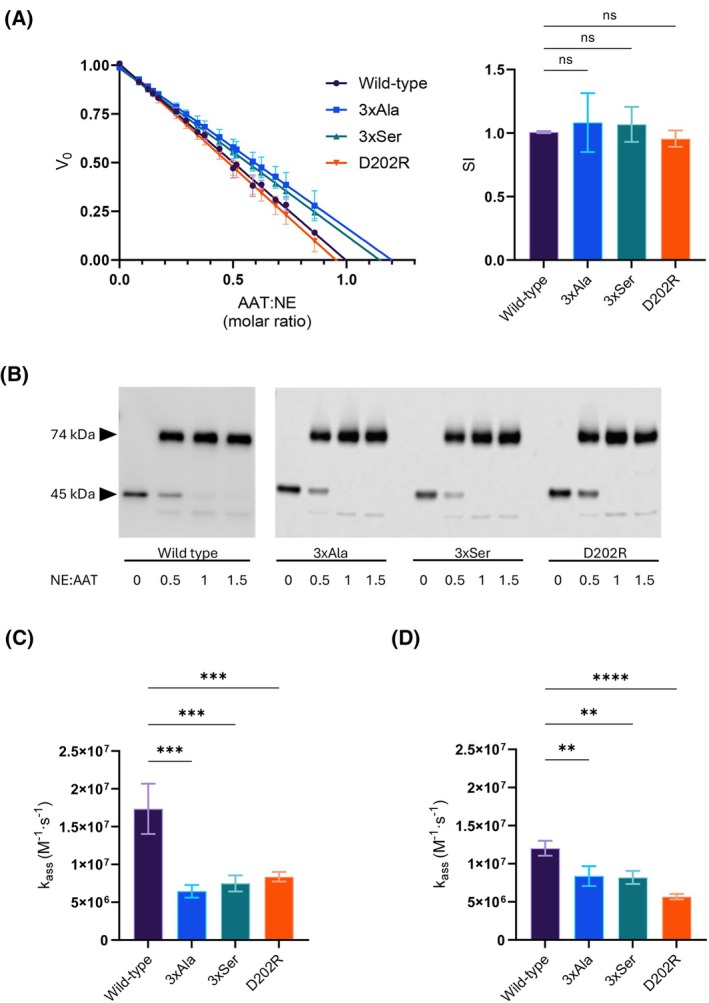
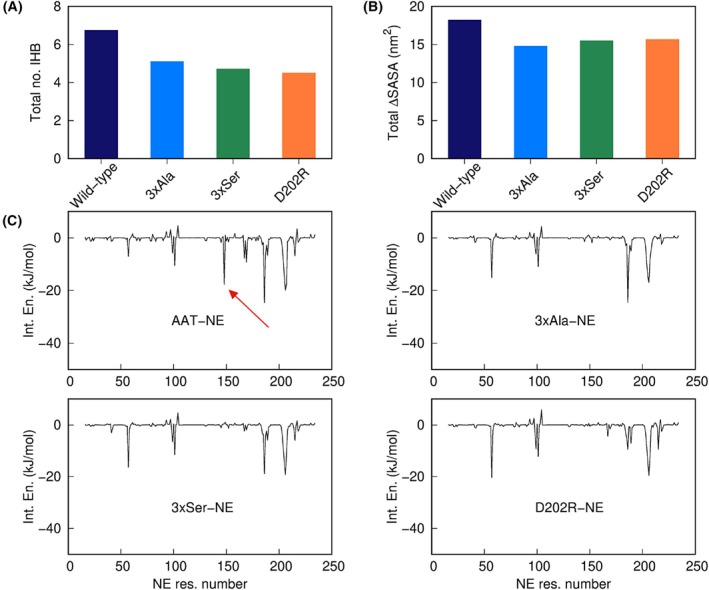
Neutrophil elastase (NE) is released by activated neutrophils during an inflammatory response and exerts proteolytic activity on elastin and other extracellular matrix components. This protease is rapidly inhibited by the plasma serine protease inhibitor alpha-1-antitrypsin (AAT), and the importance of this protective activity on lung tissue is highlighted by the development of early onset emphysema in individuals with AAT deficiency. As a serpin, AAT presents a surface-exposed reactive centre loop (RCL) whose sequence mirrors the target protease specificity. Following binding of NE in a 'Michaelis' encounter complex, cleavage of the RCL results in an irreversible complex between the two molecules. Here, the structure of the AAT-NE encounter complex was studied by molecular dynamics, mutagenesis and enzyme kinetics. Exploration of the geometry of interaction between the two molecules revealed the possibility that the interaction interface extends beyond the RCL; a persistent feature of the simulations was the interaction between a region located upstream of β-strand 4C of AAT, comprising three acidic residues (Asp202, Glu199 and Glu204), and Arg147 of NE. Mutation of the acidic residues to either alanine or serine, or a D202R substitution, resulted in a reduced rate of association between recombinant AAT and NE. Addition of salt to the buffer had little effect for these mutants but substantially reduced the rate of interaction of the wild-type protein. These data are consistent with a role for this acidic region on AAT as an exosite that contributes to an optimal interaction with its physiological protease target.

Keywords: SERPINA1; Serpins; alpha‐1‐antitrypsin deficiency; computational biology; molecular dynamics simulations; protease inhibition; protein–protein interactions.


Conflict of interest statement

The authors declare no conflict of interest.

Figures

Fig. 1
Fig. 1
Dynamics of the RCL. (A) AAT structure from PDB 1QLP. Colours refer to secondary structure: yellow for β‐sheet, purple for α‐helix, blue for 3–10 helix, cyan for turn, white for coil. (B) Twenty representative RCL conformations obtained by use of the k‐means algorithm superimposed onto the 1QLP structure of AAT (grey). (C) The three structures derived from cluster analysis that were used for the subsequent simulations, with residue P1 (Met358) highlighted as sticks. Structural representations created by means of VMD [41].
Fig. 2
Fig. 2
Progress of the ED and standard MD simulations. (A) Time evolution of the distances of reference atoms in the catalytic triad of NE with respect to Met358 of AAT in two ED simulations (in red and blue) that produced an acceptable Michaelis complex. (B) The same as A in the two subsequent standard MD simulations. The reference atoms are Oγ for Ser195 and carbonyl C for Met358 in the left panel, and Cα for each residue in the central and right panels.
Fig. 3
Fig. 3
Analysis of standard MD simulations. (A) Time evolution of the root mean square deviation of Ca atoms with respect to the initial structure in two standard MD simulations (in red and blue). Subsequent analyses used a combination of the last 200 ns of both trajectories. (B) Analysis of the difference in atomic root mean square fluctuation (RMSF) of residues 339–371, encompassing the RCL and adjacent positions, between AAT alone and in complex with NE.
Fig. 4
Fig. 4
Structure of the AAT‐NE complex from standard MD. (A) Detail of the active site, with the main structure in cartoon representation (green for AAT, blue for NE) and relevant residues highlighted as sticks. Residue labels are in black for AAT and in red for NE. The double hydrogen bond between Ile356 and Val216 is also shown. (B) Fraction of the time in which the distance between Oγ of Ser195 on NE and the carbonyl of Met358 on AAT is lower than the value given in abscissa. (C) Position of the portion of the RCL from P1 to P7 (shown as sticks) with respect to NE (shown as surface). Label colours are as in A, and subsite labels are shown in orange. (D) The same as C for the part of RCL including P1, P1′ and P2′. Structural representations created by means of VMD [41].
Fig. 5
Fig. 5
Analysis of AAT‐NE interactions. (A) Colour representation of SASA loss of AAT residues upon binding (green: no variation; white: 1.1 nm2; red: 2.2 nm2). (B) Colour representation of SASA loss of NE residues upon binding (colours as in A). (C) Variation of SASA upon binding: the 10 largest values among AAT residues are shown. (D) Variation of SASA upon binding: 10 largest values among NE residues. (E) AAT‐NE residue pairs with the highest average number of intermolecular hydrogen bonds (IHB). Structural representations created by means of VMD [41].
Fig. 6
Fig. 6
Analysis of the putative exosite region. (A) Details of the exosite interactions, where the involved amino acids are highlighted as sticks and the main structure is in cartoon representation (green for AAT, blue for NE). (B) Surface electrostatic potential of AAT shown by colour coding (red: –2kT/e, blue: +2kT/e). (C) Surface electrostatic potential of NE (colours as in B). Structural representations created by means of VMD [41] (A) and Pymol (Schrödinger, LLC) (B and C).
Fig. 7
Fig. 7
Correlation between exosite interaction and catalytic site geometry. Distance between the carbonyl of Met358 and atom Oγ of Ser195 (red curves, left scale) and average number of hydrogen bonds between Arg147 and AAT (blue curves, right scale) as a function of the first (left panel), second (central panel) and third (right panel) principal component of the AAT‐NE complex, calculated from the two MD simulations as described in the text.
Fig. 8
Fig. 8
Amino acid substitutions within the putative exosite do not affect protein conformation. (A) Recombinant AAT variants analysed either by 4–12% w/v acrylamide SDS/PAGE in reducing conditions (left) or by 4–12% w/v acrylamide nondenaturing‐PAGE (right). Proteins were stained by 0.1% w/v Coomassie Blue. (B) Circular dichroism spectrum of wild‐type and AAT mutants recorded at 25 °C; the mean of n = 3 dilutions is shown. (C) Thermal transition midpoints (T m ) determined in differential scanning fluorimetry experiments using SYPRO Orange as a reporter and an increment of 1 °C·min−1; individual values (n = 3–5) are shown with mean ± SD.
Fig. 9
Fig. 9
Amino acid substitutions at the exosite decrease the rate of association by NE. (A) Stoichiometry of inhibition of NE by recombinant AAT mutants compared to wild‐type AAT. The rate of hydrolysis (V0) of a chromogenic substrate was determined at different AAT : NE molar ratios and fitted by linear regression. The histogram shows the SI values, defined as the number of AAT molecules required to inhibit a molecule of NE, calculated as the means of the x‐intercepts (n = 3). Error bars represent ±SD values. (B) Analysis of covalent complex formation by SDS/PAGE, at the indicated NE : AAT ratios. (C) Second‐order association rate constant (k ass), corrected for nonproductive interactions, was calculated as the product of k inh and the SI mean (see Material and Methods). The association rate was determined in PBS. (D) Second‐order association rate constant (k ass) determined as in panel C, in PBS with 0.5 m NaCl (n = 3). Data in panels A, C and D are represented as means ± SD (n = 3). Significant differences from wild‐type AAT were calculated by one‐way ANOVA analysis corrected by Dunnett's test (ns, nonsignificant; **, P ≤ 0.01; ***, P ≤ 0.001; ****, P ≤ 0.0001), using Prism 10 (graphpad software).
Fig. 10
Fig. 10
Comparison of MD results between wild‐type and mutant complexes. (A) Total number of intermolecular hydrogen bonds between AAT and NE. (B) Total loss of SASA of AAT and NE upon complex formation. (C) Contributions by NE residues to the interaction energy with AAT (a red arrow in the wild‐type case points to the peak of Arg147, interacting with the putative exosite).

Similar articles

References

    1. McRae B, Nakajima K, Travis J & Powers JC (1980) Studies on reactivity of human leukocyte elastase, cathepsin G, and porcine pancreatic elastase toward peptides including sequences related to the reactive site of alpha 1‐protease inhibitor (alpha 1‐antitrypsin). Biochemistry 19, 3973–3978. - PubMed
    1. Duranton J & Bieth JG (2003) Inhibition of proteinase 3 by [alpha]1‐antitrypsin in vitro predicts very fast inhibition in vivo. Am J Respir Cell Mol Biol 29, 57–61. - PubMed
    1. Greene CM, Marciniak SJ, Teckman J, Ferrarotti I, Brantly ML, Lomas DA, Stoller JK & McElvaney NG (2016) α1‐antitrypsin deficiency. Nat Rev Dis Primers 2, 16051. - PubMed
    1. Strnad P, McElvaney NG & Lomas DA (2020) Alpha1‐antitrypsin deficiency. N Engl J Med 382, 1443–1455. - PubMed
    1. Elliott PR, Pei XY, Dafforn TR & Lomas DA (2000) Topography of a 2.0 a structure of alpha1‐antitrypsin reveals targets for rational drug design to prevent conformational disease. Protein Sci 9, 1274–1281. - PMC - PubMed