

Identification of risk factors and development of a predictive nomogram for sarcopenia in Alzheimer's disease
- PMID: 39778036
- PMCID: PMC11848345
- DOI: 10.1002/alz.14503
Identification of risk factors and development of a predictive nomogram for sarcopenia in Alzheimer's disease
Abstract
Introduction: Sarcopenia, with its complex diagnostic process, is a likely independent predictor of poor prognosis in patients with Alzheimer's disease (AD). However, research on the clinical characteristics and biomarkers of AD patients with sarcopenia (ADSA) is limited.
Methods: This study included 180 ADSA and 188 AD patients without sarcopenia (ADNSA), and evaluated demographics, cognitive function, motor capacity, emotional state, and daily living abilities.
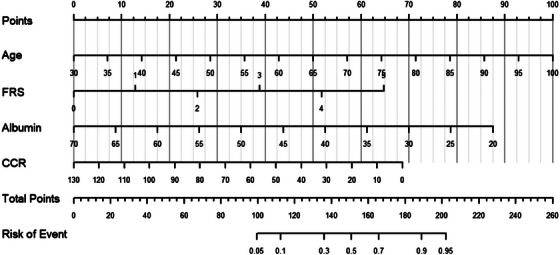
Results: ADSA patients were older, with worse motor and cognitive functions, more severe depression, poorer social functioning, and lower daily living abilities compared to ADNSA patients. Multivariate regression identified age, low Frailty Rating Scale (FRS) scores, low serum albumin level, and low creatinine/cystatin C ratio (CCR) as risk factors for sarcopenia. A nomogram model based on these indicators demonstrated high discriminative power and clinical utility.
Discussion: Sarcopenia significantly affects AD patients' various functions. The nomogram model aids in the early detection of and personalized interventions for sarcopenia in AD.
Highlights: Sarcopenia is a risk factor for Alzheimer's disease (AD), and the coexistence of sarcopenia affects various functions and quality of life in patients with AD. Serum albumin and Frailty Rating Scale (FRS) scores are significantly associated with both sarcopenia and cognitive assessment indicators in AD patients with sarcopenia (ADSA). The combined sarcopenia nomogram model with indexes of age at diagnosis, creatinine/cystatin C ratio (CCR), FRS score, and albumin levels can aid in effectively identifying and personalizing interventions for sarcopenia in the AD population.
Keywords: Alzheimer's disease; biomarkers; nomogram; prediction model; risk factors; sarcopenia.
© 2025 The Author(s). Alzheimer's & Dementia published by Wiley Periodicals LLC on behalf of Alzheimer's Association.
Conflict of interest statement
We declare that there is no actual or potential financial or other conflicts of interest related to the submitted manuscript. Author disclosures are available in the Supporting Information.
Figures


References
MeSH terms
Substances
Grants and funding
- 2023-111/the Cadre Health Project of Sichuan Province
- 2023YFQ0098/the Fund Project of Sichuan Provincial Department of Science and Technology
- 2021YFC2501200/the National Key Research and Development Program of China Program
- 2022ZDZX0023/the Sichuan Science and Technology Program
- 2022ZD0211605/the Sci-Tech Innovation 2023 "Brain Science and Brain-like Research"
LinkOut - more resources
Full Text Sources
Medical
