

Identification of quantitative trait loci and candidate genes associated with growth curve parameters in chinese wenshang barred chickens
- PMID: 39778364
- PMCID: PMC11761894
- DOI: 10.1016/j.psj.2025.104767
Identification of quantitative trait loci and candidate genes associated with growth curve parameters in chinese wenshang barred chickens
Abstract
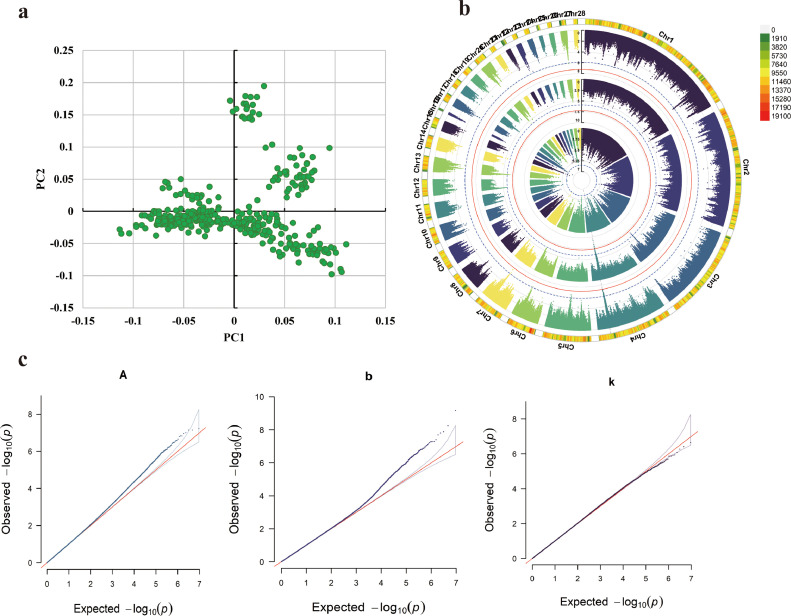
The growth curve is a vital instrument for assessing and forecasting weight and developmental shifts in livestock and poultry, which reflects the changes of bodyweight traits with time and plays a key role in guiding breeding and production approaches. This study performed a genome-wide association study (GWAS) for growth curve parameters generated by nonlinear models which fit original weight-age records, to discover the SNPs and candidate genes correlated with growth traits. Data from 362 Chinese Wenshang Barred Chickens weighed at the age of 0, 2, 4, 6, 8, 10, 12, 14, 16, and 18 weeks were used to fit the Gompertz, Logistic, and von Bertalanffy growth models. The Gompertz model showed the highest coefficient of determination (R2 = 0.974). The mature body weight (A), time scale (b), and maturity rate (k) were treated as phenotypes for single-trait GWAS. The GWAS identified 44, 103, and 5 significant single nucleotide polymorphisms (SNPs) associated with A, b, and K, respectively. Among them, several candidate genes, including LDB2, TOB2, RCBTB1, KPNA3, SLIT2, LCORL, LAP3, and TPRA1, were previously reported to be associated with growth and development. Two lead SNPs (4:76022389, 4:76070237) on the LDB2 gene were significantly associated with the growth curve. Further research of these candidate genes could help explore the full genetic architecture underlying growth and development traits in poultry.
Keywords: GWAS; Growth curve model; Longitudinal data.
Copyright © 2025. Published by Elsevier Inc.
Conflict of interest statement
Declaration of competing interest The authors declare that they have no known competing financial interests or personal relationships that could have appeared to influence the work reported in this paper.
Figures


References
-
- Ajima R., Akiyama T., Usui M., Yoneda M., Yoshida Y., Nakamura T., Minowa O., Noda M., Tanaka S., Noda T., Yamamoto T. Osteoporotic bone formation in mice lacking tob2; involvement of Tob2 in RANK ligand expression and osteoclasts differentiation. FEBS Lett. 2008;582:1313–1318. doi: 10.1016/j.febslet.2008.03.012. - DOI - PubMed
-
- Chen Y., Chen Y., Shi C., Huang Z., Zhang Y., Li S., Li Y., Ye J., Yu C., Li Z., Zhang X., Wang J., Yang H., Fang L., Chen Q. SOAPnuke: a MapReduce acceleration-supported software for integrated quality control and preprocessing of high-throughput sequencing data. Gigascience. 2018;7:1–6. doi: 10.1093/gigascience/gix120. - DOI - PMC - PubMed
MeSH terms
Substances
LinkOut - more resources
Full Text Sources
Research Materials
Miscellaneous
