. 2025 Apr;640(8059):782-792.
doi: 10.1038/s41586-024-08451-4. Epub 2025 Jan 8.

Precursors of exhausted T cells are pre-emptively formed in acute infection

Affiliations

Precursors of exhausted T cells are pre-emptively formed in acute infection

Talyn Chu et al. Nature. 2025 Apr.

Abstract

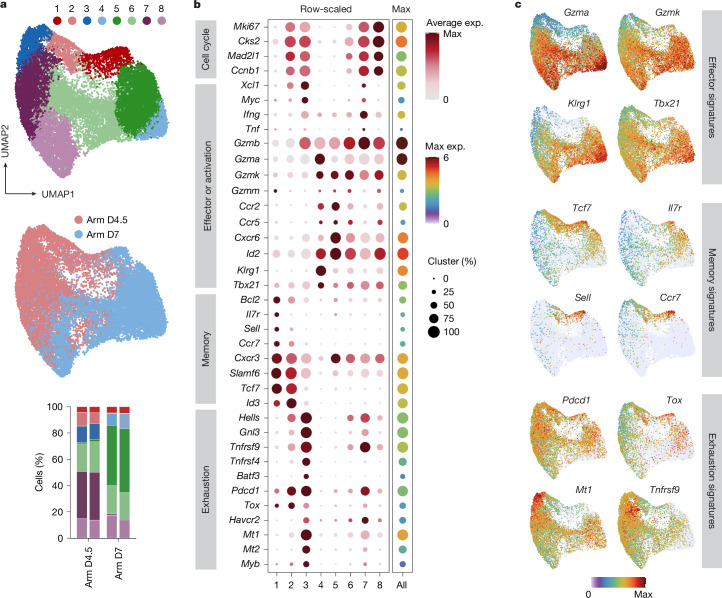
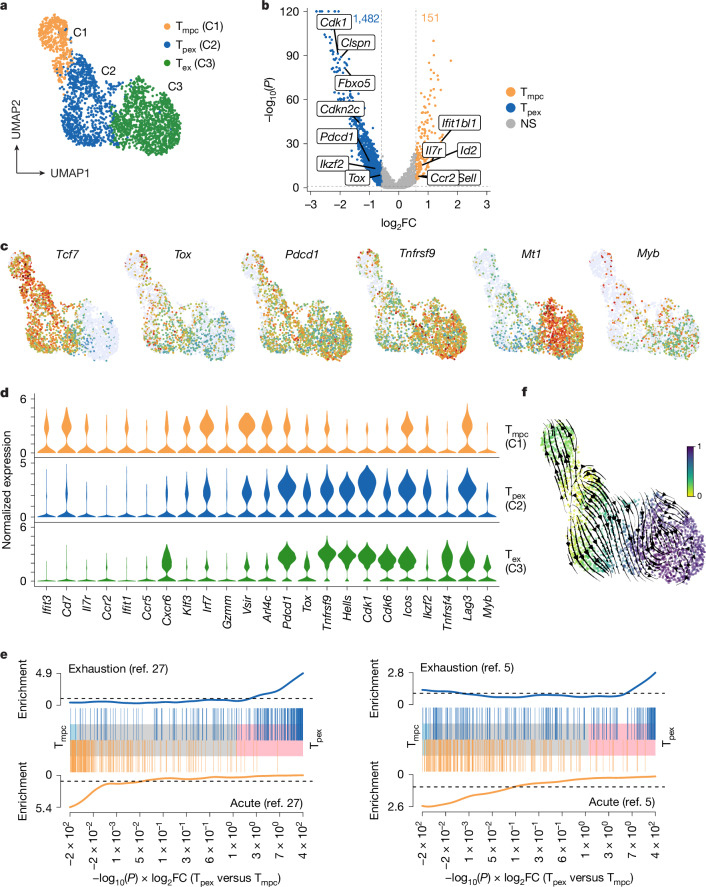
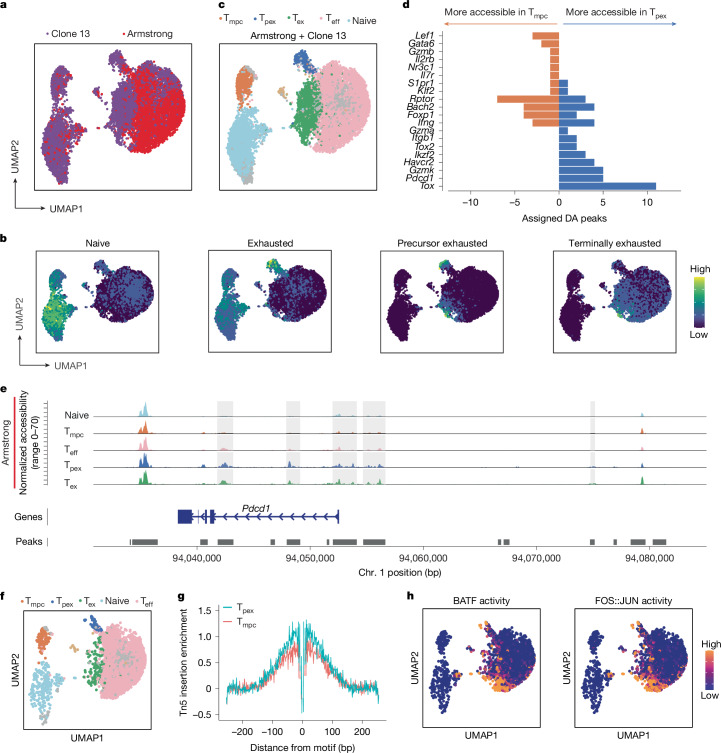
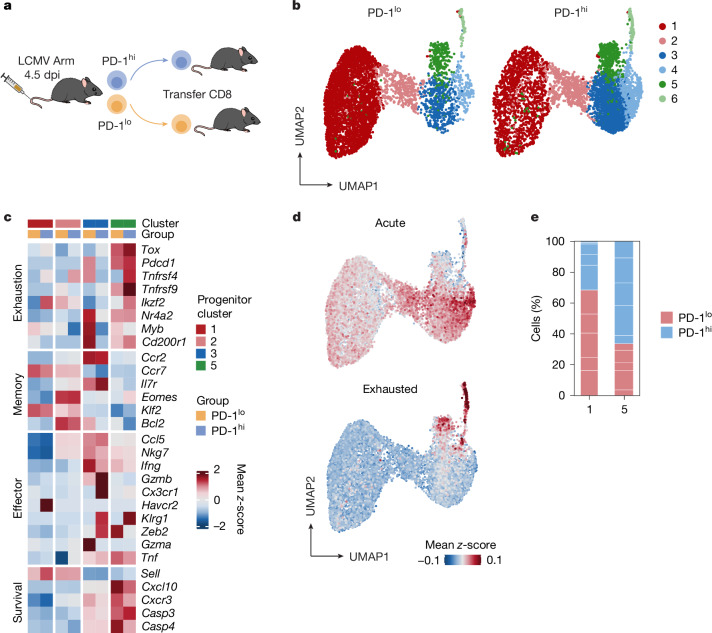
T cell exhaustion limits effector T cell function in chronic infection and tumours1,2. The development of these hypofunctional T cells and of their precursors was considered to require stimulatory conditions that are met only after persistent exposure to antigen and inflammation. Here we show, however, that similar T cell populations exist in the early phase of acute infections1,2. At that stage, the early developing TCF1+ precursor population exhibits an unexpected diversity; it includes precursors of normal memory T cells, but also cells with phenotypic, gene-expression and epigenetic profiles that resemble those of precursors of exhausted T cells found in chronic infections. We show that high ligand affinity promotes and PD-1 signalling restricts the development of these precursors. Although the exhausted precursors are at first found frequently, they decline without being completely lost in infections that the immune system resolves. We therefore conclude that precursor T cells with at least two distinct phenotypes are pre-emptively generated irrespective of the outcome of an infection.


Conflict of interest statement

Competing interests: The authors declare no competing interests.

Figures

Fig. 1
Fig. 1. Acute LCMV-specific T cell populations contain cells with transcriptional similarity to exhausted T cells.
ac, A published dataset was used in which LCMV-specific, TCR-transgenic P14 T cells were transferred into host mice that were subsequently challenged with acute LCMV Armstrong (Arm) infection. P14 cells were re-isolated on days (D) 4.5 and 7 after infection. a, Uniform manifold approximation and projection (UMAP) shows eight identified clusters (top), the distribution of the two time points projected over the Louvain clusters (middle) and an illustration of the relative size of the cluster in each sample (bar graph at the bottom). b, Signature dot plot for the clusters. Colours encode average normalized expression values within the clusters, and circle size indicates the percentage of the cluster expressing the gene of interest. c, Feature plots illustrating selected effector, memory and exhaustion markers. Colours encode normalized expression values. Data are derived from a single previously published dataset.
Fig. 2
Fig. 2. Cells similar to memory precursor T cells and to exhausted precursors exist early in acute infection.
Day-4.5 cells from Fig. 1 located in progenitor clusters 1 and 2 and Tex cluster 3 were selected, re-clustered and analysed. a, Tpex, Tmpc and Tex clusters after re-clustering. b, Volcano plot of differential gene expression between the Tmpc cluster and the Tpex cluster (as shown in a). Genes with Padj < 0.05 and log2-transformed fold change (log2FC) > log2(1.5) were considered differentially expressed. Significance was calculated with Wilcoxon rank-sum test and adjusted for multiple testing with Benjamini–Hochberg correction. c, Feature plots illustrating the representative markers. Colours encode normalized expression values. d, Violin plots showing expression levels of selected signature genes by cells assigned to the new clusters depicted in a. e, GSEA for exhausted (top) and acute (bottom) signatures from two distinct sources (left, ref. ; right, ref. ) on Tpex (cluster 2) versus Tmpc (cluster 1). The background genes were sorted by differential expression levels between these two clusters, weighted by the significance obtained with a Wilcoxon rank-sum test. f, Combined velocity and pseudotime analysis using the subclusters shown in a. Data are derived from a single previously published dataset.
Fig. 3
Fig. 3. Transcriptional changes between PD-1hi and PD-1lo precursors reveal an exhausted phenotype.
a, CD45.1 congenic, TCR-transgenic P14 (103) T cells were transferred into C57BL/6 hosts, which were then infected with LCMV Armstrong. CD44+KLRG1PD-1hi and PD-1lo populations were selected and analysed for TCF1 and TOX expression seven days after infection. b, NUR77 expression in PD-1hi and PD-1lo subsets of transferred P14 T cells on day 4.5 after infection with LCMV Armstrong. n = 4; mean ± s.e.m.; ****P < 0.0001 (ordinary one-way ANOVA with Dunnett’s multiple comparisons test). gMFI, geometric mean fluorescence intensity. c, Heat map of differentially expressed genes (Padj < 0.05 and |log2FC| > 0.58) between PD-1hi and PD-1lo P14. d, Correlation of the log2FC between PD-1hi and PD-1lo P14 with the log2FC between acute LCMV Armstrong and chronic LCMV Docile infection at day 21 after infection. Line represents a linear model regression and the bands show a confidence interval of 95%. e, Log2-normalized counts of bulk RNA-seq with paired PD-1hi and PD-1lo P14 samples from the same donor mouse. Significance values were calculated using empirical Bayes moderated t-statistics and were adjusted with Benjamini–Hochberg correction. n = 5 for all groups; lines represent mean and symbols represent individual mice. Box plots show median, first and third quartiles (hinges); lines show the smallest or largest observation within a distance from the nearest hinge of 1.5 times the size of the box. Observations outside this range are shown as outliers. f, Comparison of TNF co-production by INFγ+ cells after brief ex vivo stimulation with gp33 or np396 peptide. Spleen cells were isolated on day 4.5 after infection with LCMV Armstrong and pre-gated as KLRG1TCF1+TOX+ (TOX+) or KLRG1TCF1+TOX (TOX) T cells. n = 4; *P = 0.0417, **P = 0.0046 (two-tailed paired t-tests). Data are representative of three (a) or two (b,f) independent experiments or derived from a single experiment (ce).
Fig. 4
Fig. 4. Tpex cells from acute infections epigenetically resemble their counterparts from chronic infections.
Public scATAC-seq data for total splenic CD8 T cells analysed seven days after mice were infected with either LCMV Armstrong or LCMV clone 13. a, UMAP embedding of cell similarity. Cells are coloured by infection type. b, Signatures for naive, exhausted, precursor exhausted (Tex) and terminally exhausted cells derived from bulk ATAC-seq data are used to compute signature scores for each cell. Colours represent the mean expression level of the signature within the cell shown on the UMAP embedding. c, Cell-type annotations were added on the basis of reference signatures derived from the bulk ATAC-seq experiments in b. Teff, effector T cells. d, Number of differentially accessible (DA) regions between Tpex and Tmpc annotated to genes of interest. e, Pdcd1 locus accessibility signal of cells from acute infection. Marker regions of the Tpex cluster are highlighted in grey. f, UMAP embedding of cell similarity subset on cells from Armstrong infection only. Colours represent cell assignments to Leiden clusters. g, Accessibility signal at FOS::JUN motif locations. h, Transcription-factor activity for the FOS::JUN motif. Data are derived from a single previously published dataset.
Fig. 5
Fig. 5. Strong TCR stimulation and the absence of PD-1 signalling promote Tpex formation in acute infection.
ad, Wild-type (WT) OT-1 (a,b) and wild-type or PD-1KO P14 transgenic (c,d) T cells were adoptively transferred into CD45.2 congenic hosts. Mice were subsequently infected with VSV-V4 (low-affinity stimulation) or VSV-N4 (high-affinity stimulation) (a,b) or with LCMV Armstrong (c,d). Splenocytes were collected seven days after infection. n = 5 (OT-I and wild-type P14 recipients); n = 4 (PD-1KO recipients). a,c, Flow plots show TCF1 versus TOX expression by CD44+KLRG1 gated OT-1 (a) or P14 (c) T cells, and graphs show the frequency of TOX+ OT-1 (a) or P14 (c) precursor T cells. *P < 0.05, **P < 0.01 (two-tailed Mann–Whitney test). b,d, Frequency of TOX and TOX+ TCF1+KLRG1 OT-1 (b) and P14 (d) T cells. e, Average normalized expression of genes from activation and exhaustion signatures (Extended Data Table 1) projected onto the UMAP embedding shown in Fig. 2. f, Pearson correlation between activation and exhaustion scores for individual cells. Colours encode the subcluster assignment as shown in Fig. 2. Line represents a linear model regression and the bands show a confidence interval of 95%. Each symbol in ad represents an individual mouse. Data in ad are representative of at least three independent experiments. Lines in a,b represent the mean. Lines in b,d mark cells originating from the same donor. Data in e,f are derived from a single previously published dataset.
Fig. 6
Fig. 6. Plasticity of Tpex cells formed in the early infection phase.
a, CD45.1 congenic P14 T cells were transferred into C57BL/6 host mice that were infected with LCMV Armstrong. PD-1hi and PD-1lo P14 cells (gating strategy shown in Extended Data Fig. 3b) were collected at 4.5 days post-infection (dpi) and subsequently retransferred into naive C57BL/6 host mice that were infected with LCMV Armstrong on the same day of P14 transfer. Retransferred P14 cells from PD-1hi versus PD-1lo recipients were collected at 15 days after infection and sent for single-cell sequencing. Graphics were created with Biorender.com. b, UMAP representation of Louvain clusters from PD-1hi and PD-1lo recipients. c, Heat map showing z-scored gene expression segregated by PD-1hi and PD-1lo samples. d, Signature score of genes associated with either acute or exhausted CD8 T cells projected onto the UMAP. e, Fractions of PD-1hi and PD-1lo recipients in clusters 1 and 5. Data are derived from a single experiment.
Fig. 7
Fig. 7. Tpex cells are detectable in the memory phase after stronger TCR stimulation.
a, TCF1 and TOX expression in CD8 T cells stained with gp33+ and np396+ multimers at 15 or 30 days after infection. Each symbol represents an individual mouse (n = 5 mice per group). b, Scatter plots showing the mean intensity of expression of TOX (left) or PD-1 (right) by multimer-positive T cells. Each symbol represents an individual mouse (n = 5 mice per group); lines represent the mean; *P < 0.05, **P < 0.01 (two-tailed Mann–Whitney test). c, gp33-specific (green) and np396-specific (purple) TCF1+ precursors were purified from TCF1 reporter mice (n = 3) four weeks after LCMV Armstrong infection. Purified cells were subjected to scRNA-seq with paired TCR repertoire analysis. Clonotype pairs were aligned using their amino-acid sequence. Shown are clonotype networks of all modules containing at least 50 cells, with similar clonotypes connected by an edge. Node size depicts clonotype size, the arbitrary clone number, and colours represent mouse ID. d, Number of cells per clonotype module. Colours indicate the specificity of the clonotype module. e, Z-scores of average expression per clonotype module. The dendrogram was generated using Euclidean distance and complete linkage. Data are representative of three independent experiments (a,b) or derived from a single experiment.
Extended Data Fig. 1
Extended Data Fig. 1. Precursor populations present at 3.25 days after infection show only minimal differences in the expression of Tpex-associated genes.
a, TCR-transgenic P14 T cells were re-isolated from LCMV ARM infected host mice at day 3.25 after infection and subjected to scRNA-seq. Depicted are the six Louvain clusters identified at this time point. b, Feature plots showing the expression of Tcf7 and Tox in the clusters as in a. c, Average cluster expression of genes associated with CD8 T cell differentiation, effector function and memory. Data were derived from a single experiment.
Extended Data Fig. 2
Extended Data Fig. 2. Transcriptional changes between PD-1hi and PD-1lo precursors are strong and match differences seen in comparisons of LCMV-specific CD8 T cells isolated from chronic versus acute infections.
CD45.1 congenic OT-1 (5 × 10³) T cells were transferred into C57BL/6 hosts, which were then infected with recombinant ovalbumin expressing vesicular stomatitis virus (VSV). a, Expression of TCF1 and TOX were analysed in PD-1hi (blue) or PD-1lo (yellow) KLRG1- OT-I cells from VSV-infected mice. b, Adoptively transferred Tcf7gfp(bright)mCherry reporter transgenic P14 T cells were re-isolated from LCMV-infected mice on day 7 after infection and separated into GFP+ CD44+ KLRG1 PD-1lo vs PD-1hi cells and submitted for sequencing. c, Samples of PD-1hi and PD-1lo precursors segregate along principal component 1. d, Volcano plot comparing PD-1hi and PD-1lo samples. Significance values were calculated using empirical Bayes moderated t-statistics and were adjusted with Benjamini–Hochberg correction. e, Signature score of genes associated either with PD-1hi or PD-1lo CD8 T cells projected onto the UMAP from Fig. 2a. f, Gene set enrichment analysis of signatures from PD-1hi and PD-1lo samples on Tpex (cluster 2) vs. Tmpc (cluster 1) from Fig. 2a. The background genes were sorted by differential expression levels between these two clusters, weighted by their significance. P values were calculated using Wilcoxon rank-sum test. g, Log2 normalized counts of bulk RNA-seq with paired PD-1hi and PD-1lo P14 samples from the same donor mouse. Significance values were calculated as in d. n = 5 for all groups, lines in g represent the mean and symbols identify individual mice. Box plots show median, first and third quartiles (hinges), the lines show the smallest or largest observation within a distance from the nearest hinge of 1.5 times the size of the box. Observations outside this range are shown separately as outliers. Data were derived from three independent experiments (a,b) or a single experiment (c-g).
Extended Data Fig. 3
Extended Data Fig. 3. Gating strategies for FACS analyses and cell sorting.
a, Gating strategy to analyse expression of TCF1 and TOX (Fig. 3a,b, Fig. 5a–d and Extended Data Fig. 2a) or the detection of IFNγ and TNF within the TOX+ and TOX- TCF1+ cells (Fig. 3f). Cells were gated for singlets/fsc-ssc/time/live/CD8+/CD45.1 or CD45.1+/CD44+/KLRG followed by analysis of TCF1 vs TOX. TCF1 and TOX gates were also applied on the endogenous CD44CD62L+ naive population to confirm proper placement of TOX gates. b, Gating strategy for the sort of precursor populations (Fig. 3c–e and Extended Data Fig. 2b–d,g,h) Cells were purified by MACS column (Miltenyi) through positive selection of CD45.1+ cells and then stained and sorted for singlets/fsc vs ssc/live/CD8+/CD45.1+/TCF1_GFP+ and for PD-1hi (blue) vs PD-1lo (orange). For the sort of total P14 cells (Extended Data Fig. 1) the same strategy was used. Here, within the singlets/fsc-ssc/live/CD8+ population the CD45.1+ cells were sorted. c, Gating strategy for the sort of endogenous precursor populations (Fig. 7c–e and Extended Data Fig. 6). Cells were gated for fsc-ssc/singlets/live/CD8+/CD44+ tetramer+/TCF1-GFP+. The same gating strategy without the last gate was also used for the analysis of TOX and TCF1 in endogenous tetramer+ populations (Fig. 7a,b).
Extended Data Fig. 4
Extended Data Fig. 4. Accessibility at Pdcd1 locus and motif analysis.
a, Accessibility levels of Tpex marker regions at Pdcd1 locus (highlighted regions in Fig. 4d) directly comparing Tpex and Tmpc clusters of Armstrong and clone 13 infections. b, Top 30 most differentially active transcription factors comparing Tmpc and Tpex clusters of Armstrong infection. Data were derived from a single previously published experiment.
Extended Data Fig. 5
Extended Data Fig. 5. Early but not late Tpex cells show developmental plasticity.
a,b, CD45.1 congenic P14 TCR-transgenic T cells were transferred into C57BL/6 host mice as indicated in Fig. 6a. PD-1hi and PD-1lo P14s were re-isolated on day 4.5 after an acute LCMV infection and transferred into a new C57BL/6 host that was then also infected with acute LCMV. 15 days later, the progeny of the PD-1hi and PD-1lo P14 cells were again isolated and analysed by scRNA-seq. a, Average cluster expression segregated on PD-1hi and PD-1lo. Circle size indicates the percentage of cells expressing the gene of interest. b, Feature plots with colours encoding normalized expression values. c,d, CD45.1 congenic PD-1hi and PD-1lo P14 TCR-transgenic T cells were isolated at 7 days after infection and transferred into naive C57BL/6 hosts. 7 days after infecting the secondary hosts with LCMV Armstrong, the progeny of the transferred PD-1hi and PD-1lo P14 T cells was collected and analysed for TOX and CD44 expression. c, TOX expression in PD-1hi and PD-1lo cells. d, Co-expression of TOX with CD44 in the indicated cell populations. e, C57BL/6 mice were infected with LCMV Armstrong and total splenocytes were isolated 15 and 35 days after infection. Shown are TCF1 and TOX expression by total endogenous CD8 T cells. Data were derived from a single experiment (ad) or three independent experiments (e).
Extended Data Fig. 6
Extended Data Fig. 6. Signs of exhaustion can be found in subsets of np396- but not gp33-specific CD8 T cells.
a, gp33 and np396-specific TCF1+ precursors were purified from TCF1 reporter mice (n = 3) 4 weeks after infecting the mice with LCMV Armstrong. Purified cells were subjected to scRNA-seq. a, UMAP representation of Louvain clusters. b, Epitope fractions per cluster. c, Feature plots depicting the expression of Tox or Pdcd1 in either gp33- or np396-specific CD8 T cells. Data were derived from a single experiment.

References

    1. Zehn, D., Thimme, R., Lugli, E., de Almeida, G. P. & Oxenius, A. ‘Stem-like’ precursors are the fount to sustain persistent CD8+ T cell responses. Nat. Immunol.23, 836–847 (2022). - PubMed
    1. Blank, C. U. et al. Defining ‘T cell exhaustion’. Nat. Rev. Immunol.19, 665–674 (2019). - PMC - PubMed
    1. Barber, D. L. et al. Restoring function in exhausted CD8 T cells during chronic viral infection. Nature439, 682–687 (2006). - PubMed
    1. Blackburn, S. D. et al. Coregulation of CD8+ T cell exhaustion by multiple inhibitory receptors during chronic viral infection. Nat. Immunol.10, 29–37 (2009). - PMC - PubMed
    1. Alfei, F. et al. TOX reinforces the phenotype and longevity of exhausted T cells in chronic viral infection. Nature571, 265–269 (2019). - PubMed

MeSH terms

LinkOut - more resources