. 2025 Feb:205:106793.
doi: 10.1016/j.nbd.2025.106793. Epub 2025 Jan 6.

Modeling sacsin depletion in Danio Rerio offers new insight on retinal defects in ARSACS

Affiliations

Modeling sacsin depletion in Danio Rerio offers new insight on retinal defects in ARSACS

Valentina Naef et al. Neurobiol Dis. 2025 Feb.

Abstract

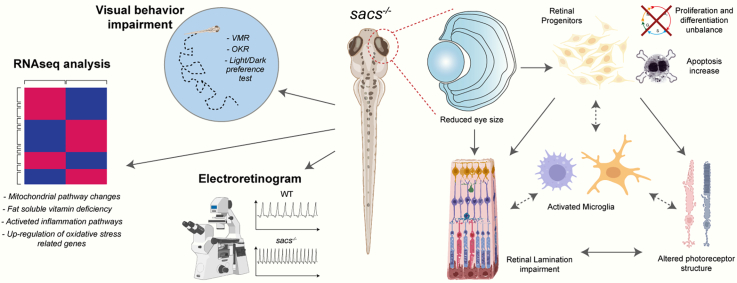
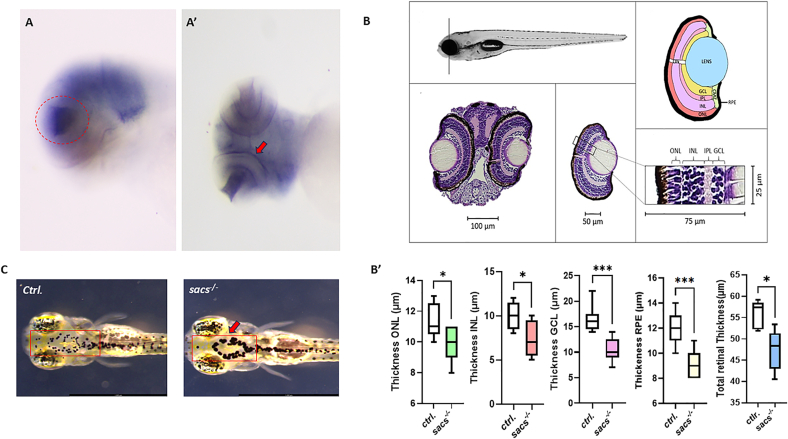
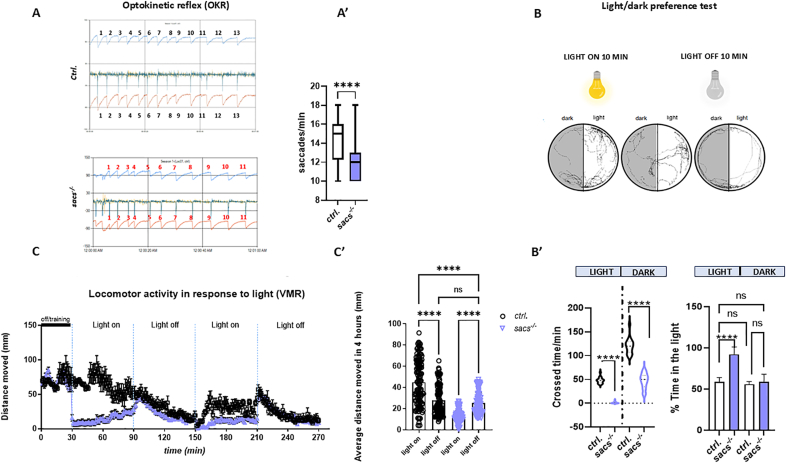
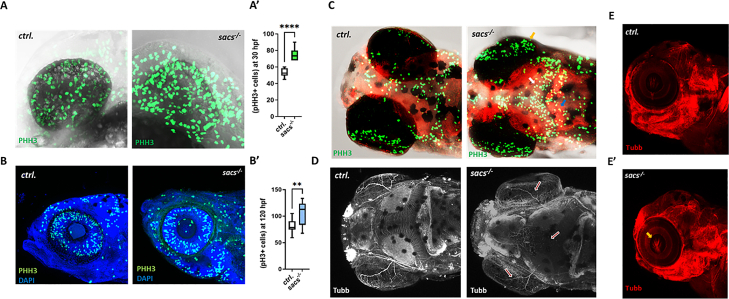
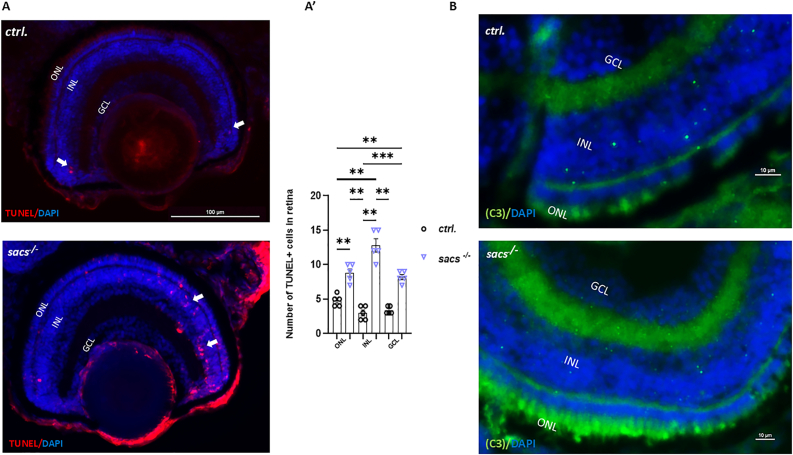
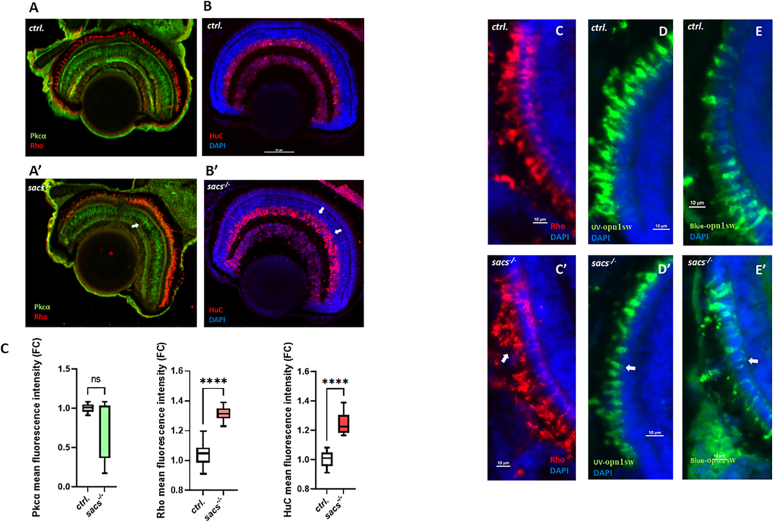
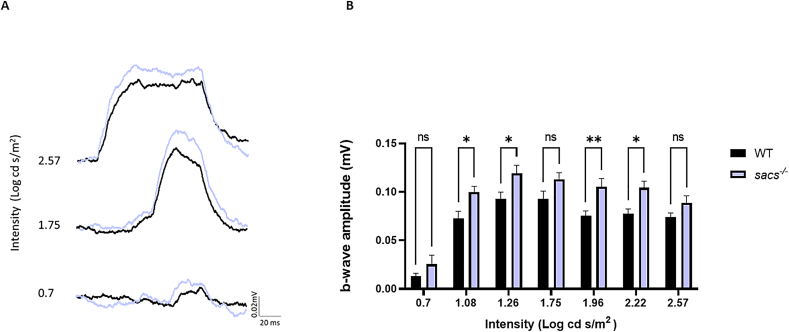
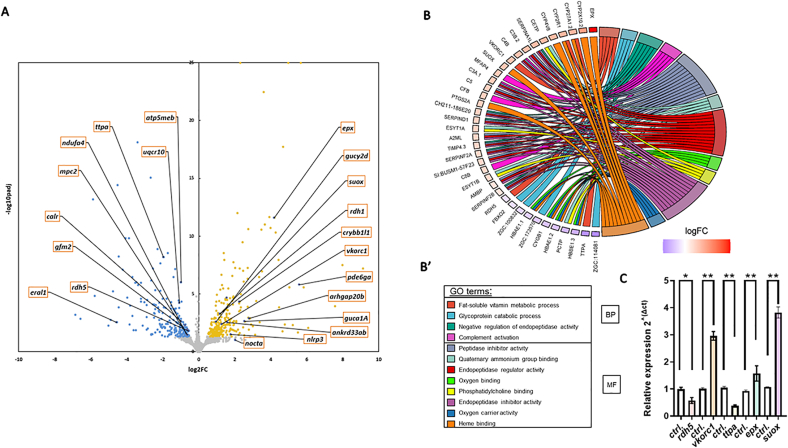
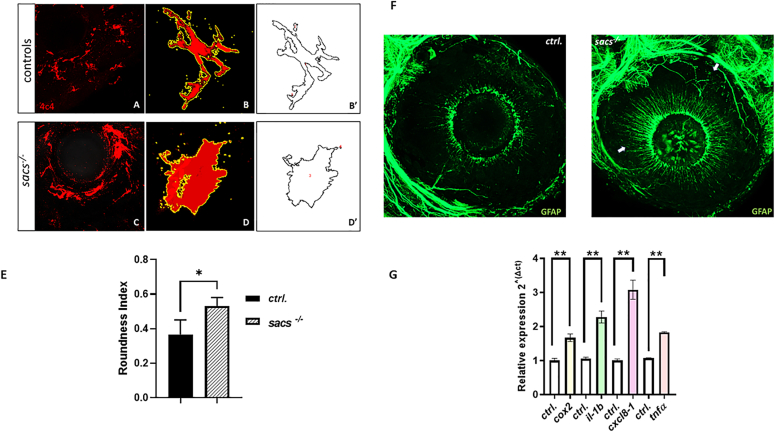
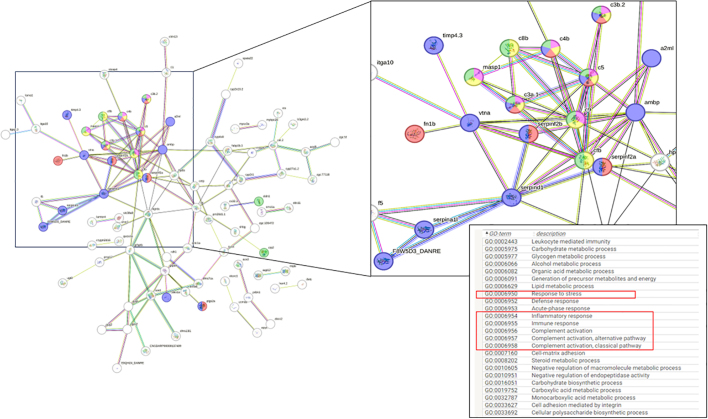
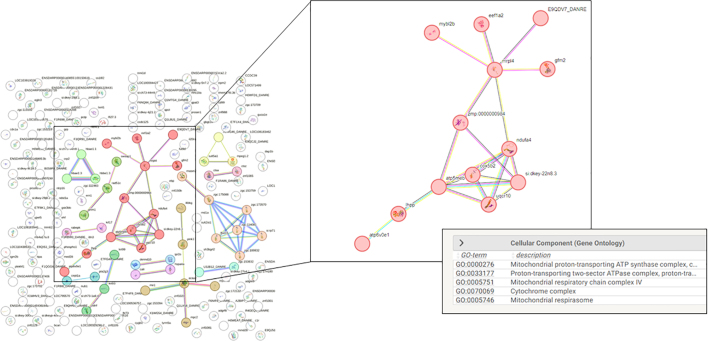
Biallelic mutations in the SACS gene, encoding sacsin, cause early-onset autosomal recessive spastic ataxia of Charlevoix-Saguenay (ARSACS), a neurodegenerative disease also characterized by unique and poorly understood retinal abnormalities. While two murine models replicate the phenotypic and neuronal features observed in patients, no retinal phenotype has been described so far. In a zebrafish knock-out strain that faithfully mirrors the main aspects of ARSACS, we observed impaired visual function due to photoreceptor degeneration, likely caused by cell cycle defects in progenitor cells. RNA-seq analysis in embryos revealed dysfunction in proteins related to fat-soluble vitamins (e.g., TTPA, RDH5, VKORC) and suggested a key role of neuroinflammation in driving the retinal defects. Our findings indicate that studying retinal pathology in ARSACS could be crucial for understanding the impact of sacsin depletion and may offer insights into halting disease progression.

Keywords: ARSACS; Neurological disorder; Retina development; Retinal abnormalities; Zebrafish.


Conflict of interest statement

Declaration of competing interest The authors declare that they have no conflicts of interest.

Figures

Unlabelled Image
Graphical abstract
Fig. 1
Fig. 1
Loss of sacs gene affect neural retina formation and altered VBA reflex. (A) At 72 hpf sacs gene is expressed in the most anterior region of the CNS and in the eye field (red circle in A, lateral view; red arrow in A', ventral view). (B-B′) Hematoxylin/eosin staining revealed a normal organization in retina structure in sacs-/- larvae and reduced thickness of ONL (the outer nuclear layer), INL (inner nuclear layer), GCL (ganglion cell layer), and in RPE (retinal pigmented epithelium) and in total retinal thickness. Error bars indicate mean ± s.e.m. Statistical differences were computed using the two-tailed Mann-Whitney test and are indicated as (*p < 0.05; ***p < 0.001). (IPL (inner plexiform layer)). Results were obtained from representative sections from 5 zebrafish control embryos and 5 sacs-/- mutant larvae. C) Head dorsal view of 120 hpf control and sacs-/- larvae with insets showing their pigmentation pattern (red arrow). Scale bar = 100 μm. (For interpretation of the references to colour in this figure legend, the reader is referred to the web version of this article.)
Fig. 2
Fig. 2
Visual impairment in the sacs-/- larval zebrafish. (A-A') Zebrafish sacs-/- mutant larvae at 120 hpf showed reduced optokinetic response. The frequency was calculated considering the number of saccades per minute for each larva examined (N = 40 for each group, sacs-/- and controls). (B-B′) Light-Dark preference test was performed according to (Rock et al., 2022). At 120 h post-fertilization, sacs-/- mutant larvae displayed freezing behavior under light conditions (measured as crossed time per minute) and showed no preference for the bright/white area during the dark phase (measured as percentage of time spent in the light area (N = 15 for each group,sacs-/-and controls). ****p < 0.0001 was calculated by Kruskal Wallis test multiple comparisons. (C-C′) Zebrafish sacs-/- mutant larvae at 120 hpf showed an affected visual motor response (VMR). Sacs-/- mutants motor activity appears significantly higher in light- off conditions compared to controls siblings and greatly reduced in light-on condition (n = 20 for each group, sacs-/- and controls). ****p < 0.0001 was calculated by two-tailed Mann-Whitney test. Error bars indicate mean ± s.e.m.
Fig. 3
Fig. 3
Zebrafish mutants lacking the sacs gene exhibited an imbalance between cell proliferation and differentiation. (A-B). Representative figure of anti-pH 3 immunostaining. A-A') Lateral view pictures of control and sacs-/- specimens. At 24 hpf homozygous larvae showed a significant increase in pH 3-positive cells that were counted in the whole eye area. **** p < 0.0001 was calculated by the two-tailed Mann-Whitney U Test. Error bars indicate mean ± s.e.m. (B-B′) Anti-pH 3 immunostaining at 120 hpf in controls and sacs-/- mutant larvae. **p < 0.01, Statistics were calculated by two-tailed Mann-Whitney U Test. (C) Representative fluorescence images of anti-pH 3 immunostaining at 120 hpf (dorsal view) in controls and sacs-/- mutant larvae. (D) Immunostaining of acetylated-α tubulin. Dorsal view pictures of representative control and sacs-/-specimens. Red arrows indicate defects in axonal outgrowth. (E) Representative immunostaining of acetylated-α tubulin at 120 hpf (lateral view). sacs-/-mutants exhibited alteration in optic nerve thickness (yellow arrow). All images were acquired using a Zeiss LSM 900 confocal-microscope. PHH3+ cells were counted per area. Scale bar = 50 μm (A) and 10 μm (B). (For interpretation of the references to colour in this figure legend, the reader is referred to the web version of this article.)
Fig. 4
Fig. 4
Increased apoptosis contributes to retinal defects in sacs-/- zebrafish mutants. (A) Representative TUNEL staining on retinal frozen section of zebrafish larvae at 120 hpf from control embryos and mutants. (A') Quantification of the number of TUNEL-positive cells in the entire retina based on three independent measurements of larvae per group at 120 hpf. ** p < 0.01; *** p < 0.001 were calculated by Kruskal Wallis test multiple comparisons. (B) Immunostaining of the retinal section with activated Caspase-3 antibody (green) at 120 hpf. Nuclei were highlighted with DAPI (blue). ONL, outer nuclear layer; INL, inner nuclear layer, GCL, ganglion cell layer. Scale bar = 100 μm (A) and 10 μm (B). All images were acquired using a Zeiss LSM 900 confocal-microscope. TUNEL+ cells were counted per area considering whole retina section. (For interpretation of the references to colour in this figure legend, the reader is referred to the web version of this article.)
Fig. 5
Fig. 5
Sacsin deficiency alters cell fate and photoreceptor structure in zebrafish retina (A) Representative confocal images of the retina of sacs-/- zebrafish obtained after immunostaining of rods with a rhodopsin antibody (red) and with PKC-α to label bipolar cells. (B) Immunostaining of amacrine cells with a HuC antibody (red). Nuclei were highlighted with DAPI·(C) Analysis of fluorescence mean intensity in knockout larvae compared to controls. (D-F′) Representative confocal images of the retina of sacs-/- zebrafish obtained after immunostaining of rods with a rhodopsin antibody (red) and cones (Uv-opn1sw and Blue-opn1sw) in green. Scale bar = 50 μm (A-B′) and 10 μm (C-D′). (For interpretation of the references to colour in this figure legend, the reader is referred to the web version of this article.)
Fig. 6
Fig. 6
ERG response is increased in sacs-/- larvae. (A) Representative ERG traces at low, medium and maximum light intensity from control (black), sacs-/- (blue) at 120 hpf. (B) Averaged ERG b-wave amplitudes from control (black), sacs-/- (blue) larvae. Sacs-/- mutants produce an increase of the ERG b-wave amplitude compared with control throughout all light intensities tested (*p < 0.05, **p < 0.01). Data were collected from three independent experiments (N = 30 for each group, sacs-/- and controls). For statistical comparison, a two-way ANOVA test was used. (ns: not significant; SI unit for luminance is candela per square meter (cd/m2)). (For interpretation of the references to colour in this figure legend, the reader is referred to the web version of this article.)
Fig. 7
Fig. 7
RNA-seq analysis revealed mitochondrial pathway changes and fat-soluble vitamin deficiency. (A) Significant genes with padj<0.05 and log2FC > 0.58 or log2FC < −0.58 are highlighted in yellow or blue, respectively. Genes not significantly expressed are represented by grey points. (B) The top enriched Biological Processes GO categories have then been plotted. Loss of sacsin during early development leads to an impairment in fat-soluble vitamin related protein (e.g TTPA) and other proteins involved in mitochondrial function and metabolism. Relative mRNA expression of DEGs genes were evaluated in sacs-/- larvae at 120 hpf normalized to β-actin. Three independent RNA samples from sacs-/- mutant larvae at 120 hpf and from controls. *p < 0.05 or **p < 0.01 were calculated by two-tailed Student's t-test. Error bars indicate mean ± s.e.m. (For interpretation of the references to colour in this figure legend, the reader is referred to the web version of this article.)
Fig. 8
Fig. 8
sacs-/- mutant retinas showed Müller glia activation and inflammation (A and C) Eye confocal images of control and sacs-/- larvae obtained after immunostaining with antibody 4C4, which is specific for zebrafish microglia. (B and D) cell digital image. After random selection of cells from the eye picture (A and C), the noise was removed by filtering the overall background to get a shape extraction. Next, the image was changed to grayscale, and then transformed into a binary image. The binary image was edited to clear the background and to join all branches (B′ and D′). (E) Quantification of the roundness index revealed activated microglia in sacs-/- larvae which appeared ameboid in shape. *p < 0.05 was calculated by two-tailed Mann-Whitney U Test (N = 3 for each group). (F) The up-regulation of GFAP in sacs-/- retinas as detected by immunostaining. (G) Relative mRNA expression of inflammatory factors evaluated in sacs-/- larvae at 120 hpf. qRT-PCR analysis revealed an increase in the levels of inflammatory genes, normalized to β-actin. Three independent RNA samples from sacs-/- mutant larvae at 120 hpf and from controls. *p < 0.05, calculated by two-tailed Student's t-test. Error bars indicate mean ± s.e.m.
Supplementary Fig. 1
Protein-Protein Interaction Analysis. Using bioinformatic suite STRING (https://string-db.org/) we performed a Protein-Protein Interaction Analysis (PPI). This step revealed multiple up-regulated proteins related to the inflammatory response and to oxidative stress suggesting an inflammatory state of sacs-/- mutants compared to controls (https://string-db.org/).
Supplementary Fig. 2
Protein-Protein Interaction Analysis. Using bioinformatic suite STRING (https://string-db.org/) we performed a Protein-Protein Interaction Analysis (PPI). This step revealed multiple down-regulated proteins related to the mitochondrial function in sacs-/- mutants compared to controls (https://string-db.org/).

Similar articles

Cited by

References

    1. Aly K.A., Moutaoufik M.T., Zilocchi M., Phanse S., Babu M. Insights into SACS pathological attributes in autosomal recessive spastic ataxia of Charlevoix-Saguenay (ARSACS)☆. Curr. Opin. Chem. Biol. 2022;71 doi: 10.1016/j.cbpa.2022.102211. - DOI - PubMed
    1. Angueyra J.M., Kindt K.S. Leveraging zebrafish to study retinal degenerations. Front. Cell Dev. Biol. 2018;6:110. doi: 10.3389/fcell.2018.00110. - DOI - PMC - PubMed
    1. Appell M.B., Pejavar J., Pasupathy A., Rompicharla S.V.K., Abbasi S., Malmberg K., Kolodziejski P., Ensign L.M. Next generation therapeutics for retinal neurodegenerative diseases. J. Control. Release. 2024;367:708–736. doi: 10.1016/j.jconrel.2024.01.063. - DOI - PMC - PubMed
    1. Bagaria J., Bagyinszky E., An S.S.A. Genetics of autosomal recessive spastic Ataxia of Charlevoix-Saguenay (ARSACS) and role of Sacsin in neurodegeneration. Int. J. Mol. Sci. 2022;23 doi: 10.3390/ijms23010552. - DOI - PMC - PubMed
    1. Borruat F.-X., Holder G.E., Bremner F. Inner retinal dysfunction in the autosomal recessive spastic Ataxia of Charlevoix-Saguenay. Front. Neurol. 2017;8 doi: 10.3389/fneur.2017.00523. - DOI - PMC - PubMed

MeSH terms

Supplementary concepts

LinkOut - more resources