. 2025 Jan 7;53(1):gkae1311.
doi: 10.1093/nar/gkae1311.

Cell cycle progression of under-replicated cells

Affiliations

Cell cycle progression of under-replicated cells

Min Huang et al. Nucleic Acids Res. .

Abstract

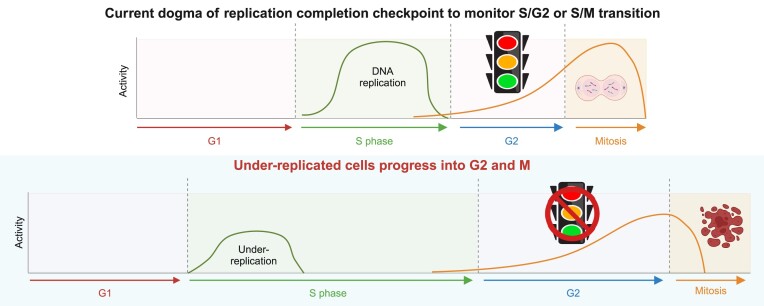
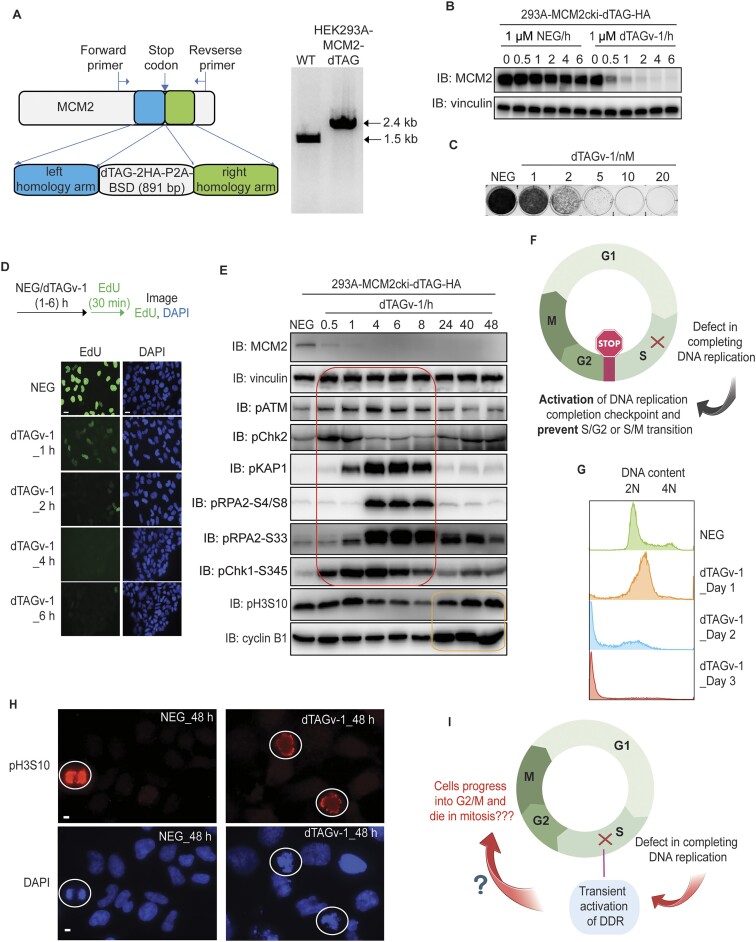
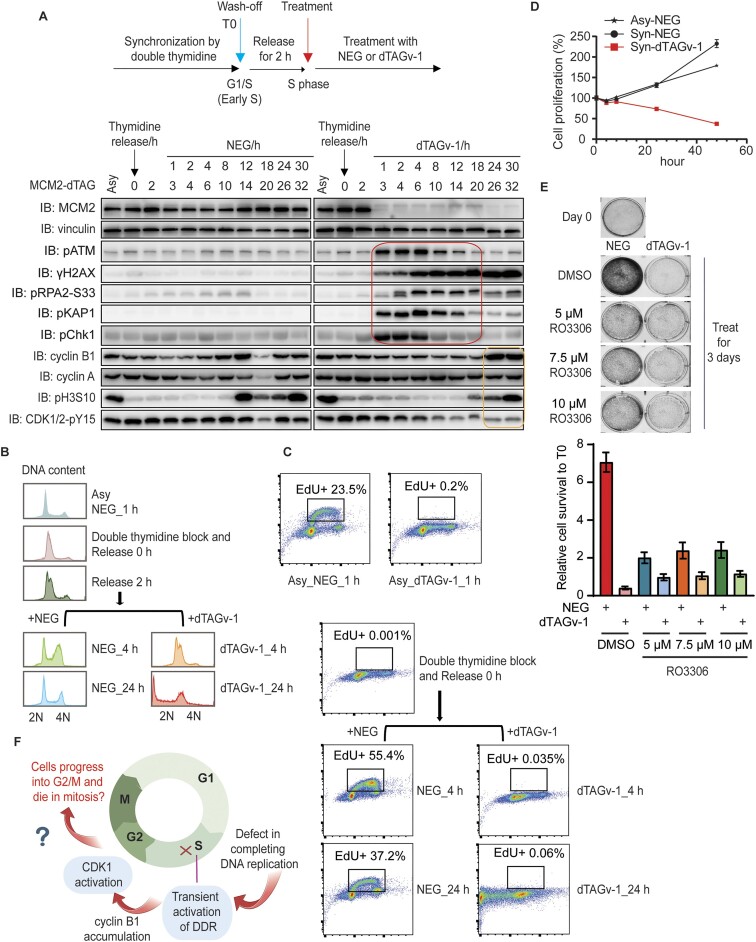
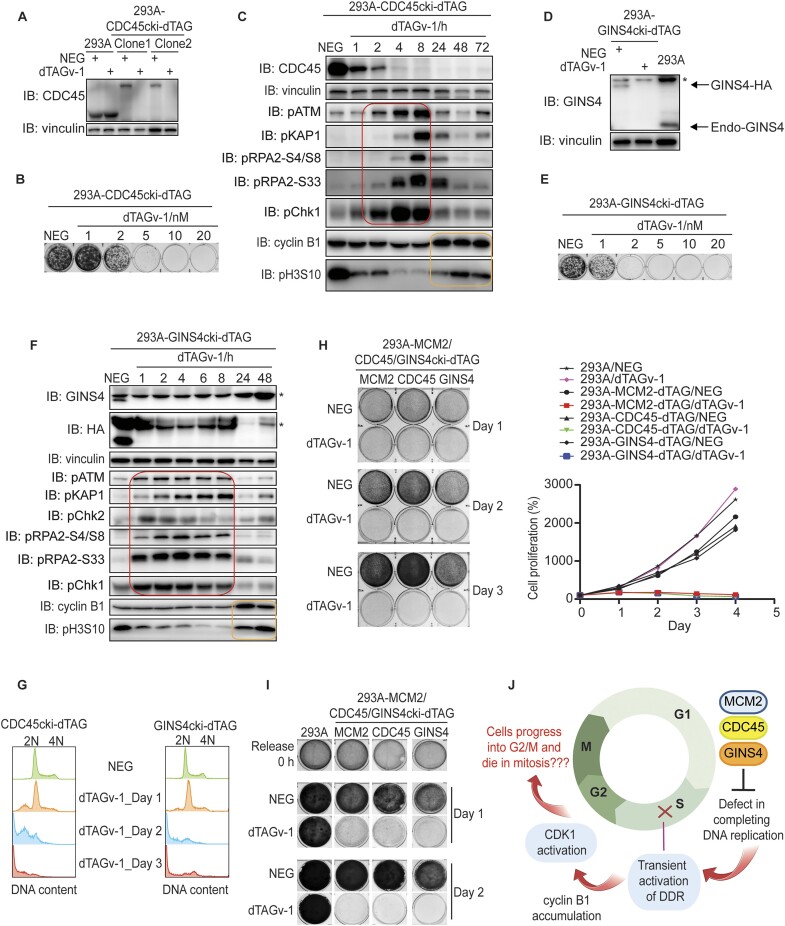
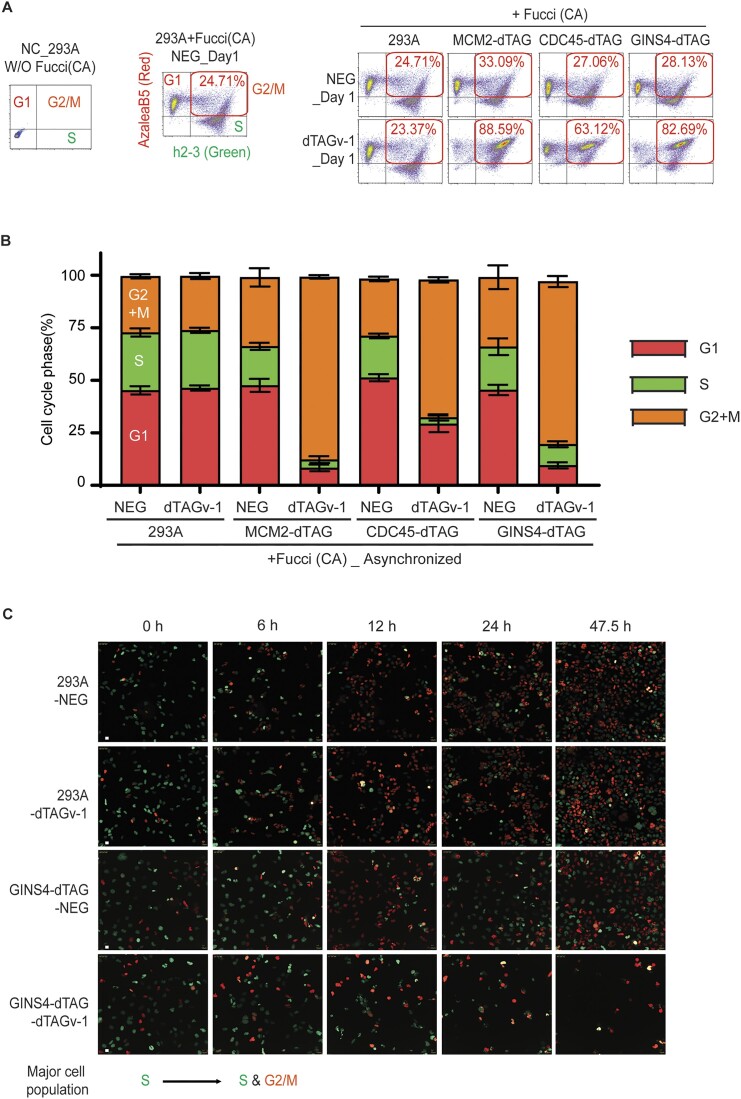
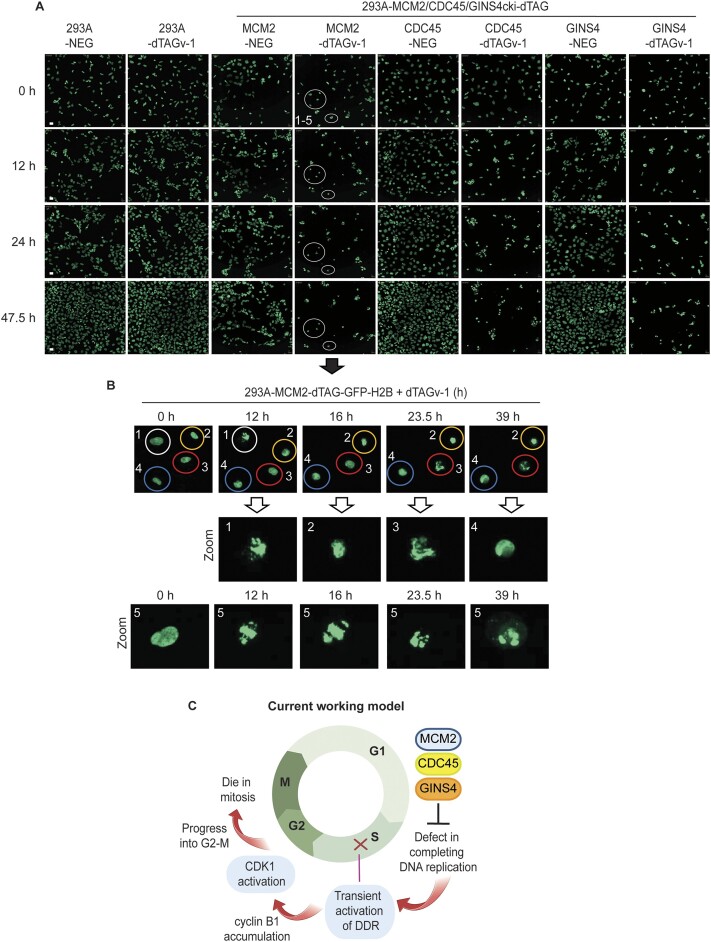
Cell cycle checkpoints are the regulatory mechanisms that secure the strict order of cellular events for cell division that ensure genome integrity. It has been proposed that mitosis initiation depends on the completion of DNA replication, which must be tightly controlled to guarantee genome duplication. Contrary to these conventional hypotheses, we showed here that cells were able to enter mitosis without completion of DNA replication. Although DNA replication was not completed in cells upon depletion of MCM2, CDC45 or GINS4, these under-replicated cells progressed into mitosis, which led to cell death. These unexpected results challenge current model and suggest the absence of a cell cycle checkpoint that monitors the completion of DNA replication.


Figures

Graphical Abstract
Graphical Abstract
Figure 1.
Figure 1.
MCM2 depletion results in transient activation of DNA damage responses. (A) Schematic design of the donor template used for the generation of HEK293A-MCM2-dTAG cells (left). The forward and reverse primers outside of respectively left and right homology arms were used for PCR validation of HEK293A-MCM2cki-dTAG clones (right). (B) Western blot validation of MCM2cki-dTAG cell line in the presence of 1 μM NEG or 1 μM dTAGv-1. (C) Clonogenic survival of MCM2-dTAG cells were determined in the presence of NEG or different concentrations of dTAGv-1. (D) Immunofluorescent staining of EdU-positive cells in MCM2-dTAG cells. Cells were treated 1 μM NEG or dTAGv-1 for the time indicated (hours), then pulse-labelled with 10 μM EdU for 30 min immediately before fixation. Representative images of EdU immunostaining are shown (scale bar 100 px). (E) Immunoblots of the indicated proteins prepared from MCM2-dTAG cells treated with NEG or dTAGv-1 for the indicated hours. Both floated and adhesive cells were collected for analysis. The red box shows the transient activation of DDR signaling, while the yellow box displays the increased levels of pH3S10 and cyclin B1 reflecting cells entering mitosis. (F) Conventional hypothesis for the activation of DNA replication completion checkpoint. The image was created with BioRender. (G) Flow cytometry analysis of DNA content of MCM2-dTAG cells that were treated with NEG or dTAGv-1 for the indicated time periods (days). More than 10 000 cells were collected for analyses. (H) Immunofluorescent staining of pH3S10 in MCM2-dTAG cells. Cells were treated 1 μM NEG or dTAGv-1 for 48 h. Representative images of pH3S10 are shown (scale bar 10 μm). (I) Schematic depiction of the observed outcomes of MCM2-depleted cells with incomplete DNA replication. The image was created with BioRender.
Figure 2.
Figure 2.
Cells with MCM2 depletion enter mitosis with incomplete DNA replication. (A) Immunoblots of the indicated proteins prepared from double-thymidine synchronized MCM2-dTAG cells. The synchronized cells were released for 2 h before treatment with NEG or dTAGv-1 for the indicated time periods (hours). The red box shows the transient activation of DDR signaling, while the yellow box displays the increased levels of pH3S10 and cyclin B1 as well as the decreased level of CDK1/2-pY15 that reflect cells entering mitosis. (B) Flow cytometry analyses of DNA content using asynchronized and double-thymidine synchronized MCM2-dTAG cells. More than 10 000 cells were collected for analyses. (C) Flow cytometry analyses of EdU intensity using the same or similar samples in (B). More than 10 000 cells were collected for analyses. The X and Y axes respectively represent DNA content and EdU intensity. (D) CellTiter-Glo luminescence assay was conducted to examine cell proliferation in double-thymidine synchronized MCM2-dTAG cells. (E) Clonogenic survival of MCM2-dTAG cells in the presence of 1 μM NEG or 1 μM dTAGv-1 combined with different concentrations of RO3306 (5, 7.5 or 10 μM) or DMSO for 3 days. Day 0 shows the cell confluency before any treatment. The representative images are shown. The intensity of cell confluency was measured by ColonyArea ImageJ plugin. Bars represent the mean ± SEM (n = 3). (F) Schematic illustration of the observed outcomes of MCM2-depleted cells with incomplete DNA replication. The image was created with BioRender.
Figure 3.
Figure 3.
Both CDC45 and GINS4 depletion recapitulate phenotypes of MCM2 ablation. (A) Western blot validation of HEK293A-CDC45cki-dTAG cell lines in the presence of 1 μM NEG or 1 μM dTAGv-1. (B) Clonogenic survival of CDC45-dTAG cells in the presence of NEG or different concentrations of dTAGv-1. (C) Immunoblots of the indicated proteins prepared from CDC45-dTAG cells with treatment of NEG or dTAGv-1 for the indicated time periods (hours). Both floated and adhesive cells were collected for analyses. The red box shows the transient activation of DDR signaling, while the yellow box displays the increased levels of pH3S10 and cyclin B1 reflecting cells entering mitosis. (D) Western blot validation of HEK293A-GINS4cki-dTAG cell lines in the presence of 1 μM NEG or 1 μM dTAGv-1. The asterisk indicates the non-specific band. (E) Clonogenic survival of GINS4-dTAG cells in the presence of NEG or different concentrations of dTAGv-1. (F) Immunoblots of the indicated proteins prepared from GINS4-dTAG cells with treatment of NEG or dTAGv-1 for the indicated time periods (hours). Both floated and adhesive cells were collected for analyses. The asterisk indicates the non-specific band. The red box shows the transient activation of DDR signaling, while the yellow box displays the increased levels of pH3S10 and cyclin B1 reflecting cells entering mitosis. (G) Flow cytometry analyses of DNA content of CDC45- or GINS4-dTAG cells treated with NEG or dTAGv-1 for days as indicated. More than 10 000 cells were collected for analyses. (H) CellTiter-Glo luminescence assay as well as clonogenic assay were conducted to examine cell proliferation in HEK293A and HEK293A-MCM2/CDC45/ GINS4-dTAG cells. (I) Clonogenic assay for assessing cell proliferation in double-thymidine synchronized HEK293A and HEK293A-MCM2/CDC45/GINS4-dTAG cells. (J) Schematic illustration of similarities between MCM2 ablation and CDC45 or GINS4 depletion. The image was created with BioRender.
Figure 4.
Figure 4.
MCM2-, CDC45- or GINS4-depleted cells enter and die in mitosis with incomplete DNA replication shown by Fucci (CA) assay. (A) Flow cytometry analyses of HEK293A-Fucci (CA) and HEK293A-MCM2/CDC45/GINS4-dTAG-Fucci (CA) cells. HEK293A cells without introducing Fucci (CA) were included as the negative control (NC) for gating G1, S and G2/M. NEG- or dTAGv-1-treated HEK293A-Fucci (CA) cells were further gated according to the expression pattern of fluorescent proteins. Cells only expressing AzaleaB5-hCdt1(1/100) (red) were gated as G1 cells, while cells only expressing h2-3-hGem(1/110) (green) were gated as S phase cells and cells expressing both proteins were gated as cells in G2/M. More than 10 000 cells were collected for analyses. (B) Flow cytometry analyses of asynchronized HEK293A-Fucci (CA) and HEK293A-MCM2/CDC45/GINS4-dTAG-Fucci (CA) cells using the same or similar samples in (A). HEK293A-Fucci (CA) and HEK293A-MCM2/CDC45/GINS4-dTAG-Fucci (CA) cells were treated with NEG- or dTAGv-1 for 24 h, followed by FACS analyses. More than 10 000 cells were collected for analyses. Bars represent the mean ± SEM (n = 3). (C) Live-cell imaging of HEK293A-Fucci (CA) and HEK293A-GINS4-dTAG-Fucci (CA) cells. Cells were synchronized with double thymidine block and then released for 2 h for most cells entering S phase, followed by treatment with NEG or dTAGv-1. Eight independent field of cell population for every sample was imaged, and images were taken every 30 min until 48 h. Representative images at indicated hours are shown (scale bar 100 px).
Figure 5.
Figure 5.
MCM2-, CDC45- or GINS4-depleted cells enter and die in mitosis with incomplete DNA replication reflected by live cell imaging with GFP-H2B. (A) Live-cell imaging of HEK293A-GFP-H2B and HEK293A-MCM2/CDC45/GINS4-dTAG-GFP-H2B cells. Cells were synchronized in S phase and then released for 2 h followed by treatment with NEG or dTAGv-1, which was similar to that described in (B). Eight independent field of cell population for every sample was imaged, and images were taken every 30 min until 48 h. Representative images at indicated hours are shown (scale bar 100 px). (B) Live-cell imaging of dTAGv-1-treated HEK293A-MCM2-dTAG-GFP-H2B cells. These cells were the same cells shown by circle in Figure 4C and the zoomed in images were used for better representation. Representative images of abnormal nuclear condensation and chromosome segregation are shown. (C) Schematic representation of our current working hypothesis. Cells with MCM2, CDC45 or GINS4 depletion are not able to complete DNA replication. These cells transiently activate DNA damage responses for several hours. Although these cells never complete DNA replication, DNA damage responses in these cells diminish afterwards. Cells progress into G2/M phase and eventually die in mitosis, likely due to abnormal nuclear condensation and chromosome alignment as well as failed cytokinesis resulting from incomplete genome duplication. The image was created with BioRender.

Similar articles

References

    1. Hartwell L.H., Weinert T.A. Checkpoints: controls that ensure the order of cell cycle events. Science. 1989; 246:629–634. - PubMed
    1. Elledge S.J. Cell cycle checkpoints: preventing an identity crisis. Science. 1996; 274:1664–1672. - PubMed
    1. Torres-Rosell J., De Piccoli G., Cordon-Preciado V., Farmer S., Jarmuz A., Machin F., Pasero P., Lisby M., Haber J.E., Aragon L. Anaphase onset before complete DNA replication with intact checkpoint responses. Science. 2007; 315:1411–1415. - PubMed
    1. Piatti S., Lengauer C., Nasmyth K. Cdc6 is an unstable protein whose de novo synthesis in G1 is important for the onset of S phase and for preventing a ‘reductional’ anaphase in the budding yeast Saccharomyces cerevisiae. EMBO J. 1995; 14:3788–3799. - PMC - PubMed
    1. Sansam C.L., Cruz N.M., Danielian P.S., Amsterdam A., Lau M.L., Hopkins N., Lees J.A. A vertebrate gene, ticrr, is an essential checkpoint and replication regulator. Genes Dev. 2010; 24:183–194. - PMC - PubMed

MeSH terms

Substances

LinkOut - more resources