. 2025 Jan 7;53(1):gkae1316.
doi: 10.1093/nar/gkae1316.

Benchmarking cross-species single-cell RNA-seq data integration methods: towards a cell type tree of life

Affiliations

Benchmarking cross-species single-cell RNA-seq data integration methods: towards a cell type tree of life

Huawen Zhong et al. Nucleic Acids Res. .

Abstract

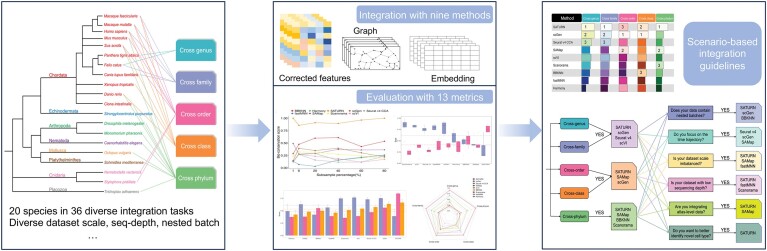
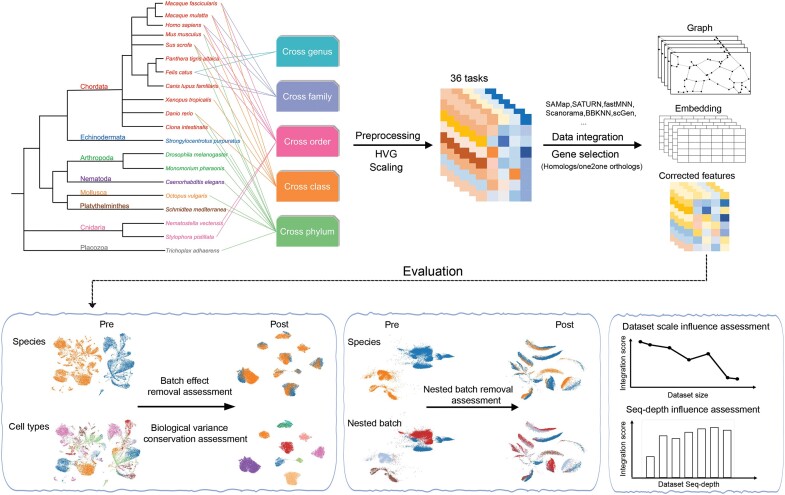
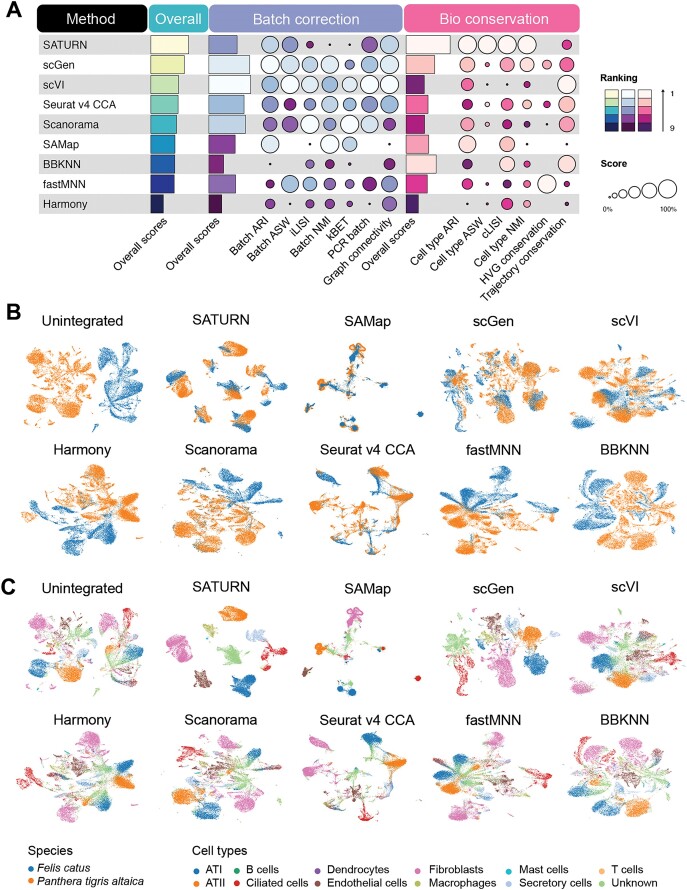
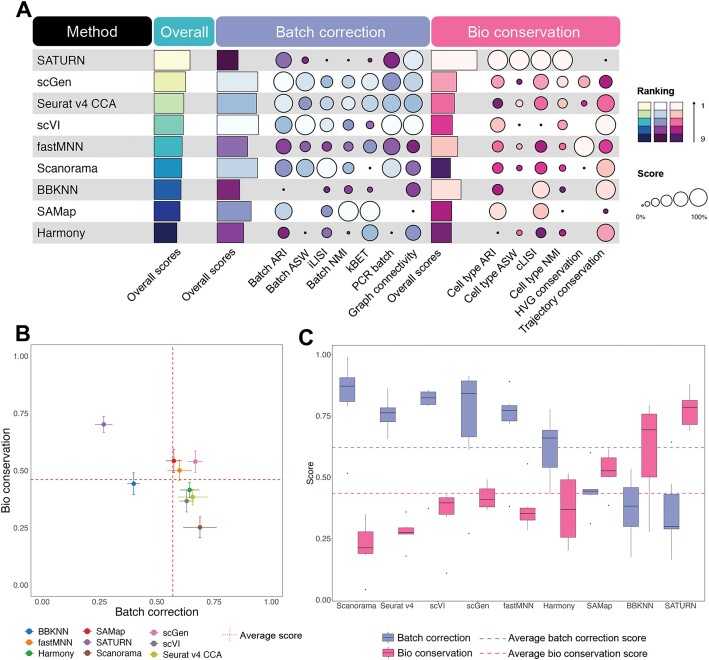
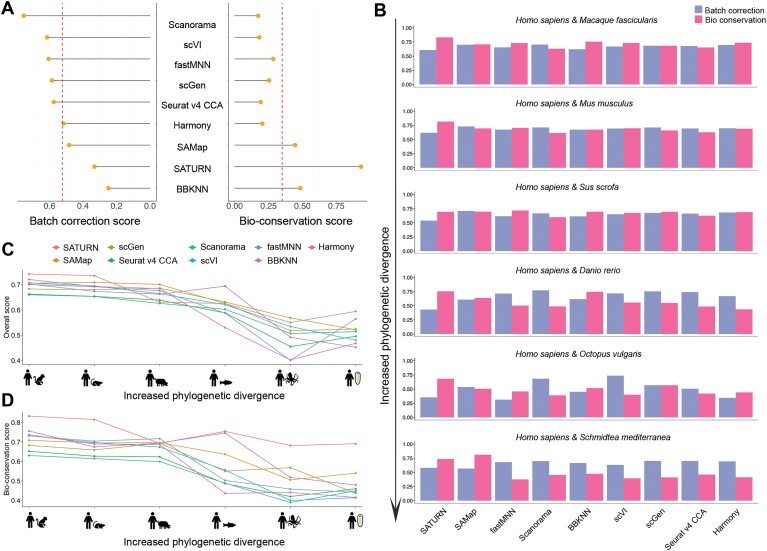
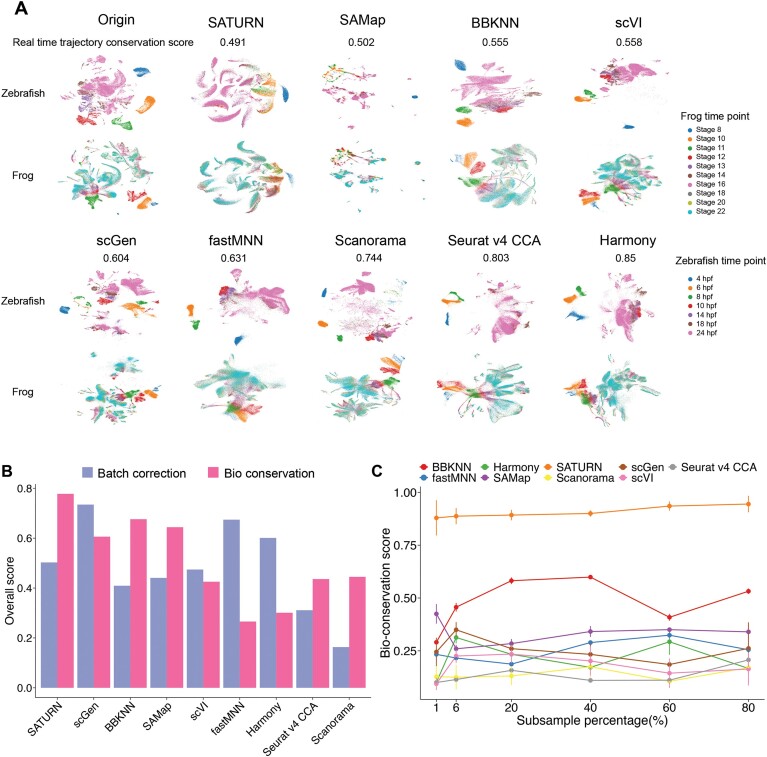
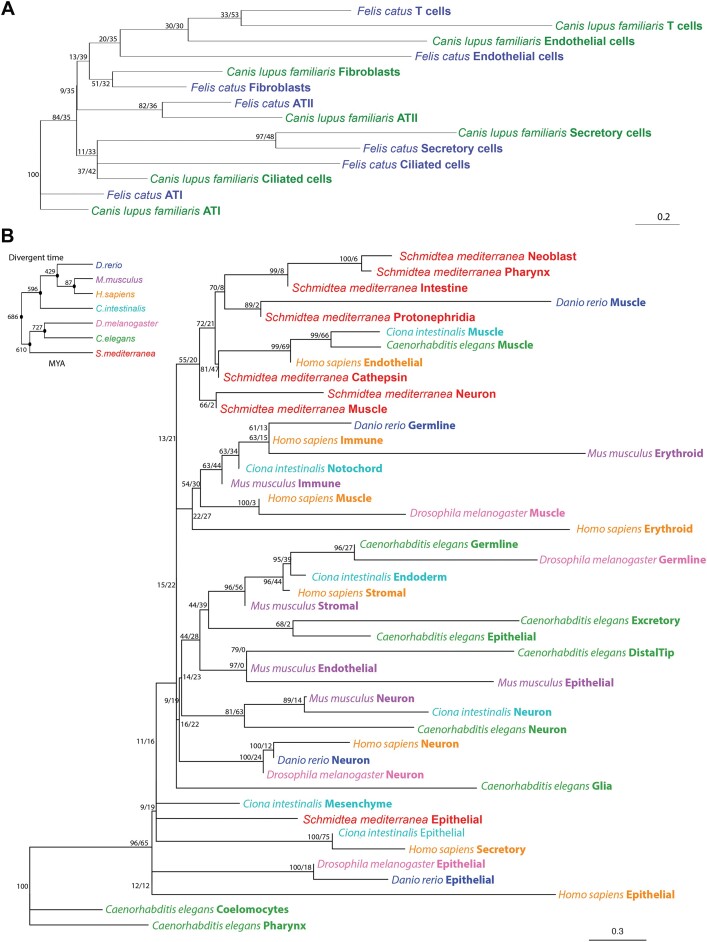
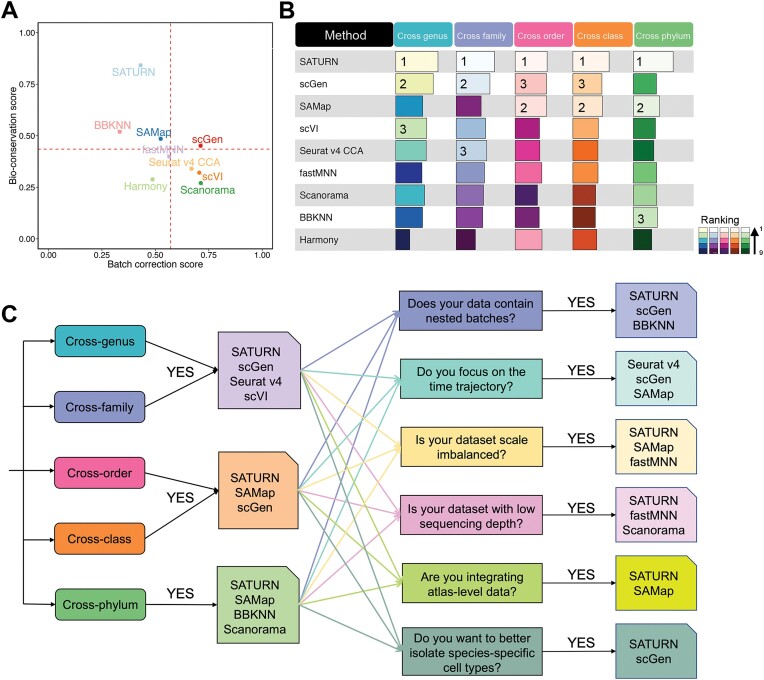
Cross-species single-cell RNA-seq data hold immense potential for unraveling cell type evolution and transferring knowledge between well-explored and less-studied species. However, challenges arise from interspecific genetic variation, batch effects stemming from experimental discrepancies and inherent individual biological differences. Here, we benchmarked nine data-integration methods across 20 species, encompassing 4.7 million cells, spanning eight phyla and the entire animal taxonomic hierarchy. Our evaluation reveals notable differences between the methods in removing batch effects and preserving biological variance across taxonomic distances. Methods that effectively leverage gene sequence information capture underlying biological variances, while generative model-based approaches excel in batch effect removal. SATURN demonstrates robust performance across diverse taxonomic levels, from cross-genus to cross-phylum, emphasizing its versatility. SAMap excels in integrating species beyond the cross-family level, especially for atlas-level cross-species integration, while scGen shines within or below the cross-class hierarchy. As a result, our analysis offers recommendations and guidelines for selecting suitable integration methods, enhancing cross-species single-cell RNA-seq analyses and advancing algorithm development.


Figures

Graphical Abstract
Graphical Abstract
Figure 1.
Figure 1.
Schematic diagram of the benchmarking workflow. Here, nine data integration methods were tested using 36 cross-species integration tasks. Integration results were evaluated using 13 metrics that assess batch effect removal (species mixing), nested batch effect removal and conservation of biological variance. The influence of imbalanced dataset and data sequencing depth on the methods were also assessed.
Figure 2.
Figure 2.
Benchmarking results for the cross-genus integration task. (A) Overview of the methods ranked by average overall scores, with detailed average batch correction and average bioconservation scores for two cross-genus integration tasks. Overall scores are computed based on batch correction scores and bioconservation scores (‘Materials and methods’ section). (B and C) UMAP layouts visualizing unintegrated and integrated Felis catus (cat) and Panthera tigris altaica (tiger) lung datasets colored by species labels (B) and cell type labels (C).
Figure 3.
Figure 3.
Benchmarking results for the integration tasks across family, order and class species pairs. (A) Performance of all methods in cross-family integration, ranked by average overall scores with detailed average scores for batch correction and bioconservation. (B) Scatter plot of the average overall batch correction score against the average overall bioconservation score for all cross-order species integration tasks. The error bars represent the standard errors across the tasks. The vertical dashed line represents the average batch correction score for all the methods in cross-order species integration tasks. The horizontal dashed line represents the average bioconservation score for all methods in cross-order species integration tasks. (C) Box plot of batch correction score and bioconservation score in cross-class species integration tasks. The purple dashed line represents average batch correction scores for all methods in cross-class species integration tasks. The pink dashed line represents average bioconservation scores for all methods in cross-class species integration tasks.
Figure 4.
Figure 4.
Benchmarking results for integration cross-phylum tasks. (A) Lollipop plot showing average performance in batch correction and bioconservation after scaling. Vertical dashed lines represent the average batch correction scores and bioconservation scores across all methods. (B) Bar plot of the overall batch correction scores and bioconservation scores across seven cross-phylum tasks. (C and D) Line plot of the overall scores (C) and bioconservation scores (D) for the integration of Homo sapiens and Macaque fascicularis, Homo sapiens and Mus musculus, Homo sapiens and Sus scrofa, Homo sapiens and Danio rerio, Homo sapiens and Octopus vulgaris, Homo sapiens and Schmidtea mediterranea from left to right, respectively.
Figure 5.
Figure 5.
Benchmarking results for integration tasks involving time series, nested batches and imbalanced datasets. (A) UMAP plot of the time trajectory of the embryo development data of zebrafish and frog (cross-class integration task). (B) Bar plot of the overall batch correction scores and the overall bioconservation score in Homo sapiens and Mus musculus integration with nested batches task. (C) Line plot for the overall bioconservation score in integrating 60 399 cells from sea urchin (Strongylocentrotus purpuratus) and different subsample percentage of the zebrafish (Danio rerio, total 1 082 680 cells) dataset. Subsample 6% from the zebrafish dataset is the balanced data size with the sea urchin dataset.
Figure 6.
Figure 6.
Unrooted cell type trees for cat and dog lung tissue and seven phylogenetically distant species separately. (A) Seven cell types from cat and dog cluster in the cell phylogeny based on the integrated embedding derived from SATURN. (B) Forty-five cell types from seven model species (Schmidtea mediterranea, Danio rerio, Ciona intestinalis, Mus musculus, Homo sapiens, Drosophila melanogaster and Caenorhabditis elegans) cluster in the cell phylogeny based on the integrated embedding derived from SATURN. Species and cell types are labeled at the tips. Node support values are printed as ‘jumble score/scjackknife score’. MYA: million years ago.
Figure 7.
Figure 7.
Overall performance of all methods and a guideline in cross-species scRNA-seq data integration tasks. (A) Scatter plot of the average overall batch correction score against average overall bioconservation score for the selected methods based on 36 integration tasks. Dashed lines indicate the average scores across all the methods. (B) The average overall scores and ranking of all methods in different cross-species integration tasks. (C) Scenario-specific decision-tree-style guidelines for cross-species scRNA-seq data integration.

Similar articles

References

    1. Briggs J.A., Weinreb C., Wagner D.E., Megason S., Peshkin L., Kirschner M.W., Klein A.M. The dynamics of gene expression in vertebrate embryogenesis at single-cell resolution. Science. 2018; 360:eaar5780. - PMC - PubMed
    1. Cao C., Lemaire L.A., Wang W., Yoon P.H., Choi Y.A., Parsons L.R., Matese J.C., Levine M., Chen K. Comprehensive single-cell transcriptome lineages of a proto-vertebrate. Nature. 2019; 571:349–354. - PMC - PubMed
    1. Fincher C.T., Wurtzel O., de Hoog T., Kravarik K.M., Reddien P.W. Cell type transcriptome atlas for the planarian Schmidtea mediterranea. Science. 2018; 360:eaaq1736. - PMC - PubMed
    1. Hu M., Zheng X., Fan C.-M., Zheng Y. Lineage dynamics of the endosymbiotic cell type in the soft coral Xenia. Nature. 2020; 582:534–538. - PMC - PubMed
    1. Wagner D.E., Weinreb C., Collins Z.M., Briggs J.A., Megason S.G., Klein A.M. Single-cell mapping of gene expression landscapes and lineage in the zebrafish embryo. Science. 2018; 360:981–987. - PMC - PubMed