Practice Guideline
. 2025 Jan 8;13(1):e008875.
doi: 10.1136/jitc-2024-008875.

Society for Immunotherapy of Cancer: updates and best practices for multiplex immunohistochemistry (IHC) and immunofluorescence (IF) image analysis and data sharing

Affiliations
Practice Guideline

Society for Immunotherapy of Cancer: updates and best practices for multiplex immunohistochemistry (IHC) and immunofluorescence (IF) image analysis and data sharing

Janis M Taube et al. J Immunother Cancer. .

Abstract

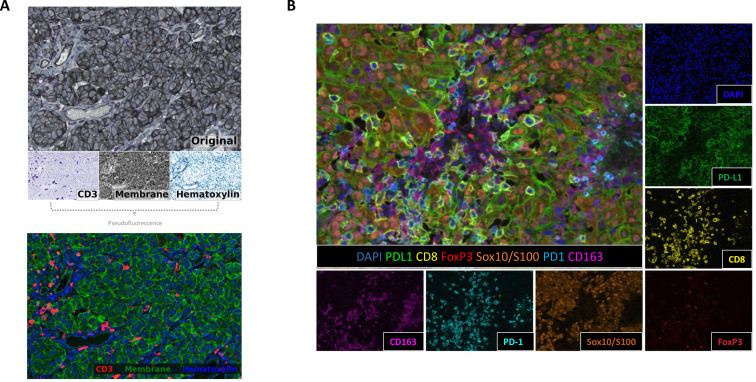
Objectives: Multiplex immunohistochemistry and immunofluorescence (mIHC/IF) are emerging technologies that can be used to help define complex immunophenotypes in tissue, quantify immune cell subsets, and assess the spatial arrangement of marker expression. mIHC/IF assays require concerted efforts to optimize and validate the multiplex staining protocols prior to their application on slides. The best practice guidelines for staining and validation of mIHC/IF assays across platforms were previously published by this task force. The current effort represents a complementary manuscript for mIHC/IF analysis focused on the associated image analysis and data management.

Methods: The Society for Immunotherapy of Cancer convened a task force of pathologists and laboratory leaders from academic centers as well as experts from pharmaceutical and diagnostic companies to develop best practice guidelines for the quantitative image analysis of mIHC/IF output and data management considerations.

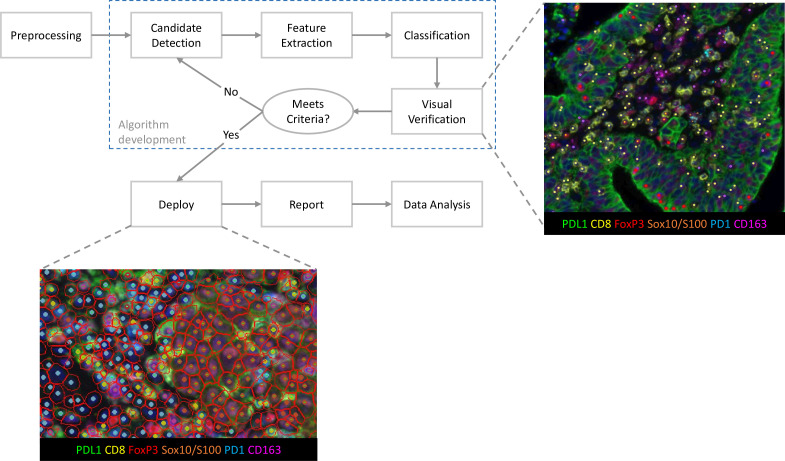
Results: Best-practice approaches for image acquisition, color deconvolution and spectral unmixing, tissue and cell segmentation, phenotyping, and algorithm verification are reviewed. Additional quality control (QC) measures such as batch-to-batch correction and QC for assembled images are also discussed. Recommendations for sharing raw outputs, processed results, key analysis programs and source code, and representative photomicrographs from mIHC/IF assays are included. Lastly, multi-institutional harmonization efforts are described.

Conclusions: mIHC/IF technologies are maturing and are routinely included in research studies and moving towards clinical use. Guidelines for how to perform and standardize image analysis on mIHC/IF-stained slides will likely contribute to more comparable results across laboratories and pave the way for clinical implementation. A checklist encompassing these two-part guidelines for the generation of robust data from quantitative mIHC/IF assays will be provided in a third publication from this task force. While the current effort is mainly focused on best practices for characterizing the tumor microenvironment, these principles are broadly applicable to any mIHC/IF assay and associated image analysis.

Keywords: Education; Immunotherapy; Pathology; Tumor microenvironment - TME.


Conflict of interest statement

Competing interests: JT—Contracted research: Bristol Myers Squibb, Akoya Biosciences; Consulting fees: Bristol Myers Squibb, Roche/Genentech, Merck, AstraZeneca, Regeneron, Lunaphore, Akoya Biosciences, Compugen; Stock holdings: Akoya Biosciences; JCS—Contracted research: Palleon Pharmaceuticals; MA—Consulting fees: Ionpath; Royalties: Ionpath; GA—Salary and employment: Merck; LLE—Royalties: Akoya Biosciences; CSF—Salary and employment: Roche; Stock ownership: Roche; BG—Consulting fees: Rome Therapeutics, PMV Pharma, Merck; Contracted research: Bristol Myers Squibb; IP rights: Rome Therapeutics; SGn—Contracted research: Regeneron, Boehringer Ingelheim, Janssen R&D, Genentech, Takeda, Bristol Myers Squibb, Celgene; Patents: Named coinventor on an issued patent for multiplex immunohistochemistry to characterize tumors and treatment responses, filed through Icahn School of Medicine at Mount Sinai (ISMMS) and currently unlicensed; CVH—Consulting fees: PathAI; TJH—Salary and employment (current): Bristol Myers Squibb; KK—Salary and employment: F. Hoffman-La Roche AG; AL—Salary and employment: Bristol Myers Squibb; Stock holdings; Bristol Myers Squibb; ERP—Consulting fees: Nucleai, iTeos Belgium SA; MCR—Salary and employment: AstraZeneca; DLR—Consulting fees: AstraZeneca, Cell Signaling Technology, Cepheid, Danaher, Daiichi Sankyo, NextCure, Paige.AI, Regeneron, Sanofi; Royalties: RareCyte; SJR—Consulting fees: Immunitas Therapeutics; Contracted research: Bristol Myers Squibb, Kite/Gilead; JR-C—Salary and employment: Daiichi Sankyo; KAS—Consulting fees: Shattuck Labs, EMD Serono, Clinica Alemana de Santiago, Genmab, Takeda, Merck Sharp & Dohme, Bristol Myers Squibb, AstraZeneca, Agenus, Repertoire; Fees for non-CE services: Bristol Myers Squibb, Fluidigm Corporation, Genmab, Merck, Takeda; Contracted research: Navigate BioPharma, Tesaro/GSK, Moderna, Pierre Fabre, Takeda, Surface Oncology, Merck Sharp & Dohme, Bristol Myers Squibb, AstraZeneca, Ribon Therapeutics, Akoya Biosciences, Boehringer Ingelheim, Eli Lilly; ES—Salary and employment: AstraZeneca; KES—Salary, employment, and ownership: SR Pathology LLC; MJS—Salary and employment: AstraZeneca; Stock holdings: AstraZeneca; IIW—Consulting fees: Genentech/Roche, Bayer, Bristol Myers Squibb, AstraZeneca, Pfizer, Merck, Guardant Health, Flame, Novartis, Sanofi, Daiichi Sankyo, Amgen, Jansen, Merus, AbbVie, Catalyst Therapeutics, Regeneron, Oncocyte; Contracted research; Genentech, Merck, Bristol Myers Squibb, MedImmune, Adaptive, Adaptimmune, EMD Serono, Pfizer, Takeda, Amgen, Karus, Johnson & Johnson, Bayer, Iovance, 4D, Novartis, Akoya; JHY—Salary and employment: Merck; CBB—Ownership: PrimeVax; Consulting fees: Sanofi, Agilent, Roche, Incendia, PrimeVax, BioAI, Lunaphore; Contracted research: Illumina; ME, SGr, NFG, DJ-S, JSR, MTT, ASS—Nothing to disclose; SITC Staff: BL, HS—Nothing to disclose.

Figures

Figure 1
Figure 1. Overview slide scan of an mIF stained slide showing different HPF/ROI sampling strategies for image acquisition and subsequent analysis. (A) A 10× resolution overview slide scan from an advanced stage melanoma specimen taken by a Vectra multispectral microscope. The background lymph node and TIL appears as light blue–green surrounding the periphery of the tumor nodule. (B) Representative photomicrograph generated in Python showing HPF/ROI selection targeting “hot spots” with high CD8+T cell density, located here at the tumor-stromal interface. These HPFs can then be acquired (often at higher resolution) and studied in detail. (C) Representative photomicrograph showing sampling of the TME with fields deliberately chosen across both the central and more peripheral regions of the tumor nodule as well as areas with and without a prominent immune cell infiltrate. The aim of this sampling strategy is to capture the potential heterogeneity of the TME. (D) An example of a high resolution HPF taken with a Vectra multispectral microscope that can be used for further downstream analysis. The displayed HPF was generated in Python using an unmixed component image exported from inForm. HPF, high-power field; PD-1, programmed cell death protein-1; PD-L1, programmed death-ligand 1; ROI, region of interest; TIL, tumor-infiltrating lymphocyte; TME, tumor microenvironment.
Figure 2
Figure 2. mIHC/IF images contain multiple color vectors that can be separated. (A) mIHC image separated into its three individual color vectors using color deconvolution. Most deconvolution methods are derived from Ruifrok and Johnston, and several open-source tools are available for this purpose. In this case, the image was deconvoled with the automatic color vector estimation tool in the QuPath image analysis platform. Additionally, mIHC images may also be transformed into pseudofluorescent representations, as demonstrated in the bottom panel, which was generated from the images in the top panel. (B) mIF image from a Vectra multispectral microscope of a 6-marker panel plus DAPI. The individual signals are separated by a combination of band-pass filters and unmixing algorithms that capitalize on the emission spectra of each individual fluorophore for isolation. In this example, inForm was used to unmix the individual signals and generate the displayed composite and single channel images. DAPI, 4’6-diamidino-2-phenylindole; IF, immunofluorescence; mIHC, multiplex immunohistochemistry; PD-1, programmed cell death protein-1; PD-L1, programmed death-ligand 1.
Figure 3
Figure 3. Tissue segmentation, cell segmentation, and pixel-based analysis. (A) Representative photomicrograph illustrating tissue segmentation, that is, selection, of the entire tissue area on the slide (red line). This example of tissue segmentation was performed using the Simple Detection tool in the open-source QuPath image analysis platform. (B) An image from a melanoma biopsy stained with DAPI (blue) and a cocktail of CD44/CD45/ATPase to identify cell membranes (white stain). The image was taken using a Vectra multispectral microscope, unmixed with inForm, and the image for display was rendered using Python. The component layers were then passed to the pretrained Mesmer algorithm, and the resultant cell segmentation is shown on the right (red lines indicate boundaries of individual cell membranes). (C) Non-segmented mIF image divided into patches of pixels that can be studied for expression patterns across numerous pixels within the patches. The arrow points to a representative patch, displayed as a heat map of pixel confidence values generated by passing the image patches into the NaroNet algorithm. Confidence reflects the impact of each individual pixel on the machine learning model’s prediction of patient outcome. DAPI, 4’6-diamidino-2-phenylindole; mIF, multiplex immunofluorescence.
Figure 4
Figure 4. Flowchart illustrating the iterative approach typical for development of a phenotyping algorithm. Representative photomicrographs from a Vectra multispectral microscope showing visualizations of algorithm performance. Typically phenotyping or cell classification algorithms are initially developed on a small subset of data using interactive software, for example, the algorithm for the displayed images was generated in inForm. Once trained, the algorithm can be applied to a larger data set, and visual verification should be performed on this larger subset. In the visual verification example on the right, from a non-small cell lung biopsy and generated in MATLAB using the QC module from Merge a Single Sample (MaSS): the pathologist is presented with a selection of HPFs where algorithm-detected objects are already marked with overlays. The different colored points represent each identified phenotype. The pathologist then evaluates whether the phenotype classification meets an acceptable criteria. If the algorithm fails, adjustments are made to address any missed objects and/or false detections. The revised algorithm is then reprocessed to generate a corrected score which is compared with the original algorithm output. Following final algorithm deployment, identified cells and structures, for example, boundaries, are described by Cartesian coordinates, which form the basis of the output report for data analysis. The photomicrograph in the bottom left, from an advanced melanoma and generated in MATLAB, displays a representation of this final output with red lines showing cell membranes and small dots overlaid to represent the phenotype algorithm output. PD-1, programmed cell death protein-1; PD-L1, programmed death-ligand 1; QC, quality control.
Figure 5
Figure 5. Annotation tools may be used to help select regions of the TME for either inclusion or exclusion in subsequent analysis. (A) The blue line outlines a tumor nodule, in this example the annotation was generated using HALO. Image analysis tools enable the expansion of this annotation at predetermined increments, for example, 50 µm, facilitating a standardized and reproducible approach to characterizing the peritumoral zone. (B) Regions may also be excluded from analysis. In this representative photomicrograph of a skin biopsy stained with a mIF assay and imaged with a Vectra multispectral microscope, invasive melanoma tumor nodules have been annotated (green line) using HALO. The yellow line delineates the TME regions included in the final analysis, deliberately excluding any in situ melanoma in the overlying epidermis, which was the a priori study design. mIF, multiplex immunofluorescence; TME, tumor microenvironment.
Figure 6
Figure 6. Serial section images can be registered and analyzed as though the stains were performed in mIHC/IF on a single slide. (A) IHC for three different markers was performed on sequential slides, which were scanned using a Hamamatsu NanoZoomer digital slide scanner. The images were then registered to each other in a Z-stack using HALO. Image courtesy of Dr Nicolas Giraldo. (B) The individual images can then be merged into a multicomponent image for further analysis using mIHC/IF tools. The MATLAB-generated photomicrograph overlay shows cell geometries colored by phenotype, with dots indicating PD-1 (blue) or PD-L1 (green). Dot size represents PD-1 and PD-L1 expression levels, and lines indicate PD-1+and PD-L1+cells within 20 µm of each other in this proximity analysis. IF, immunofluorescence; mIHC, multiplex immunohistochemistry; PD-1, programmed cell death protein-1; PD-L1, programmed death-ligand 1.

References

    1. Yuan J, Hegde PS, Clynes R, et al. Novel technologies and emerging biomarkers for personalized cancer immunotherapy. j immunotherapy cancer. 2016;4:3. doi: 10.1186/s40425-016-0107-3. - DOI - PMC - PubMed
    1. Masucci GV, Cesano A, Hawtin R, et al. Validation of biomarkers to predict response to immunotherapy in cancer: Volume I — pre-analytical and analytical validation. j immunotherapy cancer. 2016;4:76. doi: 10.1186/s40425-016-0178-1. - DOI - PMC - PubMed
    1. Gnjatic S, Bronte V, Brunet LR, et al. Identifying baseline immune-related biomarkers to predict clinical outcome of immunotherapy. j immunotherapy cancer. 2017;5:44. doi: 10.1186/s40425-017-0243-4. - DOI - PMC - PubMed
    1. Halse H, Colebatch AJ, Petrone P, et al. Multiplex immunohistochemistry accurately defines the immune context of metastatic melanoma. Sci Rep. 2018;8:11158. doi: 10.1038/s41598-018-28944-3. - DOI - PMC - PubMed
    1. Hu C, Dignam JJ. Biomarker-Driven Oncology Clinical Trials: Key Design Elements, Types, Features, and Practical Considerations. JCO Precis Oncol. 2019;3:1–12. doi: 10.1200/PO.19.00086. - DOI - PMC - PubMed

Publication types

MeSH terms

LinkOut - more resources