. 2025 Mar 24;6(2):zqaf001.
doi: 10.1093/function/zqaf001.

Aryl Hydrocarbon Receptor Activation Promotes Effector CD4+ T Cell Homeostasis and Restrains Salt-Sensitive Hypertension

Affiliations

Aryl Hydrocarbon Receptor Activation Promotes Effector CD4+ T Cell Homeostasis and Restrains Salt-Sensitive Hypertension

Patrick A Molina et al. Function (Oxf). .

Abstract

Excess dietary salt and salt-sensitivity contribute to cardiovascular disease. Distinct T cell phenotypic responses to high salt and hypertension, as well as influences from environmental cues, are not well understood. The aryl hydrocarbon receptor (AhR) is activated by dietary ligands, promoting T cell and systemic homeostasis. We hypothesized that activating AhR supports CD4+ homeostatic functions, such as cytokine production and mobilization, in response to high salt intake while mitigating salt-sensitive hypertension. In the intestinal mucosa, we demonstrate that a high-salt diet (HSD) is a key driving factor, independent of hypertension, in diminishing interleukin 17A (IL-17A) production by CD4+ T (Th17) cells without disrupting circulating cytokines associated with Th17 function. Previous studies suggest that hypertensive patients and individuals on a HSD are deficient in AhR ligands or agonistic metabolites. We found that activating AhR augments Th17 cells during experimental salt-sensitive hypertension. Further, we demonstrate that activating AhR in vitro contributes to sustaining Th17 cells in the setting of excess salt. Using photoconvertible Kikume Green-Red mice, we also revealed that HSD drives CD4+ T cell mobilization. Next, we found that excess salt augments T cell mobilization markers, validating HSD-driven T cell migration. Also, we found that activating AhR mitigates HSD-induced T cell migration markers. Using telemetry in a model of experimental salt-sensitivity, we found that activating AhR prevents the development of salt-sensitive hypertension. Collectively, stimulating AhR through dietary ligands facilitates immunologic and systemic functions amid excess salt intake and restrains the development of salt-sensitive hypertension.

Keywords: Th17; aryl hydrocarbon receptor; blood pressure; high-salt diet; salt-sensitive hypertension.


Conflict of interest statement

DMP holds the position of editor-in-chief of FUNCTION and is blinded from reviewing or making decisions for the manuscript.

Figures

Graphical Abstract
Graphical Abstract
AhR ligand in the presence of high salt diet chow increases colonic homeostatic Th17 cells as well as restrains salt-sensitive hypertension.
Figure 1.
Figure 1.
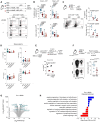
High-salt diet (HSD), independent of hypertension, depresses CD4+ T cell cytokine expression. (A) Experimental schematic outlining salt-sensitive model with representative FACS plots identifying IL-17A and IL-22 produced by CD4+ T cells. Numbers within quadrants indicate frequency among CD4+ T cells. (B) IL-17A and IL-22 cytokine frequencies among CD4+ T cells and absolute numbers. (C) Experimental scheme outlining 5 weeks of HSD feeding, analysis of IL-17A and IL-22-expressing effector T cells among colonic lamina propria lymphocytes (cLPL) in mice fed 5 weeks of normal salt diet (NSD) or HSD. (D) Circulating cytokine concentrations from NSD-fed mice, HSD-fed mice, NSD-fed salt sensitive mice, and HSD-fed salt-sensitive mice. (E) Experimental schematic outlining naïve CD4+ T cell sorting from mice fed a NSD or salt-sensitive mice fed HSD followed by Th17 in vitro polarization and frequency among polarized CD4+ T cells. Polarizing cells were re-stimulated with PMA/Ionomycin followed by cytokine sequestration with brefeldin. (F) Experimental schematic to evaluate the effect of in vivo HSD feeding on Peyer’s patches Th17 cells, representative FACS plots of CD4+ T cells showing staining for CD44 and fm/eYFP signal, and absolute cell count. (G) Volcano plot with mean log2-transformed fold change (x-axis) and significance (−log10(adjusted P-value)) of differentially expressed genes (DEGs, DESeq2 analysis) among isolated human CD4+ T cells polarized under Th17 conditions in the presence of high salt vs normal salt media (data downloaded from Gene Expression Omnibus, GSE1486696). (H) Gene ontology biological process pathway enrichment analysis with ClusterProfiler showing significantly enriched gene sets among isolated human CD4+ T cells polarized under Th17 conditions in the presence of high salt vs normal salt media (data downloaded from Gene Expression Omnibus, GSE1486696). ns, not significant (> .05); *P  formula image .05; **P  formula image .01; ***P  formula image .001; ****P  formula image .0001; two-way ANOVA (B, C, E) and Student’s two-tailed t-test (D and F). Volcano plot of RNA analysis with log2-transformed fold change and (−log10(adjusted P-value)) (G) and gene ontology analysis among human Th17 cells treated with HS-to-NS (H).
Figure 2.
Figure 2.
Aryl hydrocarbon receptor (AhR) activation promotes Th17 expansion during excess salt intake and exposure. (A) Experimental schematic for Th17 analysis in high-salt diet (HSD)-fed and HSD + I3C (indole-3-carbinol) fed mice. (B) Absolute cell numbers among Peyer’s patch CD4+ T cells from salt-sensitive mice fed a HSD or HSD with I3C for 2 weeks. (C) Experimental scheme for naive CD4+  in vitro polarizations evaluating Th17 differentiation under vehicle (DMSO), high salt + vehicle, high salt with FICZ (AhR activator), or mannitol. (D) Representative FACS plots with respective frequency data for Th17 differentiation under homeostatic and pathogenic conditions for cells treated under vehicle (DMSO), high salt + vehicle, high salt + FICZ, or mannitol + vehicle. Polarizing cells were re-stimulated with PMA/Ionomycin followed by cytokine sequestration with brefeldin. (E) Experimental schematic evaluating in vitro IL-17Afm/eYFP expression during Th17 differentiation with vehicle (DMSO), high salt + vehicle, or high salt with FICZ (AhR activator) under homeostatic and pathogenic polarizing conditions. Polarizing cells were re-stimulated with PMA/Ionomycin followed by cytokine sequestration with brefeldin. ns, not significant (> .05); *P  formula image .05; **P  formula image .01; ***P  formula image .001; ****P  formula image .0001; Student’s two-tailed t-test (B) and two-way ANOVA (D and F).
Figure 3.
Figure 3.
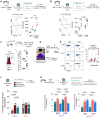
Activating aryl hydrocarbon receptor (AhR) regulates features of mobilization induced by high-salt diet (HSD) in CD4+ T cells. (A) Experimental scheme for naïve CD4+ T cells isolated from normal salt diet (NSD)-fed or HSD-fed salt-sensitive mice followed by polarization under TGFformula image + IL-6 differentiation conditions. CXCR3 median fluorescence intensity (MFI) analysis on polarizing IL-17A+ CD4+ T cells with and without additional 40 mm NaCl from NSD-fed and HSD-fed salt-sensitive mice. (B) Experimental scheme for naïve CD4+ T cells isolated from NSD-fed or HSD-fed mice followed by polarization under TGFformula image + IL-6 differentiation conditions. CCR6 MFI analysis on polarizing IL-17A+ CD4+ T cells with and without additional 40 mm NaCl from NSD-fed and HSD-fed salt-sensitive mice. (C) Experimental scheme for analysis of CXCR3 frequency and MFI among Th17 fate cells from the Peyer’s patches of NSD-fed or HSD-fed mice. (D) Diagram for experimental approach to photoconvert intestinal tissue from KikGR mice using a 405 nm light and experimental scheme for KikRed+CD4+ T cells frequency among the mesenteric lymph nodes (mLN), colonic lamina propria lymphocytes (cLPL), and pooled caudal/iliac lymph nodes (c/iLN) from KikGR mice fed either a NSD or HSD. (E) Representative gating and analysis of KikRed+CD4+ T cell frequency among mLN, cLPL, and c/iLNs from KikGR mice fed a NSD or HSD. (F) Experimental scheme for polarization of wild-type naïve CD4 + T cells polarized under homeostatic or pathogenic Th17 conditions treated with vehicle (DMSO), high salt + vehicle, or high salt with FICZ (AhR activator). CXCR3 frequency among IL-17A+ CD4+ T cells was analyzed to determine regulation of CXCR3 expression in response to high salt or high salt + AhR activator (FICZ) under homeostatic or pathogenic Th17 conditions. (G) Experimental scheme for polarization of wild-type naïve CD4+ T cells from mice fed 2 weeks of NSD or HSD followed by homeostatic (TGFβ + IL-6) or pathogenic (IL-6 + IL-23 + IL-1β) conditions with either vehicle, high salt + vehicle, or high salt + FICZ. Frequency of CCR6 expression of total CD4+ T cells was analyzed to determine effect of salt and AhR activation on CCR6 regulation. ns, not significant (> .05); *P  formula image .05; **P  formula image .01; ***P  formula image .001; ****P  formula image .0001; Two-way ANOVA (A, B, F, and G) and Student’s two-tailed t-test or Mann–Whitney U-test (C and E).
Figure 4.
Figure 4.
Aryl hydrocarbon receptor (AhR) activation restrains the development of experimental salt-sensitive hypertension. (A) Experimental scheme for analysis and legend showing groups of mice with implanted telemeters fed either HSD or HSD + AhR activator (I3C). Mice were implanted with telemeters, allowed to recover for at least 10-days followed by day-night analysis of mean arterial, systolic, and diastolic blood pressure recordings between baseline and paired HSD-fed mice or HSD + AhR activator (I3C)-fed mice during final 3-days of experimental protocol. (B) Analysis of day and night (shaded area) mean arterial pressure (MAP, mmHg) showing comparison of baseline (pre-L-NAME) with HSD-fed and HSD+AhR activator (I3C)-fed mice. (C) MAP tracing averages for final 72 h analysis of MAP final 3-day (day and night) average between HSD-fed (higher MAP) and HSD + AhR activator (I3C)-fed mice. (D) Analysis of day and night systolic blood pressure (SBP, mmHg) showing comparison of baseline (pre-L-NAME) with HSD-fed and HSD+AhR activator (I3C)-fed mice. (E) SBP tracing averages for final 72 h analysis of the final 3-day (day and night) average between HSD-fed (higher SBP) and HSD + AhR activator (I3C)-fed mice. (F) Analysis of day and night diastolic blood pressure (DBP, mmHg) showing comparison of baseline (pre-L-NAME) with HSD-fed and HSD+AhR activator (I3C)-fed mice. (G) DBP tracing averages for final 72 h analysis of MAP final 3-day (day and night) average between HSD-fed (higher DBP) and HSD + AhR activator (I3C)-fed mice. (H) Analysis of day and night heart rate (HR, bpm) showing comparison of baseline (pre-L-NAME) with HSD-fed and HSD+AhR activator (I3C)-fed mice. (I) HR tracing averages for final 72 h analysis of MAP final 3-day (day and night) average between HSD-fed and HSD + AhR activator (I3C)-fed mice. Paired Two-way ANOVA (B–I).

References

    1. Yoon H, Cai Q, Yang JJ et al. Sodium intake and cause-specific mortality among predominantly low-income black and white US residents. JAMA Netw Open. 2024;7(3):e243802. - PMC - PubMed
    1. Cook NR, Appel LJ, Whelton PK. Sodium intake and all-cause mortality over 20 years in the trials of hypertension prevention. J Am Coll Cardiol. 2016;68(15):1609–1617. - PMC - PubMed
    1. Zhou D, Xi B, Zhao M et al. Uncontrolled hypertension increases risk of all-cause and cardiovascular disease mortality in US adults: the NHANES III Linked Mortality Study. Sci Rep. 2018;8(1):9418. - PMC - PubMed
    1. Zhou B, Perel P, Mensah GA, Ezzati M. Global epidemiology, health burden and effective interventions for elevated blood pressure and hypertension. Nat Rev Cardiol. 2021;18(11):785–802. - PMC - PubMed
    1. Lerman LO, Kurtz TW, Touyz RM et al. Animal Models of Hypertension: a scientific statement from the American Heart Association. Hypertension. 2019;73(6):e87–e120. - PMC - PubMed

MeSH terms

LinkOut - more resources