. 2025 Feb 26;45(9):e1072242024.
doi: 10.1523/JNEUROSCI.1072-24.2024.

Cortex-Specific Tmem169 Deficiency Induces Defects in Cortical Neuron Development and Autism-Like Behaviors in Mice

Affiliations

Cortex-Specific Tmem169 Deficiency Induces Defects in Cortical Neuron Development and Autism-Like Behaviors in Mice

Junhao Wang et al. J Neurosci. .

Abstract

The development of the nervous system is a complex process, with many challenging scientific questions yet to be resolved. Disruptions in brain development are strongly associated with neurodevelopmental disorders, such as intellectual disability and autism. While the genetic basis of autism is well established, the precise pathological mechanisms remain unclear. Variations on chromosome 2q have been linked to autism, yet the specific genes responsible for the disorder have not been identified. This study investigates the role of the transmembrane protein 169 (TMEM169) gene, located on human chromosome 2q35, which has not been previously characterized. Our findings indicate that Tmem169 is highly expressed in the nervous system, and its deletion in the male mouse dorsal forebrain results in neuronal morphological abnormalities and synaptic dysfunction. Notably, Tmem169-deficient mice, irrespective of sex, display behavioral traits resembling those observed in individuals with autism. These results suggest that Tmem169 interacts with several key neuronal proteins, many of which are implicated in neurodevelopmental diseases. Furthermore, we demonstrate that Tmem169 promotes neuronal process and synapse development through its interaction with Shank3.

Keywords: Shank3; Tmem169; autism; brain development; neurodevelopmental disease.


Conflict of interest statement

The authors declare no competing financial interests.

Figures

Figure 1.
Figure 1.
Tmem169 expression is increased during neuronal differentiation. A, Tmem169 expression in various tissues generated by the Mouse ENCODE project (https://www.ncbi.nlm.nih.gov/gene/271711/?report=expression). B, Transcriptomic data of Tmem169 in various cell lines as generated by the ProteomicsDB database (https://www.proteomicsdb.org/protein/76746/expression). C, Real-time PCR shows the expression pattern of Tmem169 mRNA in the various tissues, n = 3 independent samples, normalized to GAPDH and relative to levels of forebrain, one-way ANOVA with Bonferroni's multiple-comparisons test. D, Left panel, Immunoblot analysis of Tmem169 protein expression in various tissues. Right panel, quantification indicates relatively higher Tmem169 level in the mouse brain, n = 3 independent samples, one-way ANOVA with Bonferroni's multiple-comparisons test. E, Real-time PCR shows increased expression of Tmem169 mRNA during P19 cell neuronal differentiation, n = 3 independent samples, normalized to GAPDH and relative to levels of RA0 (the text “NB” under the statistical graph refers to the neuronal differentiation medium Neurobasal + B27, and the numbers following it indicate the number of days the cells have undergone neural differentiation), one-way ANOVA with Bonferroni's multiple-comparisons test. F, Left panel, Immunoblot analysis of Tmem169 expression during P19 cell neuronal differentiation (OE, overexpression). Right panel, Quantification indicates increased expression of Tmem169 during P19 cell neuronal differentiation from three independent experiments, one-way ANOVA with Bonferroni's multiple-comparisons test. G, Left panel, Immunoblot analysis of Tmem169 expression during SH-SY5Y cell neuronal differentiation. Right panel, quantification indicates increased expression of TMEM169 during SH-SY5Y cell neuronal differentiation, n = 3 independent samples, one-way ANOVA with Bonferroni's multiple-comparisons test. H, Real-time PCR shows increased expression of Tmem169 mRNA during neural stem cell neuronal differentiation, n = 3 independent samples, normalized to GAPDH and relative to levels of NSC (The label “NSC-differentiation” on the statistical graph refers to the differentiation of NSCs in neuronal differentiation medium (DMEM/F12 supplemented with 2% B27 and 1 μM ATRA). The numbers following the label indicate the number of days the cells were subjected to neuronal differentiation), one-way ANOVA with Bonferroni's multiple-comparisons test. I, Real-time PCR shows the expression of Tmem169 mRNA in cultured neural stem cells and cortical neurons dissociated from E16 embryonic mouse cortex, n = 3 independent samples, normalized to Gapdh and relative to levels of NSC [the label “Neuron” below the statistical graph refers to neurons isolated from the cortex of E16 mice; the number following the label indicates the number of days the neurons underwent neural differentiation in neuronal differentiation medium (Neurobasal + B27)], one-way ANOVA with Bonferroni's multiple-comparisons test. J, Left panel, Immunoblot analysis of Tmem169 expression in cultured neural stem cells, astrocytes, and cortical neurons. Right panel, Quantification indicates higher Tmem169 expression in cortical neurons compared with the other cell types, n = 3 independent samples, one-way ANOVA with Bonferroni's multiple-comparisons test. K, Left panel, Immunoblot analysis of Tmem169 expression in the cell membrane and cytoplasm. Right panel, Quantification demonstrates higher Tmem169 expression in the cell membrane than in the cytoplasm, n = 3 independent samples, unpaired t test. L, Immunofluorescence analysis of primary cortical neurons shows expression of Tmem169 in Map2-positive dendrites and Tau-Positive axons. All data were presented as means ± SEM. *p < 0.05, **p < 0.01, and ***p < 0.001. The information on the primers used is provided in Extended Data Table 1-1.
Figure 2.
Figure 2.
Process morphological deficit and synaptic impairment in Tmem169−/− brains. A, Top images, Coronal sections from E16 and P0 Tmem169−/− mice and control littermates were stained with Tuj1 antibody; scale bar, 25 µm. Bottom images, Magnified images of the areas highlighted by the white boxes in each of the images above. B, Top images, Coronal sections from E16 and P0 Tmem169−/− mice and control littermates were stained with Map2 antibody; scale bar, 25 µm. Bottom images, Magnified images of the areas highlighted by the white boxes in each of the images above. C, Left panel, Tuj1 immunofluorescent staining displaying the morphology of primary cortical neurons dissociated from WT and Tmem169−/− mice cortex at E16; scale bar, 50 µm. Middle panel, Representative traces of single neurites shown in the left images. Right panel, Quantification indicates decreased neurite length in the neurons of Tmem169−/− mice. 48 h postplating, Tuj1-positive cells harboring processes longer than two cell-body diameters were scored as neurons with neurites. At least 150 cells for each group were analyzed using an unpaired t test. D, Left panel, Representative images of Golgi-Cox–stained cortical sections from 2-month-old control and Tmem169−/− mice; scale bar, 20 µm. Right panel, Quantification indicates decreased neurite length in Tmem169−/− mice. Stained cells with apical dendrite longer than two cell-body diameters were measured. At least 120 cells from three animals per group were analyzed using an unpaired t test. E, Left panel, Representative images of Golgi-Cox–stained apical dendrites in the cortex of 2-month-old control and Tmem169−/− mice; scale bar, 10 µm. Right panel, Quantification demonstrates decreased spine density on apical dendrites in Tmem169−/− mice. At least 90 cells from three animals per group were analyzed using an unpaired t test. F, Left panel, Representative images of Golgi-Cox–stained apical dendrites in the hippocampus of 2-month-old control and Tmem169−/− mice; scale bar, 10 µm. Right panel, Quantification demonstrates decreased spine density on apical dendrites in Tmem169−/− mice. At least 50 cells from three animals per group were analyzed using an unpaired t test. G, Top panel, Examples of electron micrographs representing synaptic contacts. Arrows indicate the postsynaptic density (PSD); scale bar, 100 nm. Bottom panel, Quantification demonstrate decreased PSD length (left) and PSD thickness (right) in 4-month-old control and Tmem169−/− mice. At least 170 PSDs from three animals per group were analyzed using an unpaired t test. H, Left panel, Representative images showing sEPSCs of pyramidal neurons from 2-month-old mice control (black) and Tmem169−/− mice (red) slice of the prefrontal cortex; calibration: 50 pA, 5 s. Quantifications of mEPSC mean amplitude (middle panel) and mean frequency (right panel). n = 11 for control and 9 for Tmem169−/− from three animals were analyzed using an unpaired t test. I, Left panel, Representative images showing evoked EPSCs in response to pairs of local stimulations at a 50 ms interpulse interval from 2-month-old mice control (black) and Tmem169−/− mice (red) slice of the prefrontal cortex; calibration: 50 pA, 50 ms. Right panel, Quantifications of paired-pulse ratio of local stimulations at various interpose intervals, n = 11 for control and 9 for Tmem169−/− from three animals were analyzed using an unpaired t test. J, Left and top right panel, Immunoblot analysis of several synaptic proteins from cerebral cortices of 2-month-old control and Tmem169−/− male mice. Bottom right panel: quantification of protein levels for J, n = 3 independent samples, unpaired t test. All data were presented as means ± SEM. *p < 0.05, **p < 0.01, and ***p < 0.001. See Extended Data Figures 2-1 and 2-3 for more details.
Figure 3.
Figure 3.
Tmem169−/− mice exhibit autistic-like behaviors. A, Left panel, Schematic diagram illustrating the social interaction behavior of control and Tmem169−/− adult mice. Right panel, Measurement of sociability in adult animals, represented by the time spent interacting with a novel mouse, n = 11 animals for each group, unpaired t test. B, Scheme of three-chamber test. C, Representative heatmaps of trajectory in Stage 2 and Stage 3 of three-chamber tests. D, Quantification of the time in each compartment during Stage 2, n = 9 animals per group, two-way ANOVA with Bonferroni's multiple-comparisons test. S1, Stranger mouse 1; M, middle compartment; E, empty cage. E, Quantification of the time spent interacting with the S1 and the empty wire cage during Stage 2, n = 9 animals per group, two-way ANOVA with Bonferroni's multiple-comparisons test. F, Quantification of the time in each compartment in Stage 3, n = 9 animals per group, two-way ANOVA with Bonferroni's multiple-comparisons test. S2, Stranger mouse 2. G, Quantification of the time spent interacting with the S1 mouse and the S2 mouse in stage 3, n = 9 animals per group, two-way ANOVA with Bonferroni's multiple-comparisons test. S2, Stranger mouse 2. H, Left panel, Representative diagram of buried marbles in each group. Right panel, Quantification demonstrates decreased marble burying in Tmem169−/− mice, n = 20 animals per group, unpaired t test. I, Quantification demonstrates increased time spent on self-grooming (left panel) and increased self-grooming frequency (right panel) during the 10 min free movement session, n = 19 animals per group, unpaired t test. J, Representative circuit diagrams (left panel) and heatmap (right panel) of the open field test from Tmem169−/− mice and controls. K–N, Quantitation of the total distance traveled (K), mean speed (L), time spent in the center zone (M), and the time in periphery (N) during the 5 min open field test, n = 24 animals per group, unpaired t test. O–Q, Quantitation of the proportion of the time spent in closed arm (O), open arms (P), and center (Q) in control and Tmem169−/− mice in the elevated plus maze test, n = 12 animals per group, unpaired t test. R, Assessment of nesting ability in Tmem169−/− mice and controls, n = 17 animals per group, unpaired t test. All data were presented as means ± SEM. *p < 0.05, **p < 0.01, and ***p < 0.001. See Extended Data Figure 3-1 for more details.
Figure 4.
Figure 4.
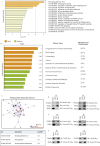
Tmem169 binds to proteins related to neurodevelopment and neurodevelopmental diseases. A, Bar graph of pathway and process enrichment of proteins pulled-down by Tmem169 using the Metascape online tool (http://metascape.org/gp/index.html#/main/step1). B, Analysis of diseases related to proteins pulled-down by Tmem169 using the GeneAnalytics program (https://geneanalytics.genecards.org/). C, Protein–protein interaction enrichment analysis of proteins pulled down by Tmem169 using the Metascape. The molecular complex detection (MCODE) networks identified from Tmem169 pulled-down proteins (upper) and pathway and process enrichment analysis of the three best-scoring terms by p value are shown in the tables underneath the network plot. D–F, Coimmunoprecipitation demonstrates the coprecipitation of Tmem169 with Shank3, Ube3A, and Cask. See Extended Data Figure 4-1, Table 1-1, and Table 4-1 for more details. *Notes: L1 functions in many aspects of neuronal development including axon outgrowth and neuronal migration. These functions require coordination between L1 and the actin cytoskeleton.
Figure 5.
Figure 5.
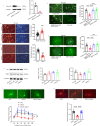
Tmem169 is required for neuronal process and synapse development. A, Left panel, Immunoblot analysis demonstrates Tmem169 specific shRNA is efficient to knockdown Tmem169. HEK293 cells were cotransfected with Tmem169 and shRNA, and total cell lysates were prepared for immunoblotting 48 h after transfection, n = 3 independent transfections. B, Left panel, Morphology of differentiated P19 cells infected with the indicated gene expression lentivirus; scale bar, 50 µm. Right panel, Quantification indicates increased neurite in Tmem169-infected cells at 48 h after P19 cell neuronal differentiation. Tuj1-positive cells with processes longer than two cell-body diameters were scored as neurons with neurites. At least 80 cells per group were quantified, unpaired t test. C, Left panel, Morphology of differentiated P19 cells infected with the indicated lentivirus; scale bar, 50 µm. Right panel, Quantification demonstrates decreased neurite length in Tmem169 shRNA lentivirus-infected cells at 72 h after P19 cell neuronal differentiation. At least 60 cells per group were quantified, unpaired t test. D, Left panel, Immunoblot analysis of neuronal marker Tuj1 and Map2 in differentiated P19 cells infected with the indicated gene expression or knockdown lentivirus. Quantification indicates unchanged levels of Tuj1 (middle panel) and Map2 (right panel) upon overexpression or knockdown of Tmem169, n = 3 independent samples, one-way ANOVA with Bonferroni's multiple-comparisons test. E, Left panel, Morphology of differentiated N2A cells infected with the indicated constructs; scale bar, 50 µm. Right panel, Quantification shows that knockdown of Tmem169 inhibits neurite development, which can be rescued by shank3 overexpression. GFP-positive cells with neurites longer than two cell-body diameters were scored. At least 20 cells per group were quantified, one-way ANOVA with Bonferroni's multiple-comparisons test. F, Left panel, Morphology of differentiated cortical neurons transfected with the indicated expression construct; scale bar, 50 µm. Right panel, Quantification shows that knockdown of Tmem169 inhibits neurite development, which can be rescued by shank3 overexpression at 48 h posttransfection. GFP-positive cells with neurites longer than two cell-body diameters were scored as neurons with neurites. At least 20 cells per group are quantified, one-way ANOVA with Bonferroni's multiple-comparisons test. G, Top panel, The process phenotype of cortical neurons, transfected with the indicated constructs at day in vitro 4 (DIV4), was analyzed after monitoring for GFP at DIV4 + 5; scale bar, 20 µm. Bottom panel, Quantification demonstrates a decreased number of process sections upon Tmem169 knockdown which can be rescued by shank3 overexpression, at least 15 cells per group were analyzed by the Sholl analysis, one-way ANOVA with Bonferroni's multiple-comparisons test. H, Top panel, The PSD95-Cherry puncta density, transfected with the indicated constructs at DIV4, was analyzed after monitoring for Cherry fluoresce at DIV4 + 3. Bottom panel, Quantification indicates a decreased number of PSD95 puncta upon Tmem169 knockdown which can be rescued by shank3 overexpression, at least 10 cells per group were analyzed, one-way ANOVA with Bonferroni's multiple-comparisons test. All data were presented as means ± SEM. *p < 0.05, **p < 0.01, ***p < 0.001. The information on the primers used is provided in Extended Data Table 1-1.
Figure 6.
Figure 6.
A proposed model illustrating the regulation of neuronal development by Tmem169 and its deficiency associated with ASD-like behavior. Within neurons, Tmem169 facilitates neuronal differentiation through interactions with vital neuronal proteins, including Shank3. The absence of Tmem169 significantly disrupts both normal neuronal development and the functionality of mature neurons, ultimately resulting in the manifestation of ASD-like behavior.

Similar articles

References

    1. Adhya D, et al. (2018) Atypical neurogenesis and excitatory-inhibitory progenitor generation in induced pluripotent stem cell (iPSC) from autistic individuals. bioRxiv, 349415.
    1. Anderson SW, Bechara A, Damasio H, Tranel D, Damasio AR (1999) Impairment of social and moral behavior related to early damage in human prefrontal cortex. Nat Neurosci 2:1032–1037. 10.1038/14833 - DOI - PubMed
    1. Ben-Hur A, Noble WS (2005) Kernel methods for predicting protein-protein interactions. Bioinformatics 21:i38–46. 10.1093/bioinformatics/bti1016 - DOI - PubMed
    1. Borg I, et al. (2002) A cryptic deletion of 2q35 including part of the PAX3 gene detected by breakpoint mapping in a child with autism and a de novo 2;8 translocation. J Med Genet 39:391–399. 10.1136/jmg.39.6.391 - DOI - PMC - PubMed
    1. Casas KA, Mononen TK, Mikail CN, Hassed SJ, Li S, Mulvihill JJ, Lin HJ, Falk RE (2004) Chromosome 2q terminal deletion: report of 6 new patients and review of phenotype-breakpoint correlations in 66 individuals. Am J Med Genet A 130A:331–339. 10.1002/ajmg.a.30156 - DOI - PubMed

MeSH terms

LinkOut - more resources