. 2025 Feb 26;45(9):e0393242024.
doi: 10.1523/JNEUROSCI.0393-24.2024.

Amyloid-β-Driven Synaptic Deficits Are Mediated by Synaptic Removal of GluA3-Containing AMPA Receptors

Affiliations

Amyloid-β-Driven Synaptic Deficits Are Mediated by Synaptic Removal of GluA3-Containing AMPA Receptors

Niels R Reinders et al. J Neurosci. .

Abstract

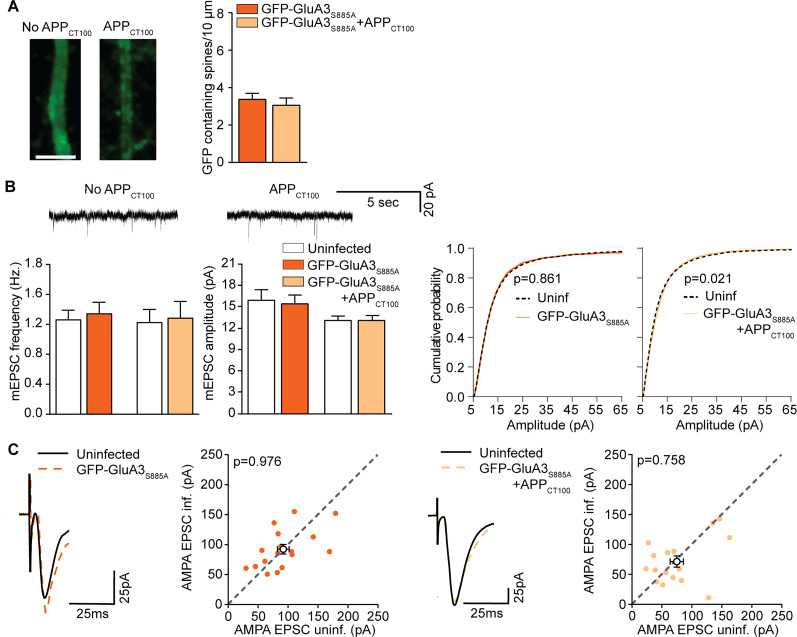
The detrimental effects of oligomeric amyloid-β (Aβ) on synapses are considered the leading cause for cognitive deficits in Alzheimer's disease. However, through which mechanism Aβ oligomers impair synaptic structure and function remains unknown. Here, we used electrophysiology and amino-3-hydroxy-5-methyl-4-isoxazolepropionic acid receptor (AMPAR) imaging on mouse and rat neurons to demonstrate that GluA3 expression in neurons lacking GluA3 is sufficient to resensitize their synapses to the damaging effects of Aβ, indicating that GluA3-containing AMPARs at synapses are necessary and sufficient for Aβ to induce synaptic deficits. We found that Aβ oligomers trigger the endocytosis of GluA3 and promote its translocation toward endolysosomal compartments for degradation. Mechanistically, these Aβ-driven effects critically depend on the PDZ-binding motif of GluA3. A single point mutation in the GluA3 PDZ-binding motif prevented Aβ-driven effects and rendered synapses fully resistant to the effects of Aβ. Correspondingly, proteomics on synaptosome fractions from APP/PS1-transgenic mice revealed a selective reduction of GluA3 at an early age. These findings support a model where the endocytosis and lysosomal degradation of GluA3-containing AMPARs are a critical early step in the cascade of events through which Aβ accumulation causes a loss of synapses.

Keywords: AMPA; Alzheimer; GluA3; PDZ domain; amyloid; synapse.


Conflict of interest statement

The authors declare no competing financial interests.

Figures

Figure 1.
Figure 1.
Neuronal expression of GluA3 is sufficient for Aβ to impair synaptic function. Apical dendrites of GluA3-KO neurons expressing GFP (n = 19) or GFP + APPCT100 (n = 15) have similar density of GFP-containing spines. Scale bar, 5 μm. B, GluA3-KO apical dendrites expressing GFP-GluA3 (n = 25) or GFP-GluA3 + APPCT100 (n = 29) showed a different density of GFP-containing spines (t(50) = 2.76; p = 0.008). Scale bar, 5 μm. See Extended Data Figure 1-2 for more details. C, Left, Time series of the SEP-GluA3-expressing dendritic spine before and after fluorescence bleaching; scale bar, 1 µm. See Extended Data Figure 1-3 for more details. Right, FRAP of dendritic spines expressing SEP-GluA3 (black, n = 22) or coexpressing SEP-GluA3 + APPCT100 (gray, n = 22), demonstrating APPCT100 reduced immobile fraction of SEP-GluA3 (t(20) and t(30), t(84) = 2.73 and 2.60; p = 0.015). D, (Left) example mEPSC traces, (middle) mEPSC frequency, and (right) mEPSC amplitude of GluA3-KO neurons (uninf. n = 24; APPCT100 n = 29; uninf. n = 29; GFP-GluA3 n = 30; uninf. N = 29; GFP-GluA3 + APPCT100 n = 27). Only the combined expression of GFP-GluA3 with APPCT100 lowered mEPSC frequency (F = 3.986; p = 0.002; ANOVA, GFP-GluA3 + APPCT100 vs GFP + APPCT100 p = 0.016; GFP-GluA3 vs GFP-GluA3 + APPCT100 p = 0.008; uninf. vs GFP-GluA3 + APPCT100 p = 0.002) but not (right) mEPSC amplitude. Bottom, Cumulative distribution of mEPSC amplitudes (100 events per neuron, p values from the K–S test). E, Example traces and dot plots (filled dots represent individual dual recording; open dots denote averages) of simultaneous dual EPSC recordings from neighboring (left; n = 18) GFP-GluA3–infected and GFP-GluA3–uninfected GluA3-KO neurons showed no significant synaptic depression unless APPCT100 was coexpressed (right; n = 19). Data are mean ± SEM. *p < 0.05. Statistics: (A, B) unpaired student t test; (C) unpaired student t test with Holm–Šídák multiple-comparison correction; (D) one-way ANOVA; (E) paired t test.
Figure 2.
Figure 2.
Neuronal expression of GluA3K887A does not sensitize GluA3-KO neurons to Aβ. Density of GFP-containing spines on GFP-GluA3K887A expressing GluA3-KO dendrites was unchanged by APPCT100 coexpression (GFP-GluA3K887A n = 31; GFP-GluA3K887A + APPCT100 n = 27; example images scale bar, 5 μm). (B, Left) In dendritic GluA3-KO spines expressing SEP-GluA3K887A (dark green, n = 12), the coexpression of APPCT100 coexpression (light green, n = 13) did not affect FRAP. (C, Left) Example mEPSC traces of GluA3-KO neurons expressing GFP-GluA3K887A with or without APPCT100. Center, Expression of GFP-GluA3K887A with or without APPCT100 did not affect mEPSC frequency. Right, GFP-GluA3K887A expression lowered mEPSC amplitude (t(49) = 2.27; p = 0.028) but not when APPCT100 was coexpressed (uninf. n = 23; GFP-GluA3K887A n = 28; uninf. n = 27; GFP-GluA3K887A + APPCT100 n = 31). Bottom, Cumulative distribution of mEPSC amplitudes (100 events per neuron, p values from the K–S test). D, Example traces and dot plots (filled dots represent individual paired recording, open dots denote averages) of (left) paired EPSC recordings from GFP-GluA3K885A-expressing GluA3-KO neurons and their uninfected neighbor showed no synaptic depression (n = 15), (right) similar to those coexpressing APPCT100 (n = 14). See Extended Data Figure 2-1 for more details. Data are mean ± SEM. *p < 0.05. Statistics: (A) unpaired student t test; (B) unpaired student t test with Holm–Šídák multiple-comparison correction. C, One-way ANOVA; (D) paired t test.
Figure 3.
Figure 3.
Neuronal expression of GluA3S885A does not sensitize GluA3-KO neurons to Aβ. A, GluA3-KO apical dendrites expressing GFP-GluA3S885A (n = 19) or GFP-GluA3S885A + APPCT100 (n = 17) showed a similar low density of GFP-containing spines. Example images scale bar, 5 μm. B, (Top) example mEPSC traces, (left) mEPSC frequency, and (middle) mEPSC amplitude of GluA3-KO CA1 neurons (uninf. n = 22; GFP-GluA3S885A n = 23; uninf. n = 25; GFP-GluA3S885A + APPCT100 n = 29) was unaffected by the expression of GFP-GluA3S887A with or without APPCT100. Right, Cumulative distribution of mEPSC amplitudes (100 events per neuron, p values from the K–S test). C, Example traces and dot plots (filled dots represent individual dual recording; open dots denote averages) of dual EPSC recordings from neighboring infected and uninfected GluA3-KO CA1 neurons expressing GFP-GluA3S885A (left; n = 17) or coexpressing GFP-GluA3S885A + APPCT100 (right; n = 16) showed no synaptic depression. Data are mean ± SEM. Statistics: (A) unpaired student t test; (B) one-way ANOVA; (C) paired t test.
Figure 4.
Figure 4.
Single amino acid change in GluA3 PDZ motif determines sensitivity of synapses for Aβ. A–E, Comparison of GFP-GluA3 (Fig. 1), GFP-GluA3S885A (Fig. 2), and GFP-GluA3K887A (Fig. 3) without (left) or with coexpression of APPCT100. A, Density of GFP-containing spines was lower in GFP-GluA3S885A expressing GluA3-KO dendrites compared with those expressing GFP-GluA3 or GFP-GluA3K887A (F = 6.885; p = 0.002; ANOVA; left; GFP-GluA3 vs GFP-GluA2S885A, p = 0.001; GFP-GluA3 vs GFP-GluA3K887A, p = 0.361; GFP-GluA3S885A vs GFP-GluA3K887A, p = 0.031), but only compared with GFP-GluA3K887A when APPCT100 was coexpressed (F = 5.166; p = 0.008; ANOVA; right; GFP-GluA3 vs GFP-GluA2S885A, p = 0.136; GFP-GluA3 vs GFP-GluA3K887A, p = 0.306; GFP-GluA3S885A vs GFP-GluA3K887A, p = 0.006). B, FRAP in dendritic GluA3-deficient spines expressing SEP-GluA3 and SEP-GluA3K887A was similar (left; t(20), t(32) = 1.46; p = 0.154; t(30), t(32) = 2.01; p = 0.102) but different with APPCT100 coexpression (right; t(20), t(33) = 2.25; p = 0.048 and t(30), t(33) = 2.36; p = 0.048). C, Expression of GFP-GluA3, GFP-GluA3S885A, and GFP-GluA3K887A similarly affected mEPSC frequency compared with their uninfected neighbors (left; F = 1.348; p = 0.266, ANOVA) but with APPCT100 coexpression; GFP-GluA3 had a lower mEPSC frequency compared with GFP-GluA3K887A but not GFP-GluA3S885A (right; F = 5.393; p = 0.006, ANOVA; GFP-GluA3 vs GFP-GluA2S885A, p = 0.104; GFP-GluA3 vs GFP-GluA3K887A, p = 0.005; GFP-GluA3S885A vs GFP-GluA3K887A, p = 0.639). D, Average mEPSC amplitude was unaffected by GFP-GluA3 variants (left; F = 2.641; p = 0.078; ANOVA), also with APPCT100 expression (right; F = 0.804; p = 0.327; ANOVA). E, Changes in the eEPSC amplitude ratio between infected and uninfected GluA3-deficient neurons were not significantly different (left; F = 0.804; p = 0.454; ANOVA), also with APPCT100 coexpression (right; F = 1.840; p = 0.170; ANOVA). Data are mean ± SEM. *p < 0.05. Statistics: (A, C–E) one-way ANOVA; (B) unpaired student t test with Holm–Šídák multiple comparison.
Figure 5.
Figure 5.
Aβ oligomers trigger synapse loss in cultured neurons that express GluA3 with intact PDZ-binding domain. A, Oligomeric Aβ significantly lowered synaptic currents, as shown in representative example mEPSC traces (left), mEPSC frequency (t(33) = 2.42; p = 0.021; vehicle n = 21; Aβ n = 14), average mEPSC amplitude (t(33) = 1.84; p = 0.076; middle), and mEPSC cumulative distribution in cultured hippocampal neurons (right; 100 event per neuron, p values from the K–S test). B, Aβ lowers synapse density on dendrites (GFP, magenta) of cultured hippocampal neurons where synapses are visualized by recombinantly overexpressed Homer1c-ALFA (cyan; t(40) = 2.20; p = 0.034; control n = 20; Aβ n = 22). C, Neurons expressing SEP-GluA3 show Aβ-mediated synapse loss (t(55) = 2.52; p = 0.014; vehicle n = 30; Aβ n = 27; D) unlike neurons expressing SEP-GluA3K887A (t(48) = 0.19; p = 0.847; vehicle n = 26; Aβ n = 24). Data are mean ± SEM. *p < 0.05. Scale bars, 5 μm. Statistics: unpaired student t tests.
Figure 6.
Figure 6.
Aβ oligomers induce a loss of surface and internalized GluA3 in cultured neurons. Left, Neurons expressing recombinant (A) SEP-GluA3 or (B) SEP-GluA3K887A where dendritic surface SEP-GluA3 (magenta) and internalized SEP-GluA3 (cyan) was labeled separately. See Extended Data Figure 6-1 for more details. (A right) Aβ lowered surface (t(73) = 2.20; p = 0.031) and internalized (t(73) = 2.84; p = 0.006) SEP-GluA3 puncta (B right) but not surface and internalized SEP-GluA3K887A puncta (SEP-GluA3 puncta, vehicle n = 40; Aβ n = 37; SEP-GluA3K887A puncta, vehicle n = 28; Aβ n = 22). C, Aβ reduced the fraction of internalized SEP-GluA3 (F(1,145) = 20.39; p < 0.001; two-way ANOVA) which was rescued by leupeptin (p < 0.001; two-way ANOVA interaction; vehicle n = 40; Aβ n = 37; vehicle + leup. n = 36; Aβ + leup. n = 36). D, Aβ reduced the fraction of internalized SEP-GluA3K887A (F(1,92) = 6.501; p = 0.012; two-way ANOVA). This effect was not altered by leupeptin (vehicle n = 28; Aβ n = 21; vehicle + leup. n = 23; Aβ + leup. n = 23). Data are mean ± SEM. *p < 0.05. Scale bars, 5 μm. Statistics: (A, B) unpaired student t test; K–S test for cumulative distributions, (C, D) two-way ANOVA.
Figure 7.
Figure 7.
Aβ causes internalized GluA3 to be directed to lysosomes in cultured neurons. A, Dendrites of neurons expressing ALFA-GluA3 where internalized GluA3 (cyan) and endogenous Rab7 (magenta) were labeled. See Extended Data Figure 7-1 for more details. B, Aβ only increased the fraction of internalized GluA3-positive Rab-7 puncta in the presence of leupeptin (p < 0.001; two-way ANOVA interaction; Aβ + leup. vs control p < 0.001 vs control + leup. p = 0.002 vs Aβ p < 0.001; control n = 22, leup. n = 28; Aβ n = 26; Aβ + leup. n = 22). C, The number of Rab7 puncta was increased by leupeptin (p = 0.020; two-way ANOVA) but (D) the Rab7 puncta size was unaffected. Data are mean ± SEM. *p < 0.05. Scale bars, 5 μm. Statistics: (B–D) two-way ANOVA.
Figure 8.
Figure 8.
GluA3 levels are decreased in synaptosomes of 3-month-old APP/PS1-transgenic mice. A–D, Protein intensity ratios of GluA1, GluA2, and GluA3 in synaptosomes isolated from hippocampi from APP/PS1-mice and their wild-type littermates of various ages, adopted from Vegh et al. (2014). A, Log-fold changes of GluA3 were similar in 1.5-month-old APP/PS1-mice (B) but significantly more reduced than that of GluA1 (F(2,12) = 12.17; p = 0.002; ANOVA) and GluA2 (p = 0.009) in 3-month-old APP/PS1-mice. C, Log-fold changes were not significantly different between GluA1, GluA2, and GluA3 in 6- or (D) 12-month-old APP/PS1-mice. A–D, n = 5 animals; data are mean ± SEM. *p < 0.05. Statistics: (A–D) one-way ANOVA.

Similar articles

Cited by

References

    1. Alfonso S, et al. (2014) Synapto-depressive effects of amyloid beta require PICK1. Eur J Neurosci 39:1225–1233. 10.1111/ejn.12499 - DOI - PMC - PubMed
    1. Alfonso SI, et al. (2016) Gain-of-function mutations in protein kinase Calpha (PKCalpha) may promote synaptic defects in Alzheimer's disease. Sci Signal 9:ra47. 10.1126/scisignal.aaf6209 - DOI - PMC - PubMed
    1. Armstrong DM, Ikonomovic MD (1996) AMPA-selective glutamate receptor subtype immunoreactivity in the hippocampal dentate gyrus of patients with Alzheimer disease. Evidence for hippocampal plasticity. Mol Chem Neuropathol 28:59–64. 10.1007/BF02815205 - DOI - PubMed
    1. Armstrong DM, Ikonomovic MD, Sheffield R, Wenthold RJ (1994) AMPA-selective glutamate receptor subtype immunoreactivity in the entorhinal cortex of non-demented elderly and patients with Alzheimer's disease. Brain Res 639:207–216. 10.1016/0006-8993(94)91732-9 - DOI - PubMed
    1. Ashourpour F, Jafari A, Babaei P (2021) Chronic administration of Tat-GluR23Y ameliorates cognitive dysfunction targeting CREB signaling in rats with amyloid beta neurotoxicity. Metab Brain Dis 36:701–709. 10.1007/s11011-020-00662-8 - DOI - PubMed

Substances

LinkOut - more resources