. 2025 Jan;15(1):e70173.
doi: 10.1002/ctm2.70173.

Immunoregulatory programs in anti-N-methyl-D-aspartate receptor encephalitis identified by single-cell multi-omics analysis

Affiliations

Immunoregulatory programs in anti-N-methyl-D-aspartate receptor encephalitis identified by single-cell multi-omics analysis

Xinhui Li et al. Clin Transl Med. 2025 Jan.

Abstract

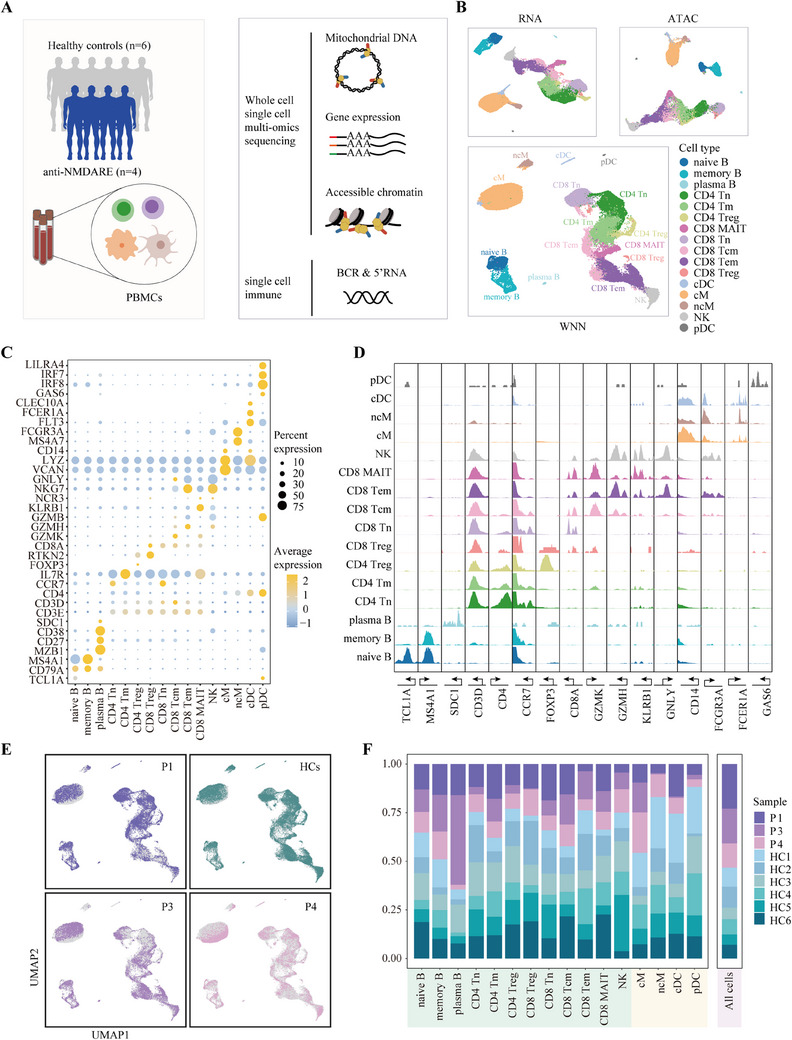
Background: Anti-N-methyl-D-aspartate receptor encephalitis (anti-NMDARE) is a prevalent type of autoimmune encephalitis caused by antibodies targeting the NMDAR's GluN1 subunit. While significant progress has been made in elucidating the pathophysiology of autoimmune diseases, the immunological mechanisms underlying anti-NMDARE remain elusive. This study aimed to characterize immune cell interactions and dysregulation in anti-NMDARE by leveraging single-cell multi-omics sequencing technologies.

Methods: Peripheral blood mononuclear cells (PBMCs) from patients in the acute phase of anti-NMDARE and healthy controls were sequenced using single-cell joint profiling of transcriptome and chromatin accessibility. Differential gene expression analysis, transcription factor activity profiling, and cell-cell communication modeling were performed to elucidate the immune mechanisms underlying the disease. In parallel, single-cell B cell receptor sequencing (scBCR-seq) and repertoire analysis were conducted to assess antigen-driven clonal expansion within the B cell population.

Results: The study revealed a significant clonal expansion of B cells, particularly plasma cells, in anti-NMDARE patients. The novel finding of type I interferon (IFN-I) pathway activation suggests a regulatory mechanism that may drive this expansion and enhance antibody secretion. Additionally, activation of Toll-like receptor 2 (TLR2) in myeloid cells was noted, which may connect to tumor necrosis factor-alpha (TNF-α) secretion. This cytokine may contribute to the activation of B and T cells, thereby perpetuating immune dysregulation.

Conclusions: This study presents a comprehensive single-cell multi-omics characterization of immune dysregulation in anti-NMDARE, highlighting the expansion of B cell and the activation of the IFN-I and TLR2 pathways. These findings provide deeper insights into the molecular mechanism driving the pathogenesis of anti-NMDARE and offer promising targets for future therapeutic intervention.

Key points: Significant B cell clonal expansion, particularly in plasma cells, driven by antigen recognition. IFN-I pathway activation in plasma cells boosts their antibody production and potentially exacerbates immune dysregulation. TLR2 pathway activation in myeloid cells contributes to TNF-α secretion and could influence adaptive immune responses.

Keywords: anti‐N‐methyl‐D‐aspartate receptor encephalitis; autoimmune disease; regulatory program; single‐cell multi‐omics sequencing.


Conflict of interest statement

The authors declare they have no conflicts of interest.

Figures

FIGURE 1
FIGURE 1
Single‐cell multi‐omics profiling reveals altered immune cell proportions in anti‐NMDARE patients. (A) A schematic representation of the samples and profiling methods used in this study. (B) UMAPs visualising all cells passing quality control, coloured by annotated clusters. Cell annotations are derived from weighted‐nearest neighbour (WNN) assignment of 54 365 cells to 16 cell types: classical and non‐classical monocytes (cMs and ncMs); conventional and plasmacytoid dendritic cells (cDCs and pDCs); naive and memory CD4+ T cells (CD4 Tn and CD4 Tm); naive, central memory, effector memory and mucosa‐associated invariant CD8+ T cells (CD8 Tn, CD8 Tcm and CD8 Tem, CD8MAIT); regulatory CD4+ and CD8+ T cells (CD4 Treg and CD8 Treg); nature killer cells (NK); and naive, memory and plasma B cells. (C) A bubble plot displaying the expression of marker genes across each cell type. The size of the dot indicates the proportion of cells in that cell type expressing marker genes. The scaled mean expression of marker genes is represented from light blue to dark blue. (D) Genome tracks illustrating the normalised chromatin accessibility surrounding marker genes. (E) UMAP of WNN graph for single‐cell multi‐omics modalities showing cells per patient and all healthy controls. (F) Proportions of each sample comprising each cell type. Samples from patients with anti‐NMDARE are in purple and healthy controls are shown in green. The total proportions for each sample are shown in the rightmost column.
FIGURE 2
FIGURE 2
Regulatory map of anti‐NMDARE‐enriched plasma B cells. (A) A UMAP plot displaying all B cells, with identified naive B, memory B and plasma B cells labelled in different colours. Inset: (Top) The stacked bar plots depict the percentages of naive B, memory B and plasma B cells in patients (Ps) and healthy controls (HCs). (Bottom) The stacked bar plots display the percentages of plasma B in Ps and HCs. (B) A bar plot illustrating the percentages of naive B, memory B and plasma B cells in each sample. (C) The Pearson correlation coefficient of each cell type by transcriptome and accessibility matrix. (D) Heatmaps showing expression of differentially expressed genes (DEGs) (Logistic Regression (LR) test, Padj ≤ .01, |log2FC| ≥ .5) in 100 cells sampling from naive B, memory B and plasma B, respectively. Each row represents a DEG, and each column represents a sampled cell. The colour indicates the z‐transformed gene expression (z‐score range is −2 to 2). (E) Heatmap showing differentially accessible peaks (DAPs) in 100 cells sampling from naive B, memory B and plasma B, respectively. Each row represents a DAP, and each column represents a sampled cell. The colour indicates the z‐transformed peaks (z‐score range is −2 to 2). (F) The Dot plot shows the function enrichment results, the bubble size correlates with the gene count in each term, while the colour represents the percentage of differential genes within each term. (G) A bubble plot visualises all the TFs based on their characteristics. The Y‐axis represents the enrichment −log10 (Padj), while the X‐axis depicts the enrichment score (higher values indicate a stronger match). The size of the bubble represents the enrich percentage, the colour represents the enrichment score of TFs. (H) A bubble plot visualising the expression of the 25 candidate TFs (enrichment Padj < .05). The size represents the −log10 (Padj), and the colour represents the log2FC of these TFs expressions. (I) A gene regulation network (GRN) depicting the key TFs and the genes regulated. (J) A Dot plot depicting the gene expression level of the interferon (IFN) pathway in B cells. Dot size correlates with the percentage of cells within each cluster, while the colour represents the average expression level. The p‐values were calculated by the one‐way ANOVA method, *p < .05, **< .01, ***p < .001. (K) The violin plot depicts the expression level of IFNAR1 and IFNAR2 receptor genes in naive B, memory B and plasma B cells. (L) A schematic illustrating activation of the type I interferon (IFN‐I) pathway in plasma B cells.
FIGURE 3
FIGURE 3
B‐cell immune activation in anti‐NMDARE. (A and B) A UMAP plot displaying naive B, memory B and plasma B cells labelled in different colours (A). The stacked bar plots depict the proportion of naive B, memory B and plasma B cells in each Ps and HCs (B). (C and D) A UMAP plot displaying four clone types in B cells (C). The bar plot indicates the proportion of four clone types in naive B, memory B and plasma B cells (D). (E and F) A UMAP plot displaying clones and non‐clones in B cells (E). The proportion of clones in plasma B and memory B cells across individual samples (F). (G and H) Clonal types were identified within each sample. The bar plot (G) illustrates the cell count of memory B and plasma B cells within each clonal type. The dot plot (H) represents the number of plasma B cells within clonal types across samples. The numbers on the horizontal axis labels denote the count of each clonal type in Ps. (I) Expression levels and mutation rates of the IGHV3 gene in naive B, memory B and plasma B cells, with colours indicating whether the cells are clonal or not. (J) Expression levels of genes in the IFN‐I pathway across B cells, with colours indicating whether the cells are clonal or not (Wilcoxon rank sum test). *p < .05, **< .01, ***p < .001.
FIGURE 4
FIGURE 4
Dysregulation of T cells in anti‐NMDARE. (A) A UMAP plot displaying all T and NK cells, coloured by annotated clusters. (B) The proportion of T and NK cells in each sample. Inset: The proportion of T and NK cells in Ps and HCs (Likelihood Ratio test, Padj ≤ .01, |log2FC| ≥ .5). (C) A bar plot displaying the number of DEGs (left) and DAPs (right) in Ps compared with HCs. (D) A bubble plot displaying the enrichment score of motifs (top) and the expression and chromVAR activity of TFs (bottom). (E) The regulation network (TF‐gene) in CD4 Tm, CD8 Tcm and CD8 Tem. The colour of nodes represents the number of edges, and the colour of edges indicates the T‐cell subtype. (F) A bar plot depicting the function enrichment results of genes in (E).
FIGURE 5
FIGURE 5
Dysregulation of myeloid cells in anti‐NMDARE. (A) A UMAP plot displaying four myeloid cell subtypes, coloured by annotated clusters. Inset: The proportions of four types of myeloid cells in Ps and HCs. (B) Left: A heatmap showing the expression of DEGs (Likelihood Ratio test, Padj < .01, |log2FC| > .5) in 100 cells sampling from three myeloid cell subtypes, respectively. Each row represents a DEG, and each column represents a sampled cell. The colour indicates the z‐transformed gene expression (z‐score range is −.5 to .5). Right: Function enrichment results of the upregulated genes in cMs, ncMs and cDCs, respectively. (C) A bubble plot displaying the antigen receptor protein‐encoding gene expression levels in four myeloid subtypes. The colour represents the expression ratio, and the size represents the log2FC between Ps and HCs. The border colours of the dots indicate the significance (p‐value by Wilcox rank sum test) of the comparison. The red triangle marks the four most significantly different genes. (D) A violin plot depicting the expression levels of four receptor genes in four myeloid subtypes in Ps and HCs (Wilcoxon rank sum test). *p < .05, **< .01, ***p < .001. (E) A bubble plot depicting the expression levels of TNF pathway ligand–receptor genes in 16 immune cell subtypes. The colour of the bubbles represents the log2 fold‐change in expression between Ps and HCs, while the border colour indicates the p‐value of the difference (Wilcoxon rank sum test). The size of each bubble corresponds to the percentage of expression. The background shading highlights significant cell–cell interactions by CellChat (p < .01), and the different background frames and central lines represent distinct ligand–receptor pairs. (F) The levels of IFN‐α and TNF‐α in plasma of HCs (n = 7), acute phase anti‐NMDARE (n = 7), convalescence anti‐NMDARE (n = 7) and recurrent stage anti‐NMDARE (n = 6). Each sample was processed in three technical replicates. The p‐values were calculated by the one‐way ANOVA method, *p < .05, **< .01, ***p < .001. (G) The levels of IFN‐α in the serum of humanised mice engrafted with PBMCs from anti‐NMDARE patients (Patient), healthy donors (HC) and medium‐only controls (NC) were assessed using Western blot analysis. Each group comprised three samples. p‐Values were calculated using T‐test, with significance defined as *p < .05, **p < .01 and ***p < .001.

References

    1. Titulaer MJ, McCracken L, Gabilondo I, et al. Treatment and prognostic factors for long‐term outcome in patients with anti‐NMDA receptor encephalitis: an observational cohort study. Lancet Neurol. 2013;12:157‐165. doi:10.1016/s1474-4422(12)70310-1 - DOI - PMC - PubMed
    1. Dalmau J, Tüzün E, Wu HY, et al. Paraneoplastic anti‐N‐methyl‐D‐aspartate receptor encephalitis associated with ovarian teratoma. Ann Neurol. 2007;61:25‐36. doi:10.1002/ana.21050 - DOI - PMC - PubMed
    1. Gong X, Wang N, Zhu H, Tang N, Wu K, Meng Q. Anti‐NMDAR antibodies, the blood‐brain barrier, and anti‐NMDAR encephalitis. Front Neurol. 2023;14:1283511. doi:10.3389/fneur.2023.1283511 - DOI - PMC - PubMed
    1. Liu CY, Zhu J, Zheng XY, Ma C, Wang X. Anti‐N‐methyl‐D‐aspartate receptor encephalitis: a severe, potentially reversible autoimmune encephalitis. Mediators Inflamm. 2017;2017:6361479. doi:10.1155/2017/6361479 - DOI - PMC - PubMed
    1. Huang YQ, Xiong H. Anti‐NMDA receptor encephalitis: a review of mechanistic studies. Int J Physiol Pathophysiol Pharmacol. 2021;13:1‐11. - PMC - PubMed

LinkOut - more resources