

Analysis of mRNA Pentatricopeptide Repeat Domain 1 as a prospective oncogene in clear cell renal cell carcinoma that accelerates tumor cells proliferation and invasion via the Akt/GSK3β/β-catenin pathway
- PMID: 39779600
- PMCID: PMC11711582
- DOI: 10.1007/s12672-025-01764-4
Analysis of mRNA Pentatricopeptide Repeat Domain 1 as a prospective oncogene in clear cell renal cell carcinoma that accelerates tumor cells proliferation and invasion via the Akt/GSK3β/β-catenin pathway
Abstract
Background: Although pentatricopeptide repeat domain 1 (PTCD1) has been found to modulate mitochondrial metabolic and oxidative phosphorylation, its contribution in the growth of clear cell renal cell carcinoma (ccRCC) remains unknown.
Methods: The Cancer Genome Atlas (TCGA) dataset was utilized to examine the transcriptional alterations, patient characteristics, clinical outcomes, as well as pathway activation of PTCD1. The Weighted Gene Co-expression Network Analysis (WGCNA) was performed to investigate potential genes that associated with PTCD1. The researchers estimated the relationship between PTCD1, tumor immunology, and epithelial mesenchymal transition (EMT). Researchers studied how PTCD1 affects the functional behavior of tumor cells in vitro.
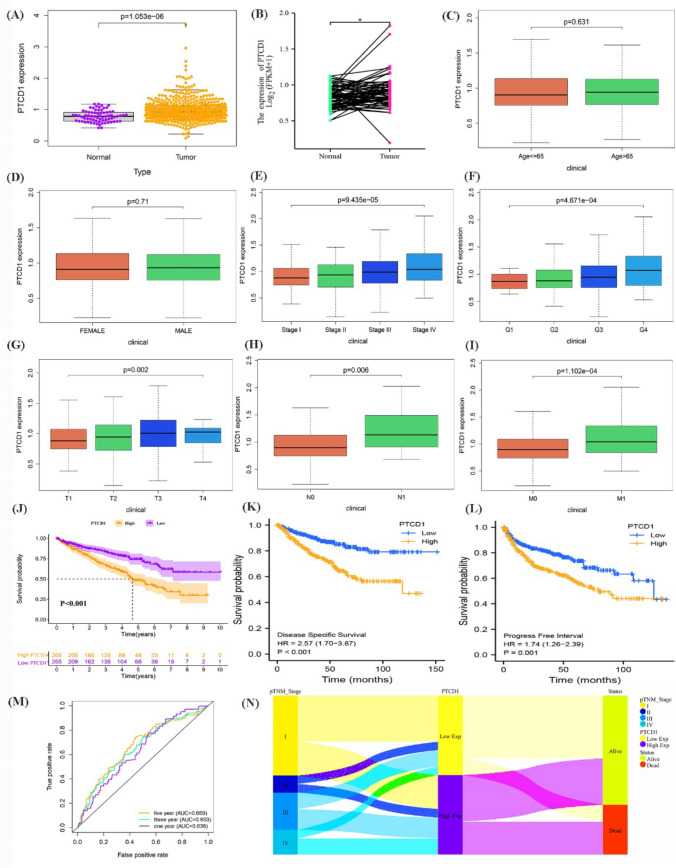
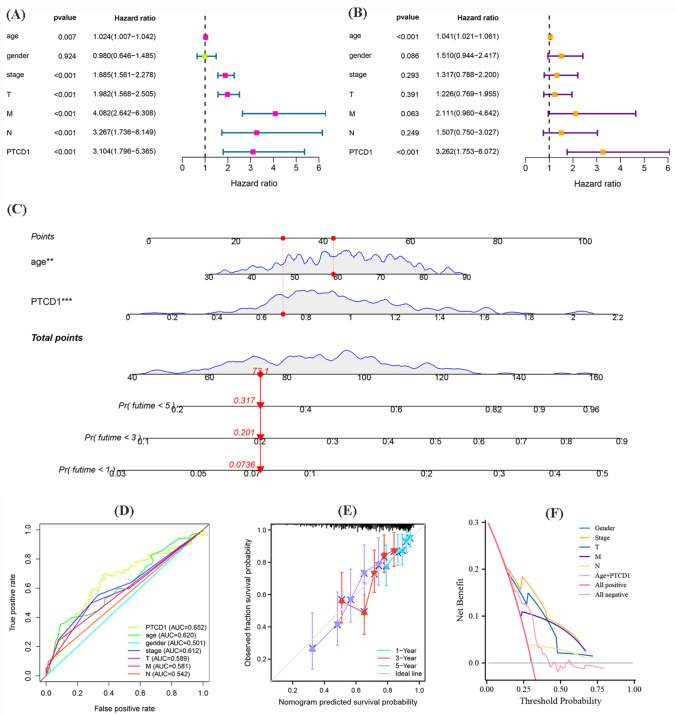
Results: PTCD1 expression was greater in ccRCC samples than in normal samples, and expression increased gradually as the stage increased. In TCGA cohorts, higher PTCD1 expression was substantially associated with a poorer clinical stage, histological grading, T stage, N stage, M stage, and survival outcomes. The results of multivariate analysis showed that PTCD1 was an independent variable affecting the survival outcomes of ccRCC patients (p < 0.001). PTCD1 regulated ccRCC progression via various cancer mechanisms including PI3K-Akt signaling, focal adhesion, PD-L1 expression, and PD-1 checkpoints in cancer. WGCNA discovered a significant relationship between PTCD1 and IARS2, LRPPRC, MT-ND2, MT-CO1, MT-CO2, MT-CYB, MT-ATP6, and MT-ND4. Furthermore, PTCD1 expression levels was closely associated with immune infiltrating, immunological checkpoint, EMT, immunotherapy responsiveness, and anti-tumor medication sensitivities. Upregulation of PTCD1 in ccRCC cells resulted in considerably increased cellular invasion and migration. Mechanistically, the upregulation of PTCD1 increased the phosphorylation of AKT at Ser473 and GSK-3β at Ser9, as well as enhanced activation of Wnt/β-catenin pathway.
Conclusion: Elevated expression of PTCD1 was associated with malignant biological behaviors and poor outcomes of ccRCC patients, and PTCD1 may accelerate tumor cells proliferation and invasion via the Akt/GSK3β/β-catenin pathway. Our findings indicated that PTCD1 had the potential to become a new target for predicting prognosis and targeted therapy.
Keywords: Biomarker; Clear cell renal cell carcinoma; Immune microenvironment; Pentatricopeptide repeat domain 1; Prognosis; Weighted Gene Coexpression Network Analysis.
© 2025. The Author(s).
Conflict of interest statement
Declarations. Ethics approval and consent to participate: HPA database and TCGA database belong to public databases. The patients involved in the database have obtained ethical approval. Consent for publication: Not applicable. Competing interests: The authors declare no competing interests.
Figures


Similar articles
-
Downregulation of PTCD1 in Bladder Urothelial Carcinoma Predicts Poor Prognosis and Levels of Immune Infiltration.J Oncol. 2022 Jun 28;2022:1146186. doi: 10.1155/2022/1146186. eCollection 2022. J Oncol. 2022. PMID: 35799606 Free PMC article.
-
Long Non-Coding RNA LUCAT1 Promotes Proliferation and Invasion in Clear Cell Renal Cell Carcinoma Through AKT/GSK-3β Signaling Pathway.Cell Physiol Biochem. 2018;48(3):891-904. doi: 10.1159/000491957. Epub 2018 Jul 20. Cell Physiol Biochem. 2018. PMID: 30032137
-
TAGLN2 Promotes the Proliferation, Migration, Invasion, and EMT of Clear Cell Renal Cell Carcinoma Through the PI3K/Akt Signaling Pathway.Biochem Genet. 2023 Aug;61(4):1265-1281. doi: 10.1007/s10528-022-10319-z. Epub 2022 Dec 22. Biochem Genet. 2023. PMID: 36547768
-
PLAUR facilitates the progression of clear cell renal cell carcinoma by activating the PI3K/AKT/mTOR signaling pathway.PeerJ. 2024 Jun 27;12:e17555. doi: 10.7717/peerj.17555. eCollection 2024. PeerJ. 2024. PMID: 38948215 Free PMC article.
-
Molecular landscape of clear cell renal cell carcinoma: targeting the Wnt/β-catenin signaling pathway.Discov Oncol. 2025 Apr 14;16(1):524. doi: 10.1007/s12672-025-02228-5. Discov Oncol. 2025. PMID: 40227498 Free PMC article. Review.
Cited by
-
GSK3β serves as a novel therapeutic target in patients with type 2 diabetes mellitus complicated by colorectal cancer.Am J Transl Res. 2025 Jul 15;17(7):5355-5370. doi: 10.62347/TQUD3910. eCollection 2025. Am J Transl Res. 2025. PMID: 40821070 Free PMC article.
References
-
- Siegel RL, Miller KD, Fuchs HE, Jemal A. Cancer Statistics, 2021. CA Cancer J Clin. 2021;71(1):7–33. - PubMed
-
- Ljungberg B, Albiges L, Abu-Ghanem Y, Bedke J, Capitanio U, Dabestani S, Fernández-Pello S, Giles RH, Hofmann F, Hora M, et al. European Association of Urology Guidelines on renal cell carcinoma: the 2022 update. Eur Urol. 2022;82:399–410. - PubMed
-
- Creighton CJ. Proteomic signatures of clear cell renal cell carcinoma. Nat Rev Nephrol. 2020;16(3):133–4. - PubMed
-
- Campi R, Stewart GD, Staehler M, Dabestani S, Kuczyk MA, Shuch BM, Finelli A, Bex A, Ljungberg B, Capitanio U. Novel liquid biomarkers and innovative imaging for kidney cancer diagnosis: what can be implemented in our practice today? A systematic review of the literature. Eur Urol Oncol. 2021;4(1):22–41. - PubMed
Grants and funding
LinkOut - more resources
Full Text Sources
Research Materials
Miscellaneous