. 2025 Jan 8;16(1):227.
doi: 10.1038/s41467-024-55165-2.

Genetic code expansion reveals site-specific lactylation in living cells reshapes protein functions

Affiliations

Genetic code expansion reveals site-specific lactylation in living cells reshapes protein functions

Chang Shao et al. Nat Commun. .

Abstract

Protein lactylation is an emerging field. To advance the exploration of its biological functions, here we develop a comprehensive workflow that integrates proteomics to identify lactylated sites, genetic code expansion (GCE) for the expression of site-specifically lactylated proteins in living cells, and an integrated functional analysis (IFA) platform to evaluate their biological effects. Using a combined wet-and-dry-lab proteomics strategy, we identify a conserved lactylation at ALDOA-K147, which we hypothesize plays a significant biological role. Expression of this site-specifically lactylated ALDOA in mammalian cells reveals that this modification not only inhibits enzymatic activity but also induces gain-of-function effects. These effects reshaped ALDOA functionality by enhancing protein stability, promoting nuclear translocation, regulating adhesion-related gene expression, altering cell morphology and modulating ALDOA-interacting proteins. Our findings highlight the utility of the GCE-based workflow in establishing causal relationships between specific lactylation events and both target-specific and cell-wide changes, advancing our understanding of protein lactylation's functional impact.


Conflict of interest statement

Competing interests: The authors declare no competing interests.

Figures
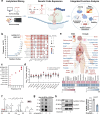
Fig. 1
Fig. 1. Proteomics mining pinpoints functionally important lactylation on ALDOA.
a The workflow first uses proteomics to mine understudied lactylation sites of potential functional importance, then uses GCE to express site-specifically lactylated proteins in living cells, followed by assembling a suite of biochemical tools to assess the biological consequences of site-specific lactylation. Created in BioRender. Shao, C. (2024) BioRender.com/a84h467. b Detection frequency of the lactylation sites in the affinity-enriched lactylproteome of representative human and mouse cell lines (left panel). Cells were treated with 25 mM lactate for 24 h to stimulate lactylation. The ion intensity (bubble size) and ranking (bubble color) of the identified lactylated peptides with a detection frequency of more than 10 times were shown in the corresponding bubble plot (right panel). c Detection frequency of the lactylation sites in the re-analyzed 14 human cell types retrieved from the Meltome Atlas (PXD011929). d Abundance of the lactylated peptides (gray) in the re-analyzed human cell proteome retrieved from the Meltome Atlas (PXD011929). Peptides carrying ALDOA-147Klac are highlighted in red. R1 and R2 represent the two biologically independent experiments we re-analyzed. e Abundance and occupancy of the peptides carrying lactylated ALDOA-K147 in 15 healthy tissues (red) retrieved from a deep proteome atlas of 29 human healthy tissues (PXD010154). Created in BioRender. Shao, C. (2024) BioRender.com/w02j352. Occupancy was estimated based on the ratio of the abundance of the lactylated peptides divided by the sum of the lactylated and non-lactylated peptides at this site. f Representative MS/MS spectrum with the signature CycIm ion revealing lactylation on ALDOA-K147 in human brain (PXD010154). g Dot blot assay of the generated ALDOA-147Klac antibody. Peptide 1 and 2, two synthesized ALDOA-147Klac-bearing peptides; peptide 3, an unmodified ALDOA-K147-bearing peptide. h Immunoblots of ALDOA-147Klac in HEK293T cells treated with oxamate (25 mM, 24 h). Data represent the mean ± S.D. (n = 3 biologically independent samples) and the p value was calculated by unpaired two-tailed Student’s t test. Source data are provided as a Source Data file.
Fig. 2
Fig. 2. Introducing site-specific lactylation in living cells with genetic code expansion.
a Illustrated structures of KlacRS variants for site-specific incorporation of Klac. b Analysis of the incorporation efficiency of KlacRS variants by EGFP fluorescence assay. E. coli cells co-transformed with evolved or engineered KlacRSes/tRNACUAPyl pairs and EGFP-39TAG plasmids in the presence or absence of Klac (1 mM, 16 h). Data represent the mean ± S.D. (n = 3 biological replicates/group). c Flow cytometry analysis of Klac incorporation efficiency in HEK293T cells co-transfected with the KlacRS1/tRNACUAPyl pair and mCherry-TAG-EGFP plasmids in the presence or absence of Klac (1 mM, 24 h, and 48 h). Data represents the mean ± S.D. (n = 3 biological replicates/group) and the p value was calculated by one-way ANOVA. d Representative images of HEK293T cells co-transfected with the KlacRS1/tRNACUAPyl pair and mCherry-TAG-EGFP plasmids in the presence or absence of Klac (1 mM, 24 h, and 48 h). Scale bar, 100 μm. Data represent the mean ± S.D. (n = 10 biological replicates/group), and the p value was calculated by one-way ANOVA. e Immunoblotting analysis of HEK293T cells expressing endogenous ALDOA, or overexpressing Flag-tagged ALDOA-WT or ALDOA-147Klac under the indicated transfection conditions, detected against anti-ALDOA, anti-Flag and the specific anti-ALDOA-147Klac antibodies. Low exposure: 2 s; high exposure, 6 s. The experiments were repeated three times with similar results. f Validation of successful incorporation of Klac on K147 of ALDOA. HEK293T cells overexpressing Flag-tagged ALDOA-WT or ALDOA-147Klac, followed by immunoprecipitation using anti-Flag antibody and bottom-up proteomic analysis. Left, extracted ion chromatogram (XIC) of the 147Klac-bearing peptide. The illustration was created in BioRender. Shao, C. (2024) BioRender.com/q85y323. Right, representative MS/MS spectrum with the signature CycIm ion revealing lactylation at K147. Source data are provided as a Source Data file.
Fig. 3
Fig. 3. Lactylation on ALDOA-K147 abolished enzyme activity and regulated glycolytic flux.
a Crystal structure of K147 in ALDOA (PDB 4ALD) and its substrate FBP. b Immunoblots of HEK293T cells expressing ALDOA-WT or ALDOA-147Klac after knocking down the endogenous ALDOA. c ALDOA activity of HEK293T cells expressing ALDOA-WT and ALDOA-147Klac after knocking down the endogenous ALDOA. Data represent the mean ± S.D. (n = 3 biological replicates/group), and the p value was calculated by one-way ANOVA. d Heat map comparing the abundance of metabolites involved in glycolysis. Abundance ratios were calculated by comparing ion intensities of individual metabolite in siALDOA, siALDOA+WT and siALDOA+147Klac groups, using the siCtrl group as a control. Glc glucose, G6P glucose 6-phosphate, FBP fructose 1,6-bisphosphate, G3P glycerol-3-phosphate, DHAP dihydroxyacetone phosphate, 3PG 3-phosphoglycerate, Pyr pyruvate, Lac lactate. e Seahorse analysis of HEK293T cells expressing ALDOA-WT or ALDOA-147Klac after knocking down the endogenous ALDOA. The ECAR was measured in real-time under basal conditions and after the addition of glucose (10 mM), oligomycin (3 μM) and 2-DG (50 mM). Left, the time course of a representative experiment. Right, determination of glycolysis rate. Data represent the mean ± S.D. (n = 10 biological replicates/group) and the p value was calculated by one-way ANOVA. Source data are provided as a Source Data file.
Fig. 4
Fig. 4. Lactylation altered subcellular partition of ALDOA.
a Subcellular localization of EGFP-tagged ALDOA-WT or ALDOA-147Klac (green) analyzed by confocal microscopy in cells co-transfected with the KlacRS1/tRNACUAPyl pair and the mCherry-T2A-ALDOA (WT/147TAG)-EGFP plasmids (n = 40 biological replicates/group). The nucleus was stained with Hoechst (blue), and mCherry (red) served as the transfection control. Left, representative images showing ALDOA-147Klac partially translocated into the nucleus compared to ALDOA-WT. Right, fluorescence intensity profiles across the indicated lines in the left. Scale bar, 5 μm. b Quantification of the percentage of nuclear ALDOA in the samples shown in (a), determined by normalizing the mean fluorescence intensity of nuclear EGFP-tagged ALDOA to that of the total EGFP-tagged ALDOA in whole cells. n = 40 biological replicates/group, and the p value was calculated by unpaired two-tailed Student’s t test. c Subcellular localization of ALDOA-WT and ALDOA-147Klac determined by immunoblotting the cells co-transfected with the KlacRS1/tRNACUAPyl pair and ALDOA-147TAG/ALDOA-WT plasmids in the presence or absence of Klac (5 mM, 48 h). Cytoplasmic β-tubulin and nuclear lamin B1 were used as loading controls. Cyto, the cytoplasmic fraction; Nuc, the nuclear fraction. The experiments were repeated three times with similar results. d Representive immunofluorescence imaging of ALDOA and ALDOA-147Klac analyzed by confocal microscopy using cells treated without and with oxamate (25 mM, 24 h) or FX-11 (10 μM, 24 h). Left, HEK293T cells co-stained with the anti-ALDOA (red) and anti-ALDOA-147Klac antibodies (green) and Hoechst (Blue) (n = 69 for the control group, n = 68 for the oxamate-treated group and n = 65 for the FX-11-treated group). Right, fluorescence intensity profiles across the indicated lines in the left. Scale bar, 20 μm. e Analysis of the mean fluorescence intensity of whole-cell and nuclear ALDOA-147Klac for cells in (b). (n = 69 for the control group, n = 68 for the oxamate-treated group and n = 65 for the FX-11-treated group). The p value was calculated by one-way ANOVA. f Illustration of site-specific lactylation at ALDOA-K147 inducing subcellular translocation. Created in BioRender. Shao, C. (2024) BioRender.com/r58q841. Source data are provided as a Source Data file.
Fig. 5
Fig. 5. Lactylation on ALDOA induced transcriptional changes in living cells.
a RNA-seq analysis of cells co-transfected with the KlacRS1/tRNACUAPyl pair and ALDOA-147TAG plasmids in the presence or absence of Klac (5 mM, 48 h). Heat map of genes showing significant changes (FC > 1.5 or <0.67 and p value < 0.05 by two-sided Wald test as implemented in DESeq2) by plotting the Log2 FPKM value (n = 40 biological replicates/group). FPKM, fragments per kilobase of transcript per million mapped fragments. b Bar plot of the GO BP analysis of the differentially regulated genes in (a) from Metascape. The p values were calculated using one-sided Fisher’s exact test and adjusted by the Benjamini-Hochberg method. c RT-qPCR analysis of CLDN1, SLITRK6, LRRTM2 and GPBAR1 expression levels using cells in (a). The endogenous β-tubulin gene was used as the internal control for normalizing the target gene levels. Data represent the mean ± S.D. (n = 3 biological replicates/group) and the p value was calculated by one-way ANOVA. d RT-qPCR analysis of ALDOA, CLDN1, SLITRK6, LRRTM2, and GPBAR1 expression levels in HEK293T cells treated with oxamate (25 mM, 24 h) or FX-11 (10 μM, 24 h). Data represent the mean ± S.D. (n = 3 biological replicates/group) and the p value was calculated by one-way ANOVA. e Representive brightfield and immunofluorescence images of HEK293T cells overexpressing (the +Klac group) or not overexpressing (the -Klac group) the EGFP-tagged ALDOA-147Klac (green) due to the availability of Klac (5 mM, 48 h) (n = 40 biological replicates/group). The nucleus was stained with Hoechst (blue) and mCherry (red) serves as the transfection control. Scale bar, 5 μm. f Adhesive cell areas of cells in (e). n = 40 biological replicates/group, and the p value was calculated by unpaired two-tailed Student’s t-test. Source data are provided as a Source Data file.
Fig. 6
Fig. 6. ALDOA recruited different interacting partners after lactylation.
a Immunoblotting confirmed the enrichment of Flag-tagged-ALDOA-WT/147Klac in HEK293T cells under the indicated transfection conditions. The experiments were repeated three times with similar results. b Venn diagrams showing the interacting proteins of ALDOA-WT and ALDOA-147Klac. The interacting proteins of ALDOA-WT were enriched by co-IP using anti-Flag magnetic beads using HEK293T cells transfected with the ALDOA-WT plasmids or vector, quantified by label-free quantification proteomics and screened with a cutoff of FC > 2 and p value < 0.05 by unpaired two-tailed Student’s t test (n = 3 biological replicates/group). The interacting proteins of ALDOA-147Klac were enriched from HEK293T cells co-transfected with the KlacRS1/tRNACUAPyl pair and ALDOA-147TAG in the presence or absence of Klac (5 mM, 48 h), quantified and screened using the same standard as ALDOA-WT (n = 3 biological replicates/group). c GO CC analysis of the interacting proteins in b from DAVID bioinformatics website. The p values were calculated using one-sided Fisher’s exact test and adjusted by the Benjamini-Hochberg method. The lines indicate protein numbers enriched in each cellular component and the bars represent the −Log10 p value. d Network plot of the significantly enriched GO BPs for the interacting proteins of ALDOA-WT and ALDOA-147Klac in (b) using Metascape. Each node represents an enriched term and was colored by p value using the one-sided Fisher’s exact test and adjusted by the Benjamini-Hochberg method. The node size is proportional to the number of input genes falling into that term. GO terms with a similarity >0.3 are connected by edges, and the thickness of the edge represents the similarity score. The network was built with Cytoscape. The red shade indicates that >70% of the proteins enriched in the specific BP were identified only in the ALDOA-147Klac group. If >70% of the enriched proteins in the red-shaded BPs are located in the nucleus, the shades are further framed in red. Blue shade is used to similarly indicate proteins specifically identified in the ALDOA-WT group. Source data are provided as a Source Data file.

References

    1. Zhang, D. et al. Metabolic regulation of gene expression by histone lactylation. Nature574, 575–580 (2019). - PMC - PubMed
    1. Chen, Y. et al. Metabolic regulation of homologous recombination repair by MRE11 lactylation. Cell187, 294–311 (2023). - PMC - PubMed
    1. Wan, N. et al. Cyclic immonium ion of lactyllysine reveals widespread lactylation in the human proteome. Nat. Methods19, 854–864 (2022). - PubMed
    1. Yang, Z. et al. Lactylome analysis suggests lactylation-dependent mechanisms of metabolic adaptation in hepatocellular carcinoma. Nat. Metab.5, 61–79 (2023). - PubMed
    1. Sun, L. et al. Lactylation of METTL16 promotes cuproptosis via m6A-modification on FDX1 mRNA in gastric cancer. Nat. Commun.14, 6523 (2023). - PMC - PubMed

Publication types

Associated data

LinkOut - more resources