. 2025 Jan 8;15(1):4.
doi: 10.1038/s41398-024-03218-x.

Auditory evoked-potential abnormalities in a mouse model of 22q11.2 Deletion Syndrome and their interactions with hearing impairment

Affiliations

Auditory evoked-potential abnormalities in a mouse model of 22q11.2 Deletion Syndrome and their interactions with hearing impairment

Chen Lu et al. Transl Psychiatry. .

Abstract

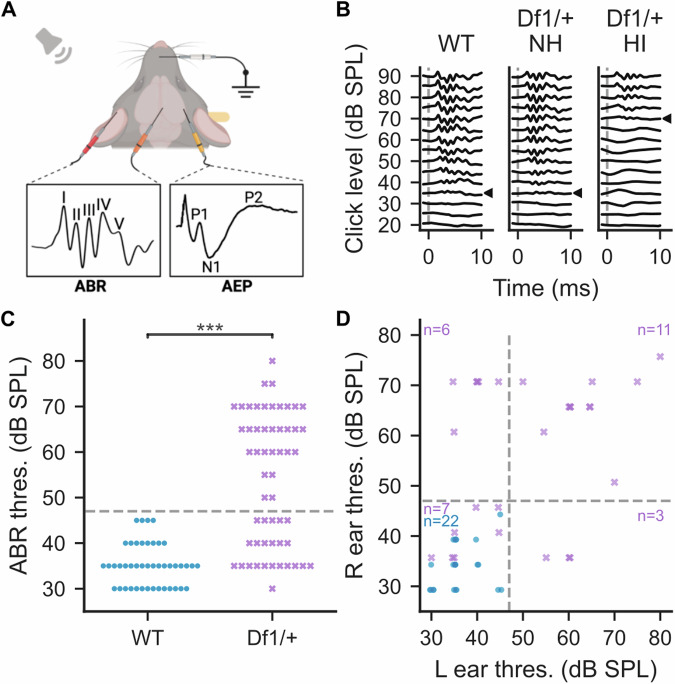
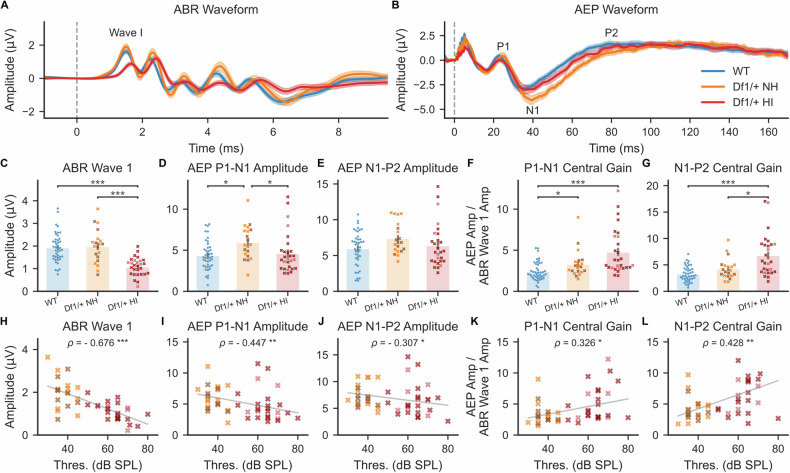
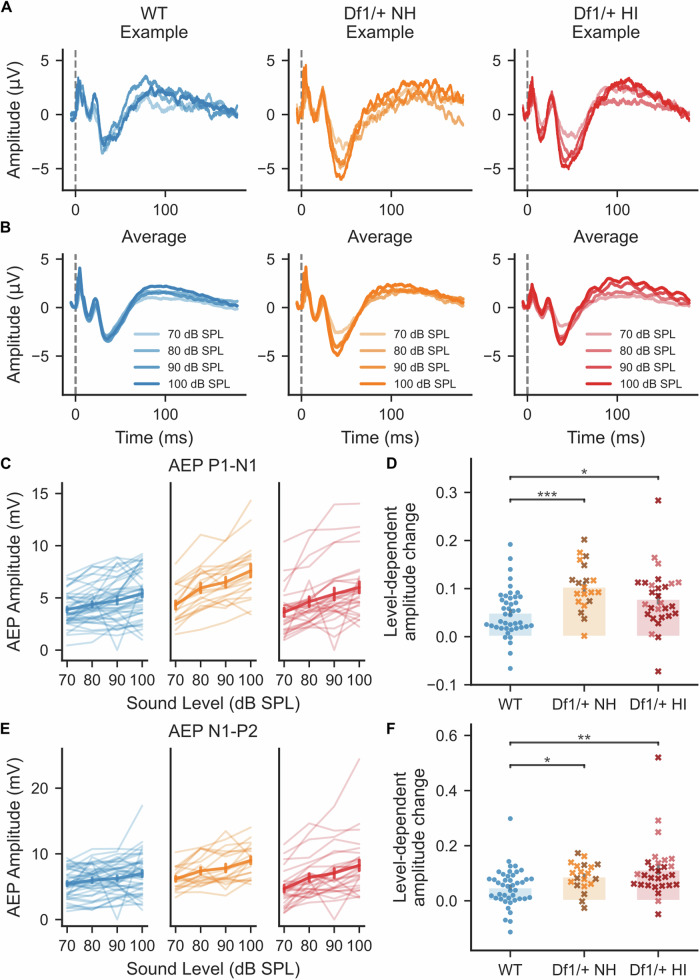
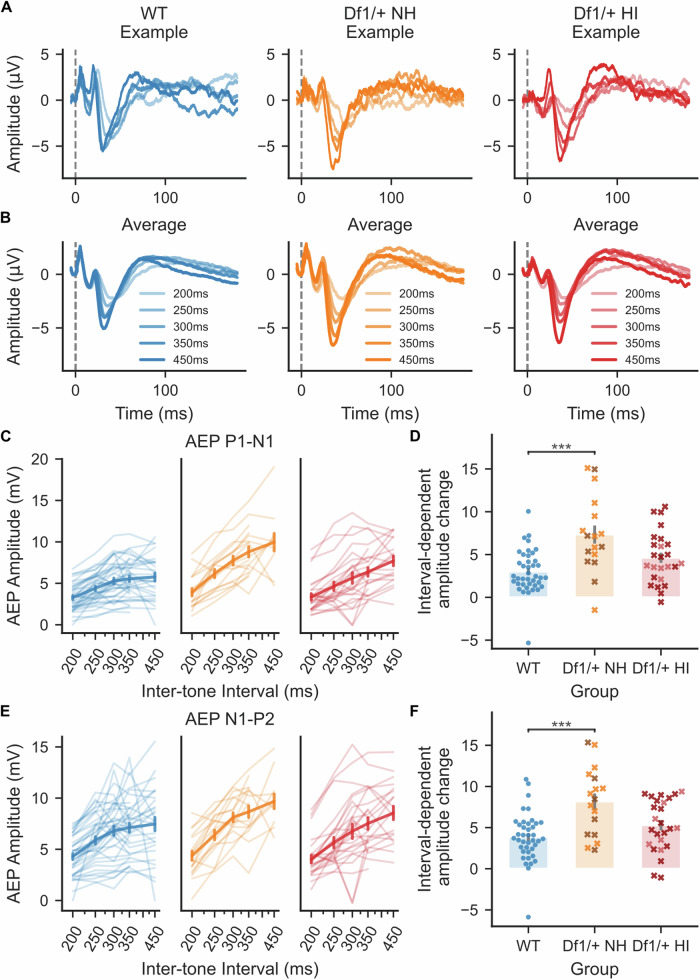
The 22q11.2 deletion is a risk factor for multiple psychiatric disorders including schizophrenia and also increases vulnerability to middle-ear problems that can cause hearing impairment. Up to 60% of deletion carriers experience hearing impairment and ~30% develop schizophrenia in adulthood. It is not known if these risks interact. Here we used the Df1/+ mouse model of the 22q11.2 deletion to investigate how hearing impairment might interact with increased genetic vulnerability to psychiatric disease to affect brain function. We measured brain function using cortical auditory evoked potentials (AEPs), which are commonly measured non-invasively in humans. After identifying one of the simplest and best-validated methods for AEP measurement in mice from the diversity of previous approaches, we measured peripheral hearing sensitivity and cortical AEPs in Df1/+ mice and their WT littermates. We exploited large inter-individual variation in hearing ability among Df1/+ mice to distinguish effects of genetic background from effects of hearing impairment. Central auditory gain and adaptation were quantified by comparing brainstem activity and cortical AEPs and by analyzing the growth of cortical AEPs with increasing sound level or inter-tone interval duration. We found that level-dependent AEP growth was abnormally large in Df1/+ mice regardless of hearing impairment, but other AEP measures of central auditory gain and adaptation depended on both genotype and hearing phenotype. Our results demonstrate the relevance of comorbid hearing loss to auditory brain dysfunction in 22q11.2DS and also identify potential biomarkers for psychiatric disease that are robust to hearing impairment.


Conflict of interest statement

Competing interests: The authors declare no competing interests. Ethics approval and consent to participate: This study involved only animal research. All methods and experiments were performed in accordance with relevant guidelines and regulations of the UCL Animal Welfare and Ethical Review Body and a UK Home Office project licence approved under the United Kingdom Animals (Scientific Procedures) Act of 1986.

Figures

Fig. 1
Fig. 1. Comprehensive review of electrode placement strategies reveals huge variability in approaches used for measurement of auditory evoked potentials (AEPs) in the mouse.
A Electrode positions (red cross, positive electrode; gray circle, negative electrode) used for mouse AEP measurements in 50 publications representative of the diversity of approaches in 115 relevant studies identified through a literature search. Unilateral electrode positions are visualised on the left hemisphere to simplify comparison. B Summary diagram illustrating the range of positive electrode positions used in previous studies. Positive electrodes were most frequently positioned over the auditory cortex (purple), frontal cortex (green), or hippocampus (orange). Red circle above left auditory cortex indicates the positive electrode location used in the present study during acoustic stimulation of the right ear.
Fig. 2
Fig. 2. Experimental setup enables ear-by-ear quantification of peripheral hearing sensitivity.
A ABRs and AEPs were measured with subdermal electrodes in anesthetized mice. B Hearing sensitivity of each ear was quantified by identifying the click-evoked ABR threshold, i.e. the minimum click intensity eliciting a detectable ABR waveform. Three examples are shown, with click-evoked ABR thresholds indicated by arrowheads: left (WT) 35 dB SPL, middle (Df1/+ with normal hearing) 35 dB SPL, right (Df1/+ with hearing impairment) 70 dB SPL. Dashed vertical line indicates click onset. C Distributions of click-evoked ABR thresholds in WT ears (blue circles) and Df1/+ ears (purple crosses). Ears with hearing impairment were defined as those with click-evoked ABR thresholds >2.5 standard deviations above the mean WT threshold (i.e., above 47 dB SPL; dashed line). D Comparison of click-evoked ABR thresholds in the right and left ears; conventions as in C.
Fig. 3
Fig. 3. Abnormalities in central auditory gain in Df1/+ mice are evident even during stimulation of ears with normal hearing but are most pronounced for stimulation of ears with hearing impairment.
Central auditory gain (AEP/ABR amplitude ratio) was elevated in Df1/+ mice for a 16 kHz tone stimulus, and positively correlated with click-evoked ABR threshold. A, B Averaged tone-evoked ABR waveforms measured between tested ear bulla and vertex (A) and AEP waveforms measured from the contralateral hemisphere (B) during monaural stimulation of WT NH, Df1/+ NH, and Df1/+ HI ears with 80 dB SPL, 16 kHz tones. Dashed vertical line indicates stimulus onset. C Tone-evoked amplitude of ABR wave 1 was significantly reduced for Df1/+ HI ears versus Df1/+ NH or WT NH ears. D, E However, cortical AEP waves measured contralateral to the stimulated ear showed a different pattern. Amplitude of the AEP P1-N1 complex was largest for stimulation of Df1/+ NH ears (D); a similar trend was evident for the AEP N1-P2 complex (E). F, G Central gain (tone-evoked contralateral AEP amplitude normalized by tone-evoked ABR wave 1 amplitude) was abnormally elevated for the P1-N1 complex during stimulation of Df1/+ NH ears (F), and for both the P1-N1 and N1-P2 complexes during stimulation of Df1/+ HI ears (F, G). HJ Amplitude of ipsilateral ABR wave 1 (H), contralateral AEP P1-N1 complex (I), or contralateral AEP N1-P2 complex (J) evoked by an 80 dB SPL, 16 kHz tone, versus click-evoked ABR threshold for the stimulated ear. Negative correlation with hearing threshold in the stimulated ear was weaker for tone-evoked AEP than ABR. K, L Central gain of tone-evoked responses was positively correlated with click-evoked ABR threshold for both the P1-N1 complex (K) and N1-P2 complex (L). Each animal typically contributed two data points, one for each ear, with NH or HI status determined separately for each ear based on click-evoked ABR thresholds. Hearing sensitivity in the opposite (unstimulated) ear is indicated by the darkness of symbols: darker symbols indicate cases in which the opposite ear was hearing impaired. Plot conventions: blue circles, WT; yellow cross, Df1/+ NH with normal hearing in the unstimulated ear; brown cross, Df1/+ NH with hearing impairment in the unstimulated ear; red cross, Df1/+ HI with normal hearing in the unstimulated ear; dark red cross, Df1/+ HI with hearing impairment in the unstimulated ear; gray solid line, 2D least-mean-squares best-fit line to the Df1/+ data; asterisks, significance threshold (*p < 0.05, **p < 0.01, ***p < 0.001) for Dunn’s post-hoc tests (CG) or Spearman’s rank correlation tests (HL).
Fig. 4
Fig. 4. Abnormalities in level-dependent AEP growth in Df1/+ mice are robust to hearing impairment in the stimulated ear.
Growth of AEP amplitude with increasing tone intensity was steeper in Df1/+ mice than WT mice, even for stimulation of Df1/+ ears with normal hearing. A, B Example AEP waveforms (A) and average AEP waveforms (B) evoked by a 16 kHz tone presented at different sound intensity levels. C, E AEP amplitudes for the tone-evoked P1-N1 complex (C) and N1-P2 complex (E) grew more steeply with increasing sound level for Df1/+ mice than WT mice, regardless of the hearing status for the stimulated Df1/+ ear. Thin lines represent recordings from contralateral hemispheres of individual ears; thick line with error bars shows mean ± SEM. D, F For both the P1-N1 complex (D) and the N1-P2 complex (F), slopes of level-dependent AEP growth functions were higher for stimulation of either Df1/+ NH or Df1/+ HI ears than for WT NH ears. Plot conventions as in Fig. 3C–G.
Fig. 5
Fig. 5. Abnormalities in repetition suppression in Df1/+ mice are evident during stimulation of ears with normal hearing.
Growth of AEP amplitude with increasing inter-tone interval (ITI) was steeper for stimulation of Df1/+ NH ears than for WT ears. A, B Example AEP waveforms (A) and average AEP waveforms (B) evoked by 80 dB SPL, 16 kHz tones presented at different ITIs. C, E AEP amplitudes for the tone-evoked P1-N1 complex (C) and N1-P2 complex (E) grew more steeply with increasing ITI in Df1/+ mice than WT mice, particularly at longer ITIs. The natural logarithm of ITI was used for analysis to reflect the assumption of exponential decay with increasing ITI in adaptation processes underlying repetition suppression. Note the apparent plateau in AEP amplitude at 300–450 ms ITIs in WT data, and continued growth with ITI in Df1/+ data, especially for stimulation of Df1/+ ears with normal hearing. D, F For both the P1-N1 complex (D) and the N1-P2 complex (F), slopes of interval-dependent AEP growth functions were higher for stimulation of Df1/+ NH ears than WT ears. A similar trend, but no significant difference, was observed for comparison of interval-dependent AEP growth-function slopes for stimulation of Df1/+ HI ears versus WT ears; note however that interpretation of this latter result is complicated by the fact that the fixed-intensity tone stimulus was closer to hearing threshold for Df1/+ HI ears than WT (NH) ears. Plot conventions as in Fig. 4; natural logarithmic x-axis in C and E.

Similar articles

Cited by

References

    1. McDonald-McGinn DM, Sullivan KE, Marino B, Philip N, Swillen A, Vorstman JAS, et al. 22q11.2 deletion syndrome. Nat Rev Dis Primers. 2015;1:15071. - PMC - PubMed
    1. Singh T, Poterba T, Curtis D, Akil H, Al Eissa M, Barchas JD, et al. Rare coding variants in ten genes confer substantial risk for schizophrenia. Nature. 2022;604:509–16. - PMC - PubMed
    1. Zinkstok JR, Boot E, Bassett AS, Hiroi N, Butcher NJ, Vingerhoets C, et al. Neurobiological perspective of 22q11.2 deletion syndrome. Lancet Psychiatry. 2019;6:951–60. - PMC - PubMed
    1. Schneider M, Debbané M, Bassett AS, Chow EWC, Fung WLA, van den Bree M, et al. Psychiatric disorders from childhood to adulthood in 22q11.2 deletion syndrome: results from the International Consortium on Brain and Behavior in 22q11.2 Deletion Syndrome. Am J Psychiatry. 2014;171:627–39. - PMC - PubMed
    1. Monks S, Niarchou M, Davies AR, Walters JTR, Williams N, Owen MJ, et al. Further evidence for high rates of schizophrenia in 22q11.2 deletion syndrome. Schizophr Res. 2014;153:231–6. - PubMed

LinkOut - more resources