. 2025 Jan 8;16(1):512.
doi: 10.1038/s41467-024-55667-z.

Pan-inhibition of super-enhancer-driven oncogenic transcription by next-generation synthetic ecteinascidins yields potent anti-cancer activity

Affiliations

Pan-inhibition of super-enhancer-driven oncogenic transcription by next-generation synthetic ecteinascidins yields potent anti-cancer activity

Max Cigrang et al. Nat Commun. .

Abstract

The plasticity of cancer cells facilitates their ability to adopt heterogeneous differentiation states, posing a significant challenge to therapeutic interventions. Specific gene expression programs, driven in part by super-enhancers (SEs), underlie cancer cell states. Here we successfully inhibit SE-driven transcription in phenotypically distinct metastatic melanoma cells using next-generation synthetic ecteinascidins. Through functional genomic methodologies, we demonstrate that these compounds inhibit the expression of genes encoding lineage-specific or ubiquitous transcription factors/coactivators by selectively targeting the CpG-rich sequences within their promoters and/or enhancers. This prevents the formation of transcription factor/coactivator condensates necessary for SE-dependent gene expression. Consequently, these compounds exhibit cytotoxic activity across distinct subpopulations of metastatic melanoma cells and inhibit tumor proliferation, including those resistant to current therapies. These findings extend to other cancers, like small cell lung cancer, recently approved for ecteinascidin-based treatment. Overall, our study provides preclinical proof that pan-inhibition of SE-dependent genes with synthetic ecteinascidins is a promising therapeutic approach for tumors with heterogeneous transcriptional landscapes.


Conflict of interest statement

Competing interests: PA and C-Cuevas are PharmaMar S.A employees and shareholders. MJGN, MMD, GSM are PharmaMar employees. The remaining authors declare no competing interests.

Figures
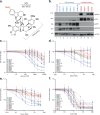
Fig. 1
Fig. 1. Metastatic melanoma cells show high sensitivity to lurbinectedin.
a Chemical structure of lurbinectedin, the first-in-class synthetic ecteinascidin containing tetrahydroisoquinoline subunits. The moiety of the molecule interacting with DNA is indicated. Molecular Weight (MW) is indicated. b Protein lysates from either the immortalized Hermes3A melanocytes, differentiated melanoma cells 501mel, MM011, MM074, MM117, IGR37 and SKMel-28 or undifferentiated melanoma cells MM029, MM047, MM099 and IGR39 were immuno-blotted for proteins as indicated. Molecular mass of the proteins is indicated (kDa). Source data are provided as a Source Data file. This experiment was repeated independently three times with similar results. cf Indicated melanoma cells were treated with increasing concentrations of vemurafenib c, dabrafenib d, trametinib e, or lurbinectedin f for 72 h. Mean growth is shown relative to vehicle (DMSO)-treated cells. Error bars indicate mean values +/− Standard Deviation (SD) for three biological triplicates. Differentiated (MITF-High, proliferative) melanoma cells are shown in blue, while undifferentiated (MITF-low, invasive) melanoma cells are shown in red. Hyperpigmented melanoma cells with acquired resistance to vemurafenib are shown in green. Immortalized Hermes3A melanocytes, skin keratinocyte HaCaT and embryonic fibroblastic MRC5 cells are shown in violet. Source data are provided as a Source Data file.
Fig. 2
Fig. 2. Metastatic melanoma cells show high sensitivity to next-generation synthetic ecteinascidins.
a, b Chemical structure of ecubectedin a and PM54 b, two next-generation synthetic ecteinascidins analogs of lurbinectedin. The modifications are highlighted in red. The moiety of the molecule interacting with DNA is indicated. Molecular Weight (MW) is indicated. c, d Indicated melanoma cells were treated with increasing concentrations of ecubectedin c or PM54 d, for 72 h. Mean growth is shown relative to vehicle (DMSO)-treated cells. Error bars indicate mean values ± Standard Deviation (SD) for three biological triplicates. Differentiated (MITF-High, proliferative) melanoma cells are shown in blue, while undifferentiated (MITF-low, invasive) melanoma cells are shown in red. Hyperpigmented melanoma cells with acquired resistance to vemurafenib are shown in green. Immortalized Hermes3A melanocytes, skin keratinocyte HaCaT and embryonic fibroblastic MRC5 cells are shown in violet. Source data are provided as a Source Data file.
Fig. 3
Fig. 3. Synthetic ecteinascidins induce cell cycle arrest and apoptosis.
a Metastatic melanoma cells were treated with either vehicle (DMSO), lurbinectedin, ecubectedin or PM54 (1xIC50 concentration, 48 h) and allowed to grow for additional 10 days in the absence of drugs. Results are shown as the mean colony numbers ± SD for three biological triplicates. Ordinary one-way ANOVA using Dunnett’s multiple comparisons test was used to determine the p-values (vs. DMSO). Source data are provided as a Source Data file. b Metastatic melanoma cells were incubated with CellTrace and subsequently treated with either vehicle (DMSO), lurbinectedin, ecubectedin or PM54 (1xIC50 concentration, 72 h). Quantifications of populations with high CellTrace signal in DMSO or drug-treated cells are shown as mean values ± SD for three biological triplicates. Proliferative cells show low CellTrace signal while non proliferative cells show high CellTrace signal. Ordinary one-way ANOVA using Dunnett’s multiple comparisons test was used to determine the p-values (vs. DMSO). Source data are provided as a Source Data file. c 501mel cells were treated with either vehicle (DMSO), lurbinectedin, ecubectedin or PM54 (1xIC50 concentration, 72 h). Cell cycle was studied by propidium iodide staining and flow cytometry, and results are shown as mean values ± SD for three biological triplicates. Source data are provided as a Source Data file. d Metastatic melanoma cells were treated with either vehicle (DMSO), lurbinectedin, ecubectedin or PM54 (1xIC50 concentration, 72 h). Apoptosis was studied by flow cytometry using annexin V-APC staining. Results are shown as mean values ± SD for three biological triplicates. Ordinary one-way ANOVA using Dunnett’s multiple comparisons test was used to determine the p-values (vs. DMSO). Source data are provided as a Source Data file. e MM029 and MM099 metastatic melanoma cells were treated with either vehicle (DMSO), lurbinectedin, ecubectedin or PM54 (1xIC50 concentration, 48 h). Invasion was determined using Boyden chamber assays. Results are shown as mean values of coverage index +/- SD for three biological triplicates. Ordinary one-way ANOVA using Dunnett’s multiple comparisons test was used to determine the p-values (vs. DMSO). Source data are provided as a Source Data file.
Fig. 4
Fig. 4. Potent in vivo effects of synthetic ecteinascidins.
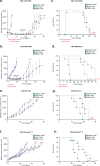
a,b Indicated CDX models (n = 10 at the beginning of the experiment) from LOX-IMVI a or WM-266-4 b melanoma cells were treated with placebo, ecubectedin or PM54 at 1.2 mg/kg once a week for 3 consecutive weeks (on days 0, 7 and 14) and tumor volumes were measured. Results are shown as mean values ± SD for “n” mice. The red bar indicates the dose period. The latency phase is indicated by an arrow. Logrank (Mantel–Cox) test was used to determine the p-values. Source data are provided as a Source Data file. c, d Indicated CDX models (n = 10 at the beginning of the experiment) from LOX-IMVI c or WM-266-4 d melanoma cells were treated weekly with Placebo, ecubectedin or PM54 at 1.2 mg/kg and survival was assessed. Results are shown as mean values ± SD for “n” mice. The red bar indicates the dose period. The latency phase is indicated by an arrow. Logrank (Mantel–Cox) test was used to determine the p-values. Source data are provided as a Source Data file. e, f Indicated CDX models (n = 8 at the beginning of the experiment) from 501mel e or 501melVemuR f melanoma cells were treated once with Placebo, ecubectedin or PM54 at 1.2 mg/kg and tumor volumes were measured. Results are shown as mean values ± SD for “n” mice. Logrank (Mantel–Cox) test was used to determine the p-values. Source data are provided as a Source Data file. g, h Indicated CDX models (n = 8 at the beginning of the experiment) from 501mel g or 501melVemuR h melanoma cells were treated once with Placebo, ecubectedin or PM54 at 1.2 mg/kg and survival was assessed. Results are shown as mean values ± SD for “n” mice. Logrank (Mantel–Cox) test was used to determine the p-values. Source data are provided as a Source Data file.
Fig. 5
Fig. 5. Synthetic ecteinascidins inhibit the expression of SE-dependent genes.
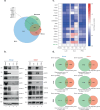
a Venn diagram showing the overlap of genes down-regulated in melanoma (GSE256100), SCLC (GSE179074) and NSCLC (GSE179074), following treatment with lurbinectedin. b Differentiated 501mel (left) or undifferentiated MM029 (right) melanoma cells were treated with synthetic ecteinascidins as indicated (5xIC50 concentration, 24 h) and protein lysates were immuno-blotted for proteins as indicated. Molecular mass of the proteins is indicated (kDa). Source data are provided as a Source Data file. This experiment was repeated independently three times with similar results. c CDXs from 501mel cells (n = 3) were treated with a single dose of lurbinectedin, ecubectedin or PM54 at 1.2 mg/kg and tumors were collected 12 or 24 h later. Heatmap shows average placebo-normalized expression of the indicated genes obtained by qRT-PCR analysis. RPL13a is a housekeeping gene. d Venn diagram showing the overlap of genes downregulated by synthetic ecteinascidins, as indicated, in 501mel (left) or MM029 cells (right) (10xIC50 concentration, 8 h) (n = 3) and SE-dependent genes identified in these cells using H3K27ac- and BRD4-profiling by Cut&Tag and the ROSE algorythm. Representation factor and hypergeometric p-value are indicated and were determined using Graeber lab software. Hypergeometric distribution test was used to determine the p-values.
Fig. 6
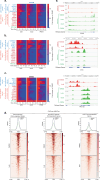
Fig. 6. Synthetic ecteinascidins bind to CpG-rich sequences located in open chromatin regions.
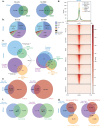
a Venn diagram of drug-binding sites (Bio-lurbi in the left and Bio-PM54 in the right) in 501mel vs. MM029 cells (n = 3). b Pie chart showing the distribution of annotated peaks (in percentages) for Bio-lurbi (top) and Bio-PM54 (bottom) all over the genome (hg19) in 501mel cells (n = 3). c Left panel: Venn diagram (n = 3) between promoters bound by Bio-lurbi or Bio-PM54 and genes down-regulated by lurbinectedin or PM54 in 501mel cells. Right panel: the two Venn diagrams (n = 3) were merged. Representation factor and hypergeometric p-value are indicated and were determined using Graeber lab software. Hypergeometric distribution test was used to determine the p-values. d Upper panel: Metaplot distribution (n = 3) of Bio-lurbi, Bio-PM54, BRD4, RNAPII, H3K27ac, H3K27me3 enrichment and ATAC-Seq signals in a ± 5 kb window around the occupied DNA binding sites of Bio-lurbi in differentiated 501mel cells. Lower panel: Heatmap profiles representing the read density clusterings obtained with seqMINER for the DNA-occupied sites of Bio-lurbi in differentiated 501mel cells relative to Bio-PM54, BRD4, RNAPII, H3K27ac, H3K27me3 enrichments and ATAC-Seq signals. Peak order is determined by Bio-lurbi and identical for all clusterings. e Venn diagram (n = 3) between Bio-lurbi (left) or Bio-PM54 (right) binding sites and positive ATAC-seq peaks (indicative of chromatin open regions) in differentiated 501mel cells. f Venn diagram (n = 3) between Bio-lurbi (left) or Bio-PM54 (right) binding sites and human CpG islands in differentiated 501mel cells. g Venn diagram (n = 3) between Bio-lurbi (left) and Bio-PM54 (right) binding sites in differentiated 501mel cells and human CpG islands. Human CpG islands are divided into those found in open chromatin regions (CpG islands/ATAC(+)) and those found in closed chromatin regions (CpG islands/ATAC(−)).
Fig. 7
Fig. 7. Synthetic ecteinascidins exhibit distinct patterns of chromatin binding associated with cell phenotypes.
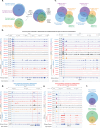
a Left panel: Venn diagrams (n = 3) between promoters bound by Bio-lurbi and Bio-PM54 in 501mel (top) and MM029 (bottom) cells. Right panel: the two Venn diagrams were merged. b Gene tracks of Bio-lurbi, Bio-PM54, RNAPII, H3K27ac occupancy, ATAC-seq and RNA-Seq signals at CDK7 (left) or EP300 (right) loci in 501mel or MM029 cells. RNA-Seq signals show that these genes are expressed in both 501mel and MM029 melanoma cells. In blue, drug binding at promoters is highlighted. Localization of CpG islands is shown. c Left panel: Venn diagrams (n = 3) comparing genomic bindings sites uniquely bound by Bio-lurbi in either 501mel or MM029 cells with H3K27ac peaks found exclusively in either 501mel or MM029 cells. Right panel: Venn diagrams comparing genomic bindings sites uniquely bound by Bio-PM54 in either 501mel or MM029 cells with H3K27ac peaks found exclusively in either 501mel or MM029 cells. We considered different peaks as overlapping if there was at least 1 bp of overlap. d Gene tracks of Bio-lurbi, Bio-PM54, RNAPII, H3K27ac occupancy, ATAC-seq and RNA-Seq signals at the MITF locus in 501mel or MM029 cells. RNA-Seq signals show that this gene is only expressed in differentiated 501mel cells. The red square indicates the SE regulating the expression of MITF. In blue, drug binding at the promoter is highlighted. In red, drug binding at the SE is highlighted. Localization of CpG islands is shown. Note that MITF-M isoform is expressed in melanoma. e Gene tracks of Bio-lurbi, Bio-PM54, RNAPII, H3K27ac occupancy, ATAC-Seq and RNA-Seq signals at the BIRC3 locus in 501mel or MM029 cells. RNA-Seq signals show that this gene is only expressed in undifferentiated MM029 melanoma cells. In blue, drug binding at the promoter is highlighted. Localization of CpG islands is shown. f Upper panel: Venn diagrams (n = 3) comparing all genomic bindings sites commonly bound by Bio-lurbi and Bio-PM54 and bona fide super-enhancers identified in 501mel cells. Lower panel: Venn diagrams comparing all genomic bindings sites commonly bound by Bio-lurbi and Bio-PM54 and bona fide super-enhancers identified in MM029 cells.
Fig. 8
Fig. 8. Synthetic ecteinascidins disrupt transcription factor/coactivator condensates at SEs.
a Representative confocal microscopy images (n = 3) of 501mel melanoma cells treated with either DMSO, the condensate disruptor 1,6-hexanediol (3% vol, 20 min), the MEKi trametinib (15 nM, 10 h), the DNA damaging agent dacarbazine (50 μM, 10 h) or the synthetic ecteinascidins (5xIC50, 10 h). Cells were immunostained with anti-BRD4 (red) or anti-MED1 (white) antibodies. Images of the cells were obtained with the same microscopy system and constant acquisition parameters for a given staining. Source data are provided as a Source Data file. Scale bar: 10 μm. b The numbers of MED1 and BRD4 foci per nucleus observed in 501mel cells following treatment with the drugs described above are shown ± SD for three biological triplicates. Red bars indicate mean integrated density. One-way ANOVA with post-hoc Tukey adjustment comparisons were used to determine the p-values (vs. DMSO). c, d ChIP-qPCR monitoring the fold change of H3K27ac mark or BRD4 protein at the SEs regulating MITF (left) or SOX10 (right) in mock- or synthetic ecteinascidin-treated (5xIC50, 10 h) differentiated 501mel cells. Error bars indicate mean values ± SD for three biological triplicates. One-way ANOVA with post-hoc Tukey adjustment comparisons were used to determine the p-values (vs. DMSO). Source data are provided as a Source Data file.
Fig. 9
Fig. 9. Transcriptional inhibition waves induced by synthetic ecteinascidins in melanoma and SCLC cells.
a, b Heatmap showing average 18S-normalized expression (n = 3) of the indicated genes in 501mel a and MM029 b cells treated with either lurbinectedin, ecubectedin or PM54 (5xIC50 concentration) for the indicated period of time. Results were obtained by RT-qPCR and are shown as relative expression compared to DMSO-treated cells. RPL13a is a housekeeping gene. c Heatmap showing average 18S-normalized expression (n = 3) of the indicated genes in DMS53 cells (SCLC) treated with synthetic ecteinascidins (5xIC50 concentration (IC50 = 0.11 nM for lurbinectedin, 0.16 nM for ecubectedin and 0.15 nM for PM54)) for the indicated period of time. Results were obtained by RT-qPCR and are shown as relative expression compared to DMSO-treated cells. RPL13a is a housekeeping gene. d Upper panel: This analysis (n = 3) focuses on three gene sets: (1) genes commonly downregulated after treatment in melanoma, SCLC, and NSCLC cells, (2) putative super-enhancer-dependent genes in DMS53 SCLC cells, and (3) genes whose expression exhibited a fold change between 0.9 and 1.1 relative to DMSO, which we considered unaffected by the treatment (GSE195663). These sets comprised 648, 424, and 8435 genes, respectively. From these genes, we selected only the genes presenting H3K27ac peaks located at their transcription start sites (TSS), yielding 348 genes for the commonly downregulated genes across the three cancers, 424 for the SCLC super-enhancer-dependent genes, and 1434 for the unaffected genes (see Supplementary Data 7). Metaplot distribution shows H3K27ac signal in a ± 5 kb window around the TSS of these three groups of genes in mock- or lurbinectedin-treated DMS53 cells (GSE179074). Lower panel: Heatmap profiles representing the read density clusters obtained with seqMINER for the H3K27ac signal. e Gene tracks showing H3K27ac occupancy and RNA-Seq signals (n = 3) at the CDK8 (top), MYC (middle) and RPL13a (bottom) loci in mock- or lurbinectedin-treated DMS53 cells.

References

    1. Bradner, J. E., Hnisz, D. & Young, R. A. Transcriptional Addiction in Cancer. Cell168, 629–643 (2017). - PMC - PubMed
    1. Sengupta, S. & George, R. E. Super-Enhancer-Driven Transcriptional Dependencies in Cancer. Trends Cancer3, 269–281 (2017). - PMC - PubMed
    1. Zanconato, F. et al. Transcriptional addiction in cancer cells is mediated by YAP/TAZ through BRD4. Nat. Med24, 1599–1610 (2018). - PMC - PubMed
    1. Hogg, S. J., Beavis, P. A., Dawson, M. A. & Johnstone, R. W. Targeting the epigenetic regulation of antitumour immunity. Nat. Rev. Drug Discov.19, 776–800 (2020). - PubMed
    1. Vervoort, S. J. et al. Targeting transcription cycles in cancer. Nat. Rev. Cancer22, 5–24 (2022). - PubMed

MeSH terms

Substances