. 2025 Jan 8;16(1):486.
doi: 10.1038/s41467-024-55808-4.

Structural basis of THC analog activity at the Cannabinoid 1 receptor

Affiliations

Structural basis of THC analog activity at the Cannabinoid 1 receptor

Thor S Thorsen et al. Nat Commun. .

Abstract

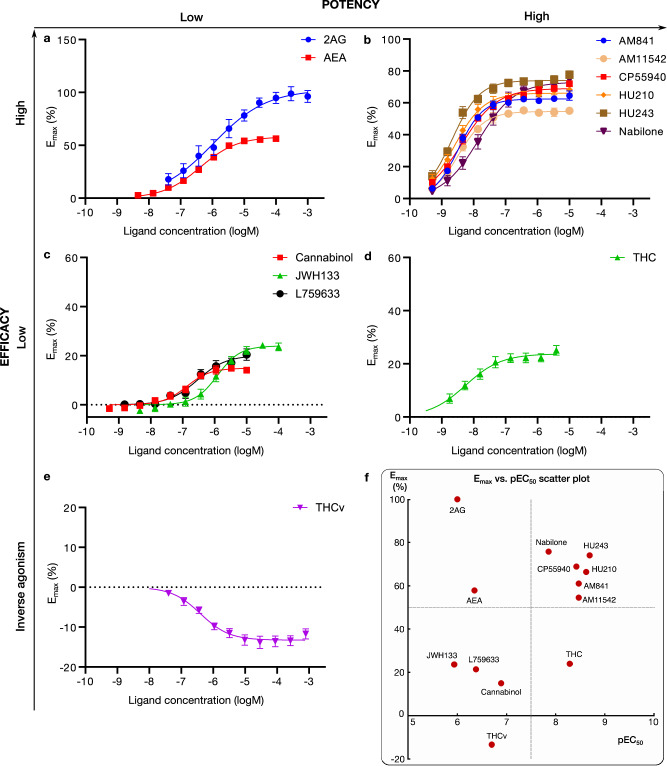
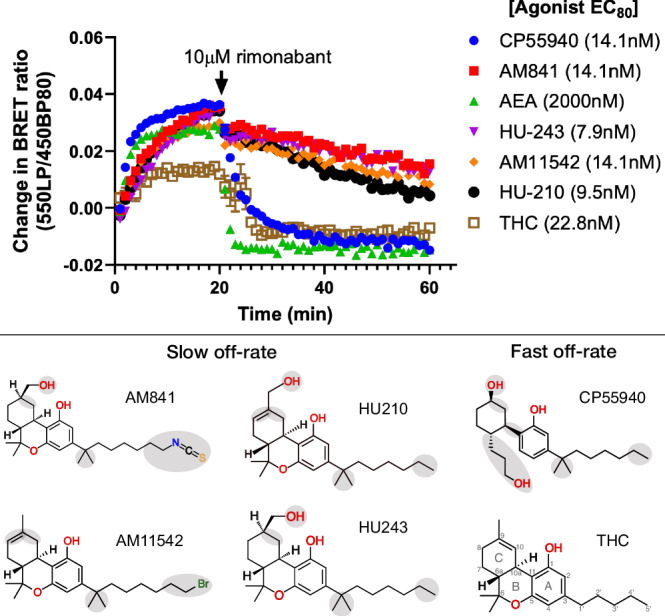
Tetrahydrocannabinol (THC) is the principal psychoactive compound derived from the cannabis plant Cannabis sativa and approved for emetic conditions, appetite stimulation and sleep apnea relief. THC's psychoactive actions are mediated primarily by the cannabinoid receptor CB1. Here, we determine the cryo-EM structure of HU210, a THC analog and widely used tool compound, bound to CB1 and its primary transducer, Gi1. We leverage this structure for docking and 1000 ns molecular dynamics simulations of THC and 10 structural analogs delineating their spatiotemporal interactions at the molecular level. Furthermore, we pharmacologically profile their recruitment of Gi and β-arrestins and reversibility of binding from an active complex. By combining detailed CB1 structural information with molecular models and signaling data we uncover the differential spatiotemporal interactions these ligands make to receptors governing potency, efficacy, bias and kinetics. This may help explain the actions of abused substances, advance fundamental receptor activation studies and design better medicines.


Conflict of interest statement

Competing interests: D.E.G. is a part-time employee and warrant-holder at Kvantify. D.A.S and D.B.V. are both founders and directors of Z7 Biotech Ltd, an early-stage drug discovery CRO. The remaining authors declare that the research was conducted in the absence of any commercial or financial relationships that could be construed as a potential conflict of interest.

Figures

Fig. 1
Fig. 1. Active state CB1 structures – completeness and complexes with Gi and THC analogs.
a Cryo-EM density map (sharpened) of the HU210/CB1/Gi1 signaling complex. b CB1-Gi complexes,,, superposed based on the seven transmembrane helix backbone atoms. N-terminal (c) and TM5 (d) segments uniquely covered by the HU210/CB1/Gi1 structure. The shown residues are the terminal residue in each structure. Extracellular (e) and (f) side views of THC analog/CB1 structure complexes. g Structure similarity tree of active state CB1 structures based on a conformational clustering in GPCRdb making a superposition-independent all-to-all residue distance comparisons across the transmembrane domain.
Fig. 2
Fig. 2. G protein recruitment of THC analogs and endogenous agonists via CB1.
Ligand concentration-response curves for (a) low-potency/high-efficacy agonists, (b) high-potency/high-efficacy agonists, (c) low-potency/low-efficacy agonists, (d) high-potency/low-efficacy agonist, and (e) inverse agonist, from mGi recruitment. f Scatter plot of ligand pEC50 (x-axis) and Emax (y-axis) in the mGi experiments. HEK293-TR cells stably co-expressing a combination of either the CB1-NlucC and NES-venus-mGsi or NES-venus-β-arrestin were used. Recruitment data, expressed as a % of the maximal response produced by the endogenous cannabinoid 2AG, is plotted versus log concentration for the indicated ligands. Data were fitted to a four-parameter logistic equation; mean ± S.E.M. of at least 3 independent experiments. N-values for the individual ligand CRCs are: 2AG (6), AEA (9), AM841 (6), AM11542 (6), CP55940 (17), HU210 (6), HU243 (6), Nabilone (6), Cannabinol (6), JWH133 (5), L759633 (3), THC (12) and THCv (6).
Fig. 3
Fig. 3. Structure-activity relationships of studied THC analogs.
Scatter plot of ligand pEC50 (x-axis) and Emax (y-axis) in the mGi experiments. Dotted lines divide the plot into quadrants of low/high pEC50/Emax. For THC analogs, the 2D structure is shown next to the data points.
Fig. 4
Fig. 4. Spatiotemporal THC analog/CB1 interactions.
a Left: Spatial distribution of the 25 CB1 residues interacting with HU210 (pink), AM84117 (blue), AM1154216 (yellow), and CP5594018 (green). Right: The three subsites accommodating the tetrahydrocannabinol, alkyl branch, and alkyl tail, respectively. Pocket residues are shown as Cα spheres and labeled with generic residue numbers facilitating comparison of structurally corresponding positions across receptors. b Ligand-receptor interaction fingerprints denoting interactions, type, and CB1 generic residue positions. Interaction labels indicate receptor-ligand contacts in pre-MD starting structure/model (see Methods). Grayscale illustrates frequencies of interactions (%) throughout simulations, averaged across three replicates. Five CB1 residue positions marked “N-ter” and “ECL2” lack a generic residue number because they are not structurally conserved across receptors. c Differences in contact frequencies (in % averaged across three replicates) of THC analogs relative to THC (reference) at each receptor residue. Positive values (blue cells) indicate contact frequencies greater than those in THC, whereas negative values (red cells) indicate contact frequencies lesser than those in THC.
Fig. 5
Fig. 5. Structural determinants of ligand activity observed in MD simulations.
Visual representations of ligand-receptor interactions from MD simulations that are key determinants of their structure-activity relationship. a Conformation of the elongated alkyl tail of AM841 in comparison with THC. b Binding mode of CP55940 depicting the unique hydrogen bond interaction between the 6a hydroxypropyl and the sidechain of S1732x60. ce Binding modes of low-potency/low-efficacy THC analogs (JWH133, L759633, and Cannabinol, respectively) in comparison with THC. f Conformational differences in THC analogs having different hybridization states at C9 carbon of the C-ring; HU210 (sp2) and AM841 (sp3) are shown as representative analogs. g Superposition of THCv conformations indicating binding flexibility.
Fig. 6
Fig. 6. Structure-kinetics relationships of THC analogs studied for reversibility of agonist activity (mGi recruitment) upon addition of the CB1 antagonist rimonabant.
The plot shows the change in basal BRET upon addition of agonist (0 min, EC80 concentration) and rimonabant (20 min, 10 μM). Data from HEK293-TR cells stably expressing CB1-Nluc and NES-venus-mGi. The number of observations (n) is 6 for each of the individual ligand dissociation curves except for THC (n = 5). Data plotted is mean ± S.E.M. THC as a partial agonist has a relatively small response; therefore, the visible error bars correspond to an “addition artifact” which is more apparent for this ligand.

Update of

Similar articles

Cited by

References

    1. Maccarrone, M. et al. Endocannabinoid signaling at the periphery: 50 years after THC. Trends Pharmacol. Sci.36, 277–296 (2015). - PMC - PubMed
    1. Maccarrone, M. et al. Goods and bads of the endocannabinoid system as a therapeutic target: lessons learned after 30 years. Pharmacol. Rev.75, 885–958 (2023). - PMC - PubMed
    1. Schutz, S. G., Dunn, A., Braley, T. J., Pitt, B. & Shelgikar, A. V. New frontiers in pharmacologic obstructive sleep apnea treatment: a narrative review. Sleep. Med. Rev.57, 101473 (2021). - PubMed
    1. Fine, P. G. & Rosenfeld, M. J. The endocannabinoid system, cannabinoids, and pain. Rambam Maimonides Med. J.4, e0022 (2013). - PMC - PubMed
    1. Nielsen, S. et al. The use of cannabis and cannabinoids in treating symptoms of multiple sclerosis: a systematic review of reviews. Curr. Neurol. Neurosci. Rep.18, 8 (2018). - PubMed

LinkOut - more resources