

Impact of obesity on iron metabolism and the effect of intravenous iron supplementation in obese patients with absolute iron deficiency
- PMID: 39779726
- PMCID: PMC11711491
- DOI: 10.1038/s41598-024-84498-7
Impact of obesity on iron metabolism and the effect of intravenous iron supplementation in obese patients with absolute iron deficiency
Abstract
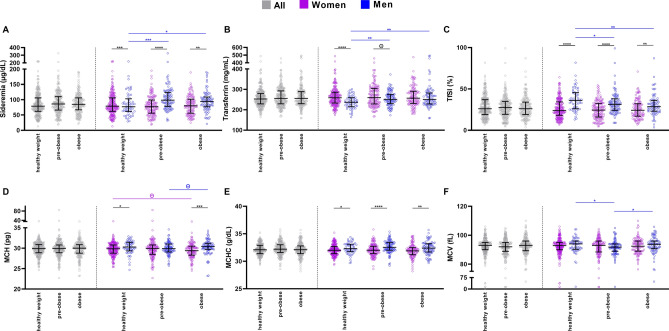
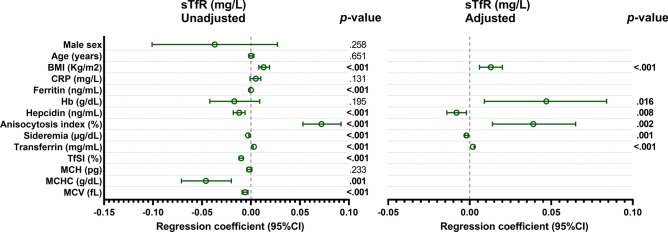
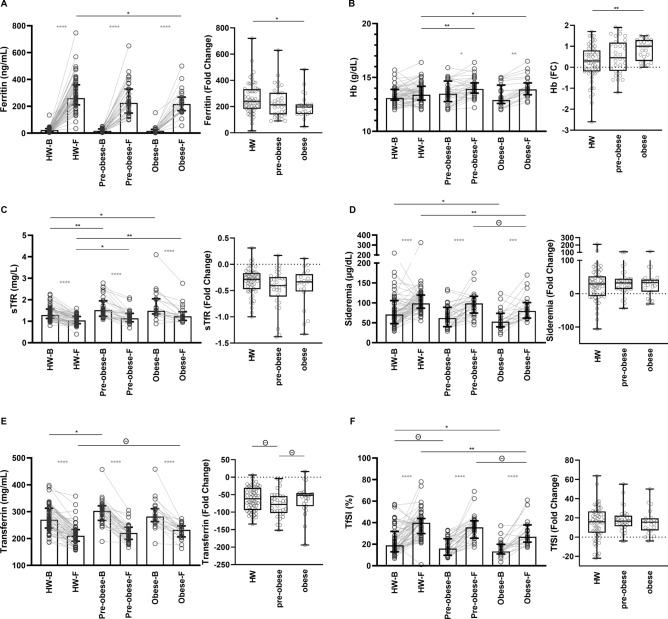
Obesity and iron deficiency (ID) are widespread health issues, with subclinical inflammation in obesity potentially contributing to ID through unclear mechanisms. The aim of the present work was to elucidate how obesity-associated inflammation disturb iron metabolism and to investigate the effect of intravenous (IV) iron supplementation on absolute iron deficient pre-obese (BMI 25.0-29.9 kg/m2) and obese (BMI > 30 kg/m2) individuals compared to healthy weight (HW) group (BMI 18.5-24.9 kg/m2). Iron-related, hematological and inflammatory biomarkers along with erythropoietin (EPO) were studied based on body mass index (BMI) in a Spanish cohort of non-anemic participants (n = 721; 67% women; median age of 48 years [IQR: 39-57]) and in a subgroup of subjects (n = 110) with absolute ID (ferritin < 50 ng/mL) after completing an IV iron therapy. Obese group exhibited higher levels of ferritin, hemoglobin (Hb), soluble transferrin receptor (sTfR) and hepcidin compared to HW group. Elevated BMI was independently associated with increased sTfR levels. While no statistical differences were found in EPO among groups, obese showed increased levels that inversely correlated with Hb only in pre-obese and obese groups. IV iron therapy on obese participants had significant improvements on iron-related parameters and Hb levels. Notable obesity-associated disturbances in iron metabolism are described and indicate a mixed ID among both, women and men. These findings highlight the importance of tailored interventions to correctly address ID in obese population.
Keywords: Hemoglobin; Inflammation; Iron deficiency; Iron metabolism; Obesity.
© 2025. The Author(s).
Conflict of interest statement
Declarations. Competing interests: The authors declare no competing interests. Ethical approval: The study was approved by the ethic committee of Hospital Universitario La Paz in Madrid (PI-4636). Written informed consent was obtained from all HIV participants before inclusion in CoRISpe-FARO and from all HD before inclusion in the study.
Figures


Similar articles
-
Real-world experience of intravenous iron sucrose supplementation and dynamics of soluble transferrin receptor and hepcidin in a Spanish cohort of absolute iron deficient patients.Biomed Pharmacother. 2023 Nov;167:115510. doi: 10.1016/j.biopha.2023.115510. Epub 2023 Sep 25. Biomed Pharmacother. 2023. PMID: 37757490
-
Elevated Hepcidin Is Part of a Complex Relation That Links Mortality with Iron Homeostasis and Anemia in Men and Women with HIV Infection.J Nutr. 2015 Jun;145(6):1194-201. doi: 10.3945/jn.114.203158. Epub 2015 Apr 22. J Nutr. 2015. PMID: 25904736 Free PMC article.
-
Relationships between Maternal Obesity and Maternal and Neonatal Iron Status.Nutrients. 2018 Jul 30;10(8):1000. doi: 10.3390/nu10081000. Nutrients. 2018. PMID: 30061547 Free PMC article.
-
Association between overweight/obesity and iron deficiency anaemia among women of reproductive age: a systematic review.Public Health Nutr. 2024 Sep 26;27(1):e176. doi: 10.1017/S1368980024001794. Public Health Nutr. 2024. PMID: 39324337 Free PMC article.
-
[Biological diagnosis of iron deficiency in children].Arch Pediatr. 2017 May;24(5S):5S6-5S13. doi: 10.1016/S0929-693X(17)24003-2. Arch Pediatr. 2017. PMID: 28622783 Review. French.
Cited by
-
Ferritin as an Inflammatory Marker in Pediatric Metabolic Syndrome: Links to Obesity and Liver Ultrasound Alterations.Int J Mol Sci. 2025 Apr 17;26(8):3793. doi: 10.3390/ijms26083793. Int J Mol Sci. 2025. PMID: 40332421 Free PMC article.
References
-
- Cappellini, M. D., Musallam, K. M. & Taher, A. T. Iron deficiency anaemia revisited. J. Intern. Med.287, 153–170 (2020). - PubMed
-
- Chooi, Y. C., Ding, C. & Magkos, F. The epidemiology of obesity. Metabolism92, 6–10 (2019). - PubMed
-
- Myint, P. K., Kwok, C. S., Luben, R. N., Wareham, N. J. & Khaw, K.-T. Body fat percentage, body mass index and waist-to-hip ratio as predictors of mortality and cardiovascular disease. Heart100, 1613–1619 (2014). - PubMed
-
- Hutchinson, C. A review of iron studies in overweight and obese children and adolescents: A double burden in the young?. Eur. J. Nutr.55, 2179–2197 (2016). - PubMed
Publication types
MeSH terms
Substances
Grants and funding
- CB21/13/00077/Centro de Investigación Biomédica en Red de Enfermedades Infecciosas (CIBERINFEC), Madrid, Spain
- CB21/13/00077/Centro de Investigación Biomédica en Red de Enfermedades Infecciosas (CIBERINFEC), Madrid, Spain
- CP23/00009/Instituto de Salud Carlos III (ISCIII) through the Miguel Servet Program, Madrid, Spain
- CM22/00198/Instituto de Salud Carlos III (ISCIII) through the Río Hortega Program, Madrid, Spain
- CB22/01/00041/Centro de Investigación Biomédica en Red de Bioingeniería, Biomateriales y Nanomedicina (CIBERBBN), Madrid, Spain
LinkOut - more resources
Full Text Sources
Medical
Research Materials
