. 2025 Jan 8;15(1):1295.
doi: 10.1038/s41598-024-84312-4.

Harnessing light-activated gallium porphyrins to combat intracellular Staphylococcus aureus using an in vitro keratinocyte infection model

Affiliations

Harnessing light-activated gallium porphyrins to combat intracellular Staphylococcus aureus using an in vitro keratinocyte infection model

Klaudia Szymczak et al. Sci Rep. .

Abstract

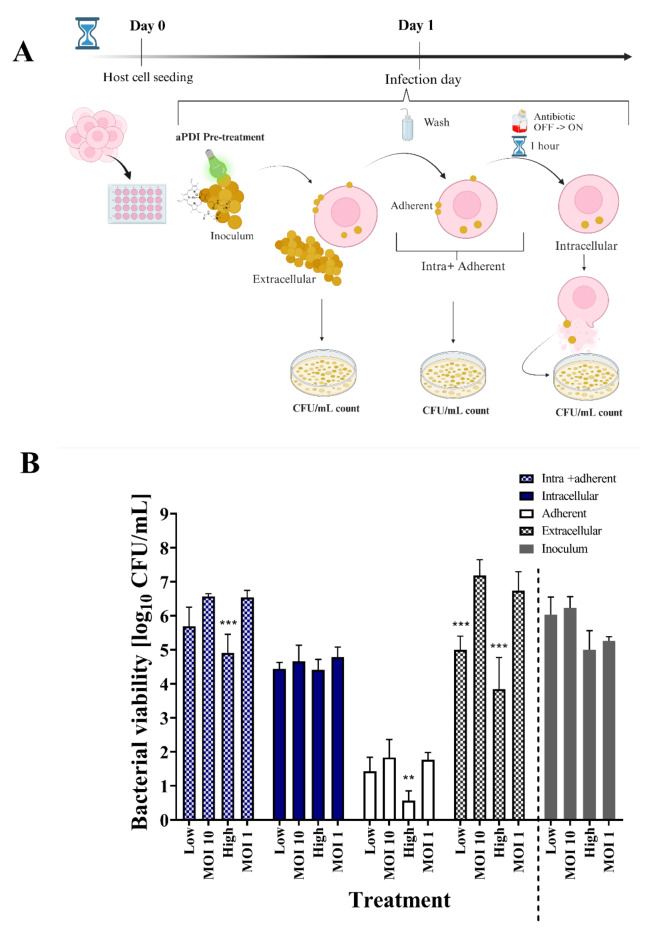
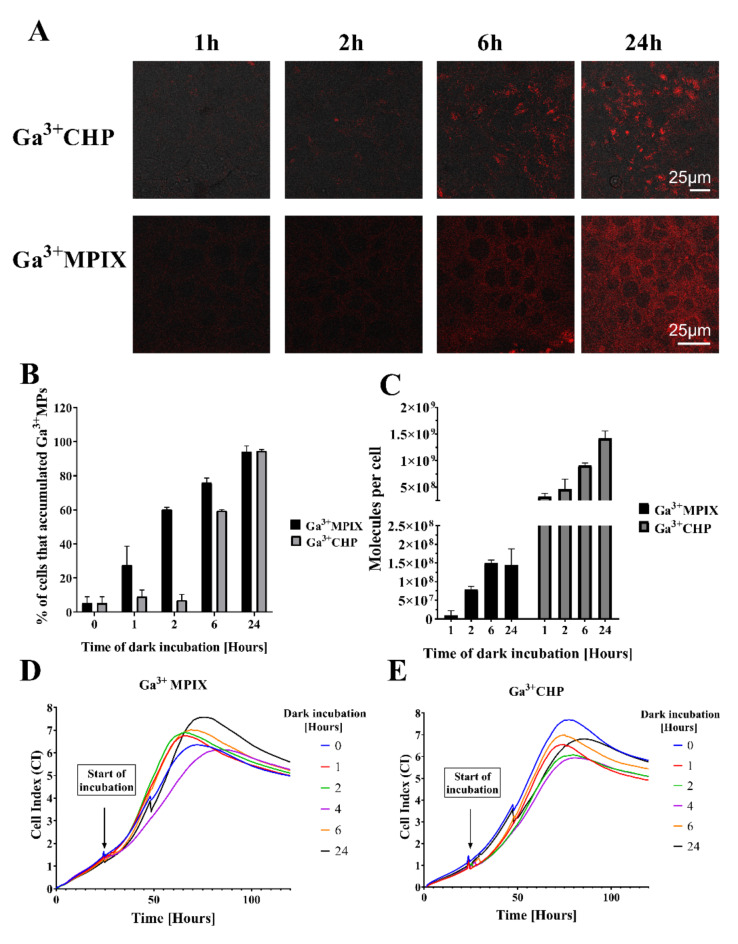
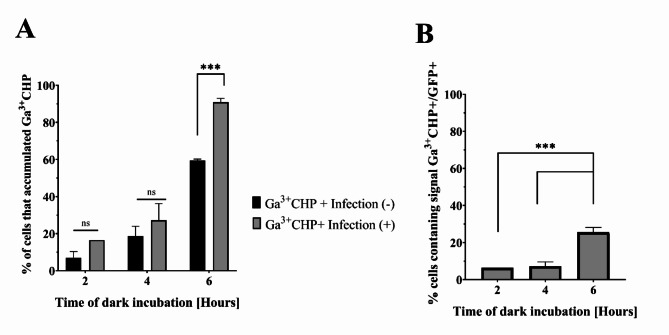
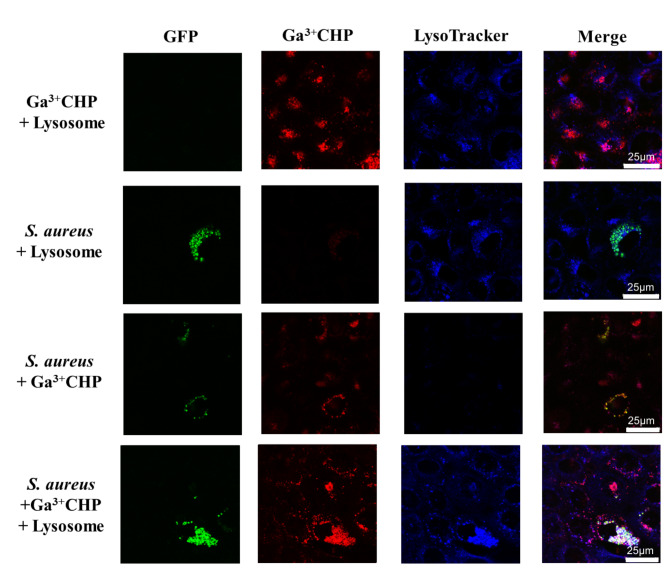
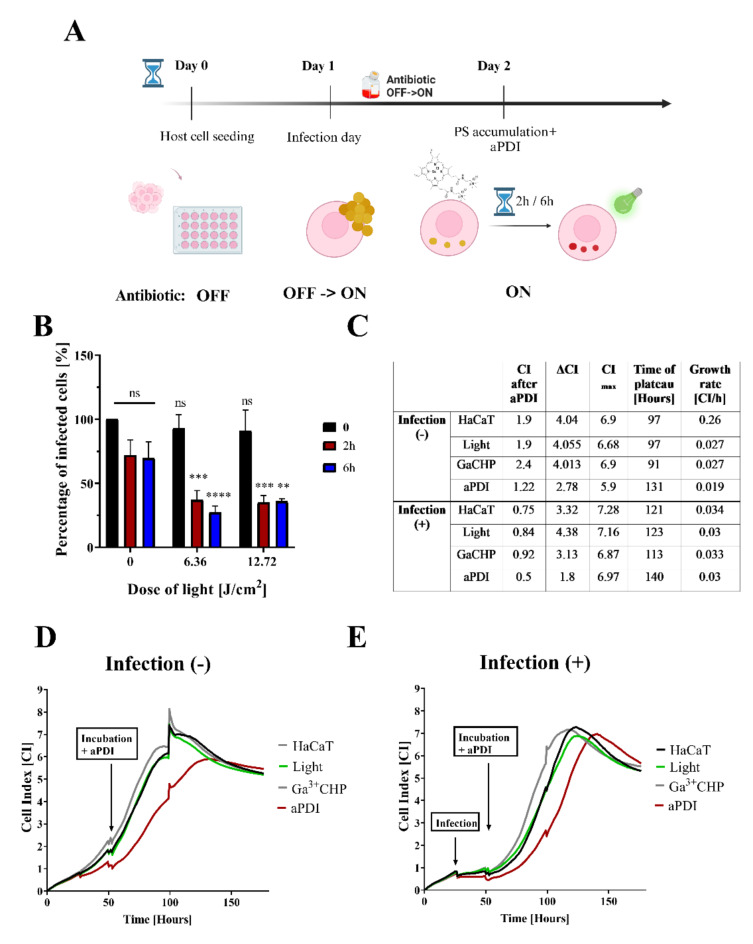
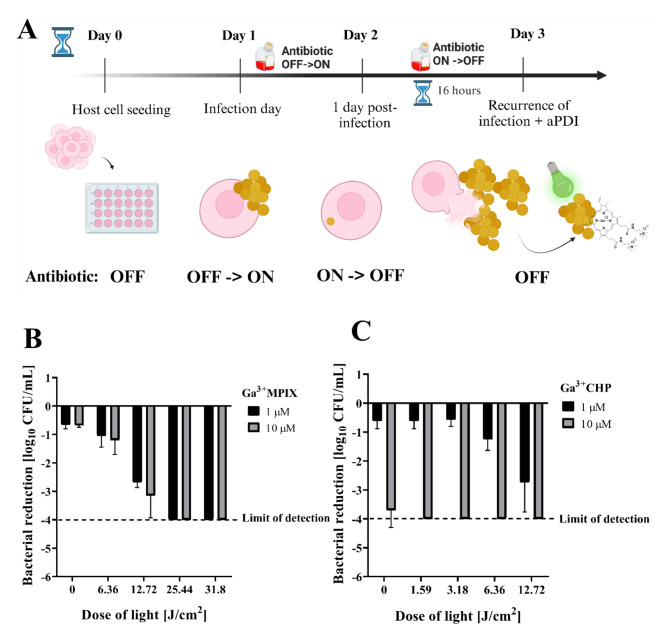
Staphylococcus aureus (S. aureus) can survive inside nonprofessional phagocytes such as keratinocytes, enabling it to evade antibiotics and cause recurrent infections once treatment stops. New antibacterial strategies to eliminate intracellular, multidrug-resistant bacteria are needed. This study used a keratinocyte model infected with methicillin-resistant S. aureus (MRSA) to test light-activated compounds, specifically heme-mimetic gallium (III) porphyrin (Ga3+CHP) and visible light, known as antimicrobial photodynamic inactivation (aPDI), for eliminating intracellular MRSA. Ga3+CHP was found to accumulate more in infected cells, particularly within lysosomal structures where MRSA resides. Flow cytometry and fluorescence microscopy revealed significant colocalization of MRSA and Ga3+CHP. Under aPDI, MRSA showed reduced adhesion to host cells and a 70% reduction in the GFP signal from intracellular bacteria. Additionally, light-activated Ga3+CHP significantly decreased the number of extracellular bacteria, reducing the potential for further infection. This study is the first to analyze aPDI toxicity in real time within an infection model, demonstrating that this method is neither cytotoxic nor phototoxic.


Conflict of interest statement

Declarations. Competing interests: The authors declare no competing interests.

Figures

Fig. 1
Fig. 1
Strategies to implement light-activated gallium metalloporphyrins to overcome S. aureus infection of human keratinocytes.
Fig. 2
Fig. 2
Effect of aPDI (light-activated Ga3+CHP) pretreatment on S. aureus USA300 infection – Strategy 1. (A) On day 0, HaCaT cells were seeded in a 24-well plate. On day 1, the cells were infected with S. aureus USA300 that was either untreated or pretreated with aPDI. After 2 h, the growth medium was collected for plating and the extracellular fraction was counted. Host cells were collected for subsequent lysis (intra + adherent fraction) or incubated for 1 h with antibiotics to eliminate adherent bacteria to obtain the intracellular fraction exclusively. All the fractions were serially diluted and plated for CFU/mL enumeration. (B) The number of bacteria counted from each fraction collected after infection with an untreated (‘MOI 10’, ‘MOI 1’) or aPDI-treated S. aureus inoculum (‘Low’, ‘High’). Before infection, the number of viable S. aureus (107 CFU/mL) was reduced by two doses of aPDI: a low dose that resulted in a 1 log10 reduction in CFU/mL and high dose that resulted in a 2 log10 reduction in CFU/mL. Untreated bacteria with an appropriate MOI of 10 or 1 were used as a control. The number of bacteria used for infection was the same whether the bacteria were pretreated with aPDI or were not pretreated (please see ‘Inoculum’ below). After infection, several fractions were collected, such as ‘Extracellular’ – the free-floating S. aureus collected from the medium after infection; ‘Adherent’ - S. aureus attached to the host cell; ‘Intracellular’ - S. aureus accumulated inside the host cell in the presence of antibiotic pressure; ‘Intra + Adherent’ – the combined number of intracellular and adherent S. aureus; and ‘Inoculum’ – the initial number of treated (Low or High) or untreated (MOI 10 or MOI 1) S. aureus used for infection. The data are presented as the means ± SDs of six separate experiments. The significant differences in infected cell viability at the respective p values are indicated with asterisks [**p < 0.01; ***p < 0.001], and were normalized to the respective control for each pretreatment (two-way Anova).
Fig. 3
Fig. 3
Different accumulation patterns of two gallium metalloporphyrins in human keratinocytes. (A) Confocal fluorescence microscopy images showing the accumulation of two gallium compounds, Ga3+MPIX and Ga3+CHP, in HaCaT cells after incubation in the dark (1–24 h) at a concentration of 10 µM. (B) Percentages of cells that accumulated Ga3+MPs among the total number of cells measured by flow cytometry. The cells were incubated with 10 µM Ga3+MPIX or Ga3+CHP and fixed at each time point (1–24 h) in the absence of light, after which the fluorescence signal in the cells was measured by flow cytometry. (C) The number of accumulated Ga3+MPIX or Ga3+CHP molecules (10 µM) in keratinocytes after incubation for the time indicated on the X axis, as measured by the fluorescence intensity of the cell lysate. After incubation in the dark for a particular time, the cells were harvested, counted, and lysed with 0.1 M NaOH/1% SDS to determine the fluorescence of each accumulated compound. (D, E) Real-time growth analysis of HaCaT cells after incubation in the dark (1–24 h) with 10 µM Ga3+MPIX (D) or Ga3+CHP (E).
Fig. 4
Fig. 4
The accumulation of Ga3+CHP in infected cells. (A) Accumulation of Ga3+CHP in infected and uninfected cells. The cells were infected with S. aureus USA300 (MOI 10) for 2 h in medium without antibiotics, and then the cells were washed and covered with medium supplemented with antibiotics. Uninfected cells were cultured in parallel. The next day, 10 µM Ga3+CHP was added and the cells were incubated in the dark. After incubation, the cells were washed and collected, and the percentage of cells with a fluorescence signal derived from Ga3+CHP was determined by flow cytometry. The accumulation results were compared with those of uninfected cells. (B) The number of infected cells harboring both GFP + and Ga3+CHP + signals after incubation in the dark with Ga3+CHP. The significant differences between the two compounds were calculated, and the respective p values are marked with asterisks [***p < 0.001] (one-way Anova).
Fig. 5
Fig. 5
Colocalization of intracellular S. aureus and Ga3+CHP in lysosomes.
Fig. 6
Fig. 6
Light-activated Ga3+CHP impacts the number of GFP-expressing cells without causing severe host damage. (A) Scheme of the experiment. On day 0, HaCaT cells were seeded in a 24-well plate. On day 1, S. aureus USA300 (MOI 10) was added, and the cells were incubated for 2 hours. Next, the medium was replaced with antibiotic medium (Antibiotic OFF-> ON) to eliminate extracellular bacteria and maintain intracellular invasion. On day 2, Ga3+CHP was added to the medium and incubated for 2–6 h in the dark. Then, the cells were washed, and green light was applied at the proper dose. (B) Percentage of infected cells after aPDI. The number of GFP-expressing cells after 2- or 6-hour incubation in the dark followed by green light illumination. The cells were collected and fixed, and the GFP signal was measured by flow cytometry. The results were calculated in reference to the untreated control (cells with no compound and no light exposure) (two-way Anova). (C) Table showing the growth characteristics of infected or uninfected cells subjected to different treatments. The following parameters were accounted for in the analysis: the cell index (CI) immediately after aPDI treatment (at the 55th hour of the experiment); the ΔCI which is characterized by the growth rate immediately after aPDI treatment, was calculated as the difference in the growth of cells after aPDI treatment (from 55 h of the experiment) and cells in the middle of logarithmic growth (at ~ 100 h of the experiment); the CImax- maximum CI achieved at the beginning of the plateau phase; the time to plateau phase - time at which cells enter stationary growth phase; and the growth rate, which was calculated as the total rate of increase in the logarithmic phase of growth after treatment to the time at which the plateau phase of the analysis curve was reached. (D, E) Real-time growth analysis of HaCaT cells that were not infected (D) or infected (E) after incubation in the dark for 2 hours with 10 µM Ga3+CHP and with or without light illumination of 6.36 J/cm2. The CI was measured by a real-time cell analysis (RTCA) instrument every 10 min. The experiments were conducted until the cells reached the plateau growth phase.
Fig. 7
Fig. 7
Light-activated Ga3+MPs effectively reduce the number of S. aureus USA300 released from keratinocytes – Strategy 1. (A) On day 1, HaCaT cells were infected with S. aureus USA300 (MOI = 10, 2 h) in medium without antibiotics (Antibiotic OFF). An antibiotic was added to remove extracellular S. aureus, and the cells were cultured under antibiotic pressure until the next day (Antibiotic OFF-> ON). The antibiotic was then removed (Antibiotic ON-> OFF), and HaCaT cells containing only intracellular S. aureus were left in an incubator for 16 h. During this time, intracellular S. aureus gradually lysed the cells and was released into the medium. S. aureus cells were harvested, washed with DMEM and then resuspended in tryptic soy broth (TSB). The bacterial suspensions were transferred to a 24-well plate, proper photosensitizers were added, and after incubation, they were illuminated with green light. The bacterial cells were then diluted, plated, and counted (B and C). The reduction in the number of S. aureus USA300 bacteria caused by light activation of Ga3+CHP (B) or Ga3+MPIX (C) was calculated in relation to that in the untreated cells.

Similar articles

References

    1. Tong, S. Y. C., Davis, J. S., Eichenberger, E., Holland, T. L. & Fowler, V. G. Staphylococcus aureus infections: Epidemiology, pathophysiology, clinical manifestations, and management. Clin. Microbiol. Rev.28(3), 603–661 (2015). - PMC - PubMed
    1. Peterson, L. R. & Schora, D. M. Methicillin-resistant Staphylococcus aureus control in the 21st Century: Laboratory involvement affecting disease impact and economic benefit from large population studies. J. Clin. Microbiol.54(11), 2647–2654 (2016). - PMC - PubMed
    1. Kobayashi, T. et al. Dysbiosis and Staphyloccus aureus colonization drives inflammation in atopic dermatitis. Immunity42(4), 756–766 (2015). - PMC - PubMed
    1. Ogonowska, P., Szymczak, K., Empel, J., Urbaś, M., Woźniak-Pawlikowska, A., Barańska-Rybak, W. et al. Staphylococcus aureus from atopic dermatitis patients: Its genetic structure and susceptibility to phototreatment. Microbiol. Spectr.11(3) 10.1128/spectrum.04598-22 (2023). - PMC - PubMed
    1. Horn, J., Stelzner, K., Rudel, T. & Fraunholz, M. Inside job: Staphylococcus aureus host-pathogen interactions. Int. J. Med. Microbiol.308(6), 607–624 (2018). - PubMed

Publication types

MeSH terms

LinkOut - more resources