. 2025 Jan 9;11(1):15.
doi: 10.1038/s41531-024-00846-4.

Microglia depletion reduces neurodegeneration and remodels extracellular matrix in a mouse Parkinson's disease model triggered by α-synuclein overexpression

Affiliations

Microglia depletion reduces neurodegeneration and remodels extracellular matrix in a mouse Parkinson's disease model triggered by α-synuclein overexpression

Zhen Zhang et al. NPJ Parkinsons Dis. .

Abstract

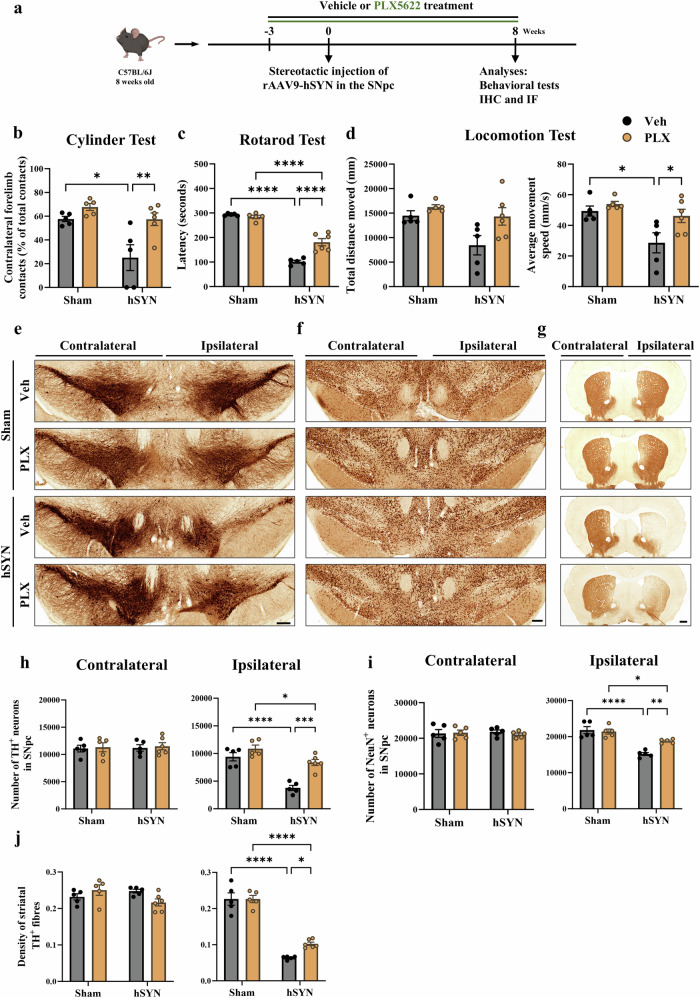
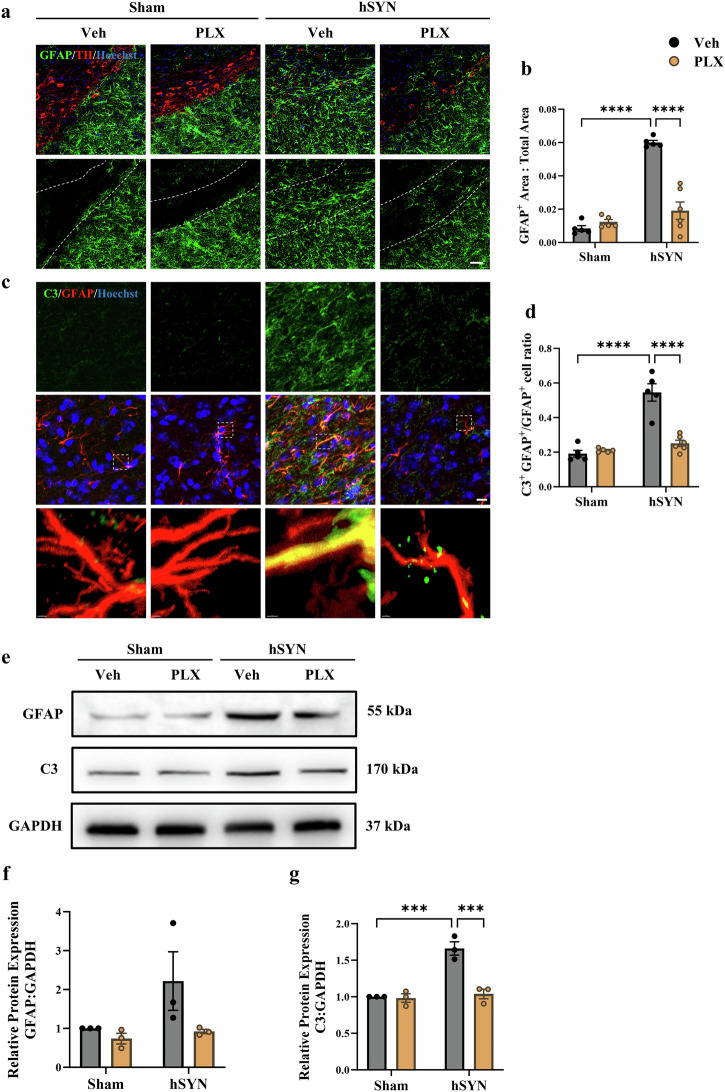
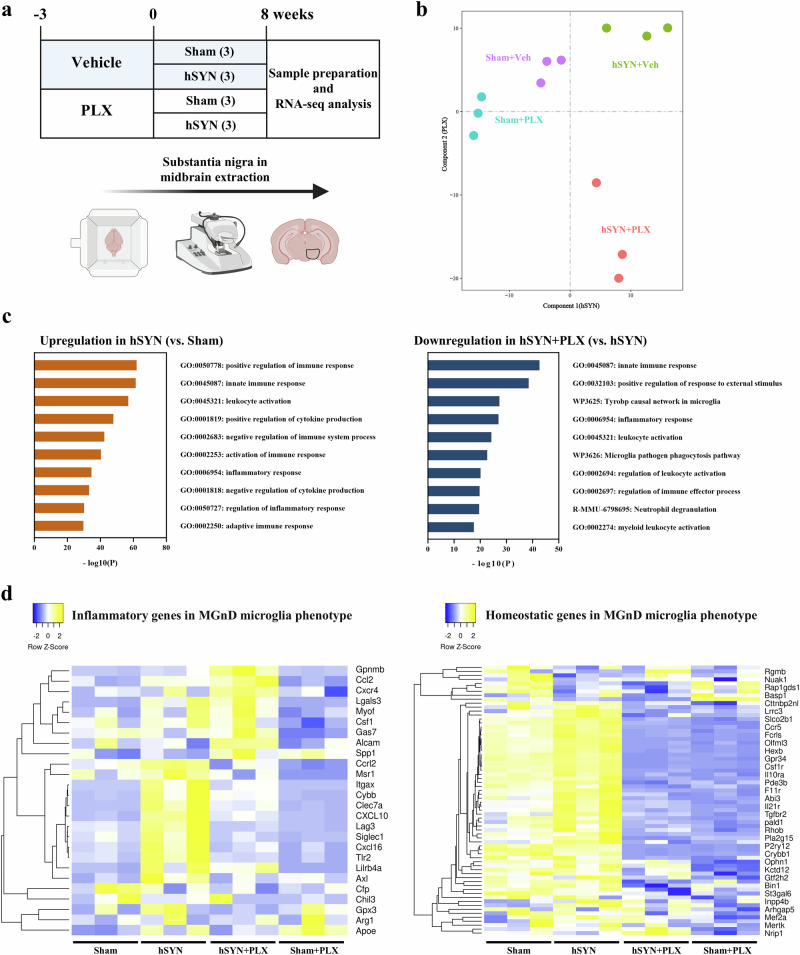
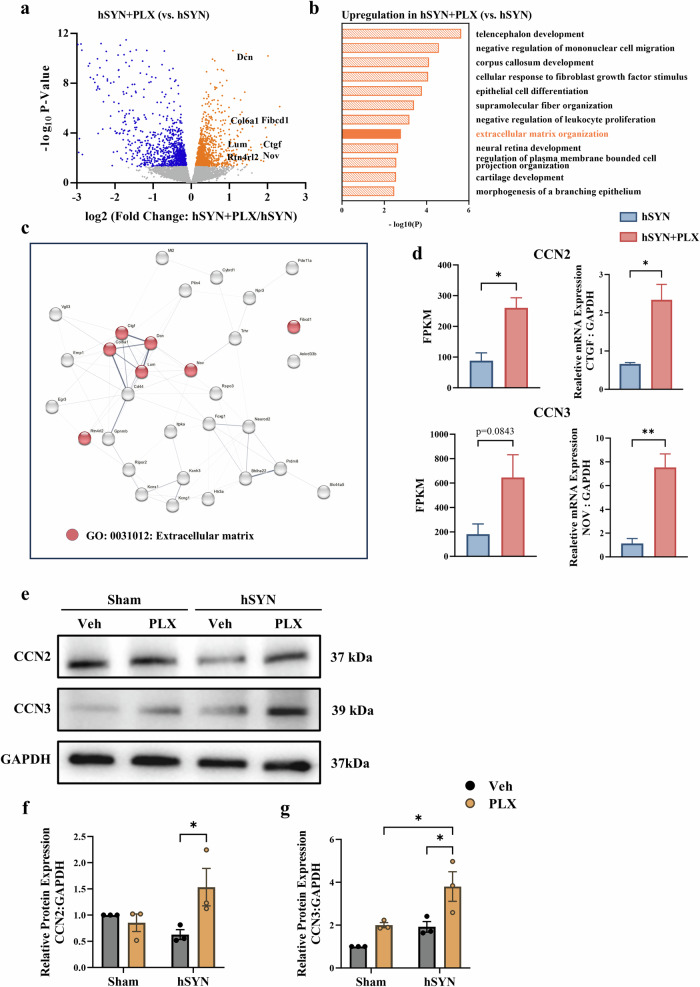
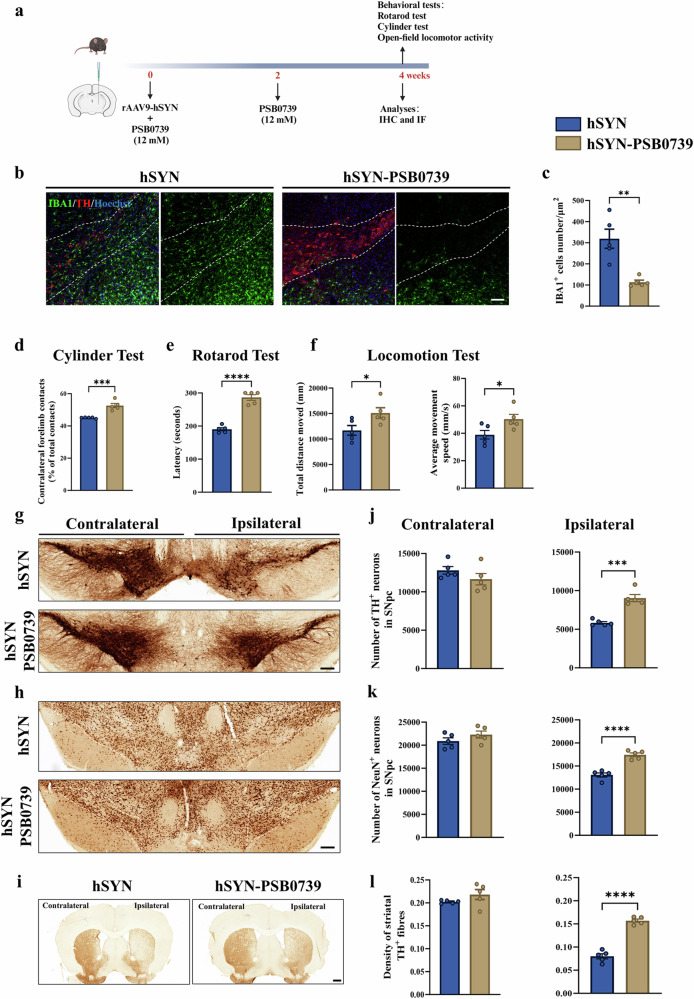
Chronic neuroinflammation with sustained microglial activation occurs in Parkinson's disease (PD), yet the mechanisms and exact contribution of these cells to the neurodegeneration remains poorly understood. In this study, we induced progressive dopaminergic neuron loss in mice via rAAV-hSYN injection to cause the neuronal expression of α-synuclein, which produced neuroinflammation and behavioral alterations. We administered PLX5622, a colony-stimulating factor 1 receptor inhibitor, for 3 weeks prior to rAAV-hSYN injection, maintaining it for 8 weeks to eliminate microglia. This chronic treatment paradigm prevented the development of motor deficits and concomitantly preserved dopaminergic neuron cell and weakened α-synuclein phosphorylation. Gene expression profiles related to extracellular matrix (ECM) remodeling were increased after microglia depletion in PD mice, which were further validated on protein level. We demonstrated that microglia exert adverse effects during α-synuclein-overexpression-induced neuronal lesion formation, and their depletion remodels ECM and aids recovery following insult.


Conflict of interest statement

Competing interests: The authors declare no competing interests.

Figures

Fig. 1
Fig. 1. Depletion of microglia with CSF-1R inhibitor prevented motor deficits and neurodegeneration in rAAV-hSYN-injected PD mice.
a Schematic diagram of the experimental design and time points for examination. bd Behavioral assessment using the cylinder test (b), rotarod test (c), and locomotion test (d). e, f Immunohistochemical staining of tyrosine hydroxylase (TH) (e) and neuronal nuclei antigen (NeuN) (f) in the substantia nigra pars compacta (SNpc). Scale bars, 200 μm (TH), 500 μm (NeuN). g Immunohistochemical staining of TH in the striatum. Scale bar, 500 μm. h, i Stereological counting of TH+ neurons (h) and NeuN+ neurons (i) in SNpc. j Quantification of TH+ optical intensity in the striatum. *p < 0.05, **p < 0.01, ***p < 0.001, ****p < 0.0001. Data expressed as mean ± SEM (n = 5–6/group).
Fig. 2
Fig. 2. Depletion of microglia with CSF-1R inhibitor reduced α-synulein phosphorylation levels in rAAV-hSYN-injected PD mice.
a Representative double-immunostaining images for phosphorylated-α-synuclein Ser129 (p-α-synSer129) (green) and TH (red) in the SNpc. White dashed box in far-left panel outlines the area shown at high magnification in the panels on the right. Scale bars, 100 μm and 20 μm for low- and high-magnification images, respectively. b The proportions of p-α-synSer129+ neurons in all TH+ neurons in the SNpc region. c Representative immunostaining images for human α-synuclein 211 (α-syn211) (green) and p-α-synSer129 (red) in the SNpc. White dashed box in far-left panel outlines the area shown at high magnification in the panels on the right. Scale bars, 50 μm and 10 μm for low- and high-magnification images, respectively. d Number of α-syn211+ neurons in the SNpc region (20x magnification). e The proportions of p-α-synSer129+ neurons in all α-syn211+ neurons in the SNpc region. *p < 0.05, ****p < 0.0001. Data expressed as mean ± SEM (n = 5–6/group).
Fig. 3
Fig. 3. Long-term PLX5622 administration depletes microglia and reduced the infiltration of myeloid cells.
a Representative images of microglia (ionized calcium-binding adaptor molecule 1 (IBA1), green) and dopaminergic neurons (TH, red) in the SNpc. Scale bar, 50 μm. b Quantification of IBA1+ cell density per unit area (n = 5/group). c Representative images of microglia (CX3CR1+/GFP, GFP) and monocyte (Ms4a3Cre-RosaTdT, tdTomato) in the SNpc. Scale bar, 10 μm. d Number of tdTomato+ cells in the SNpc region (40x magnification). e The proportions of tdTomato+ cells in all IBA1+ cells in the SNpc region (n = 4/group). fh Flow cytometric analysis of bone marrow cells (f, g) and blood cells (h) isolated from Ms4a3Cre - RosaTdT :: CX3CR1+/GFP mice treated with PLX5622 for 4 weeks (n = 3/group). *p < 0.05, **p < 0.01, ****p < 0.0001. Data expressed as mean ± SEM.
Fig. 4
Fig. 4. Long-term PLX5622 administration modifies astrocyte state in rAAV-hSYN-injected PD mice.
a Representative double-immunostaining images for astrocytes (glial fibrillary acidic protein (GFAP), green) and dopaminergic neurons (TH, red) in the SNpc. White dashed box outlines the area of SNpc. Scale bar, 50 μm. b Quantification of GFAP+ average area, which was used as a measure of astrocyte activation levels. c Representative double-immunostaining images for astrocytes (GFAP, red) and C3 (green) in the SNpc. Scale bar = 10 μm. d The proportions of C3+ cells in all GFAP+ cells, which was used as a measure of A1 astrocyte activation levels (n = 5–6/group). ****p < 0.0001. Data expressed as mean ± SEM. e Western blot analysis of GFAP and C3 protein in the ventral midbrain. f, g Quantification of relative GFAP (f) and C3 (g) expression to GAPDH (n = 3/group). ***p < 0.001, ****p < 0.0001. Data expressed as mean ± SEM.
Fig. 5
Fig. 5. Long-term PLX5622 administration modifies neuroinflammation in rAAV-hSYN-injected PD mice.
a Flowchart of RNA sequencing (RNA-seq) (biorender.com). b Models were generated to classify each of the 4 treatment groups (n = 3/group): Group 1 (Sham + vehicle), Group 2 (hSYN + vehicle), Group 3 (Sham + PLX5622), and Group 4 (hSYN + PLX5622). Principal components (PC) 1 and 2 identify key genes changed by hSYN and PLX5622 treatment, respectively. c Gene ontology biological process (GO–BP) analysis of RNA-seq data showing the most significantly up-regulated genes of signaling pathways in hSYN + vehicle / Sham + vehicle (left) and down-regulated genes of signaling pathways in hSYN + PLX5622 / hSYN + vehicle (right). d Heatmap of inflammatory (left) and homeostatic (right) genes in microglial neurodegenerative phenotype.
Fig. 6
Fig. 6. Remodeling of extracellular matrix following long-term PLX5622 administration.
a Volcano plot analysis of RNA-seq data from PD model animals with and without PLX5622 challenge. b GO analysis of RNA-seq data showing the signaling pathways of most significantly up-regulated genes in hSYN + PLX5622 / hSYN + vehicle. c Representation of protein-protein network of the top 32 up-regulated genes in hSYN + PLX5622 / hSYN + vehicle using STRING database. d Quantification of gene expression related to extracellular matrix with RNA-seq data and quantitative real-time PCR. e Western blot analysis of CCN2 and CCN3 protein in the ventral midbrain. f, g Quantification of relative CCN2 (f) and CCN3 (g) expression to GAPDH. *p < 0.05, **p < 0.01. Data expressed as mean ± SEM (n = 3/group).
Fig. 7
Fig. 7. P2Y12R pharmacological blockade prevented rAAV-hSYN-induced motor impairment and neurodegeneration.
a Schematic diagram of the rAAV-hSYN experimental design (biorender.com). b Representative immunostaining images for microglia (IBA1, green) and dopaminergic neurons (TH, red) in the SNpc. White dashed box outlines the area of SNpc. Scale bar, 50 μm. c Quantification of IBA1+ cells density per unit area. df Behavioral assessment using the cylinder test (d), rotarod test (e), and locomotion test (f). g, h Immunohistochemical staining of TH (g) and NeuN (h) in the SNpc. Scale bars, 200 μm (TH), 500 μm (NeuN). i Immunohistochemical staining of TH in the striatum. Scale bar, 500 μm. j, k Stereological counting of TH+ neurons (j) and NeuN+ neurons (k) in SNpc. l Quantification of TH+ optical intensity in the striatum. *p < 0.05, **p < 0.01, ***p < 0.001, ****p < 0.0001. Data expressed as mean ± SEM (n = 5/group).

Similar articles

Cited by

References

    1. Feigin, V. L. et al. The global burden of neurological disorders: translating evidence into policy. Lancet Neurol.19, 255–265 (2020). - PMC - PubMed
    1. Group GBDNDC. Global, regional, and national burden of neurological disorders during 1990-2015: a systematic analysis for the Global Burden of Disease Study 2015. Lancet Neurol.16, 877–897 (2017). - PMC - PubMed
    1. Surmeier, D. J., Obeso, J. A. & Halliday, G. M. Selective neuronal vulnerability in Parkinson disease. Nat. Rev. Neurosci.18, 101–113 (2017). - PMC - PubMed
    1. Morris, H. R., Spillantini, M. G., Sue, C. M. & Williams-Gray, C. H. The pathogenesis of Parkinson’s disease. Lancet403, 293–304 (2024). - PubMed
    1. Berriat, F., Lobsiger, C. S. & Boillee, S. The contribution of the peripheral immune system to neurodegeneration. Nat. Neurosci.26, 942–954 (2023). - PubMed

LinkOut - more resources