. 2025 Jan 8;15(1):1365.
doi: 10.1038/s41598-024-83867-6.

Task relevant autoencoding enhances machine learning for human neuroscience

Affiliations

Task relevant autoencoding enhances machine learning for human neuroscience

Seyedmehdi Orouji et al. Sci Rep. .

Abstract

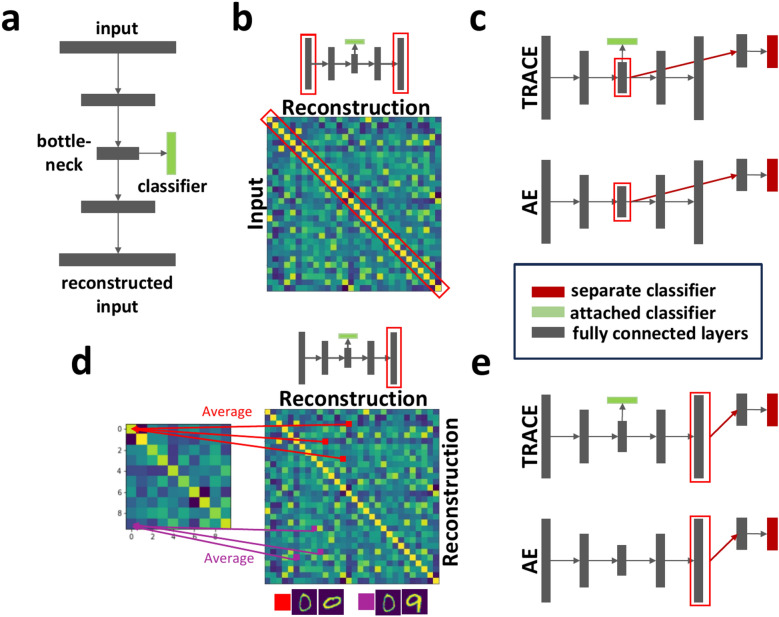
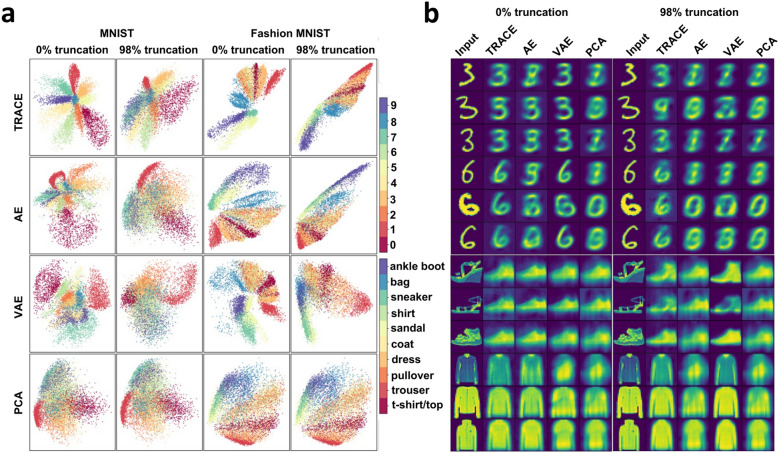
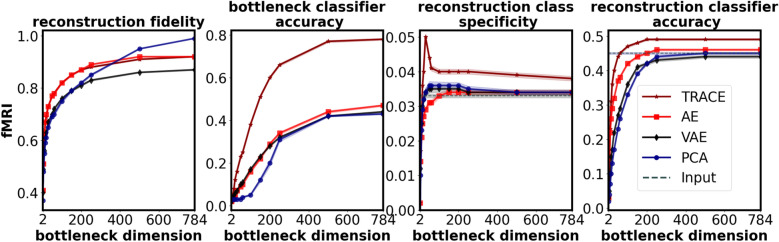
In human neuroscience, machine learning can help reveal lower-dimensional neural representations relevant to subjects' behavior. However, state-of-the-art models typically require large datasets to train, and so are prone to overfitting on human neuroimaging data that often possess few samples but many input dimensions. Here, we capitalized on the fact that the features we seek in human neuroscience are precisely those relevant to subjects' behavior rather than noise or other irrelevant factors. We thus developed a Task-Relevant Autoencoder via Classifier Enhancement (TRACE) designed to identify behaviorally-relevant target neural patterns. We benchmarked TRACE against a standard autoencoder and other models for two severely truncated machine learning datasets (to match the data typically available in functional magnetic resonance imaging [fMRI] data for an individual subject), then evaluated all models on fMRI data from 59 subjects who observed animals and objects. TRACE outperformed alternative models nearly unilaterally, showing up to 12% increased classification accuracy and up to 56% improvement in discovering "cleaner", task-relevant representations. These results showcase TRACE's potential for a wide variety of data related to human behavior.

Keywords: Autoencoder; Dimensionality reduction; Human neuroscience; MVPA; Machine learning; Task-relevant representation; fMRI.


Conflict of interest statement

Declarations. Competing interests: The authors declare no competing interests.

Figures

Fig. 1
Fig. 1
Cartoons showing the TRACE network architecture and the four evaluation metrics. (a) In the TRACE architecture, each gray rectangle represents a layer of the autoencoder, consisting of fully connected units. The input layer is connected to the bottleneck layer via one hidden encoding layer, and again to the reconstruction layer via one hidden decoding layer. A classifier is attached to the bottleneck and contributes to the objective optimization function. Remaining panels show the quantitative evaluation metrics: (b) reconstruction fidelity, (c) bottleneck classifier accuracy, (d) reconstruction class specificity, and (e) reconstruction classifier accuracy. Small cartoons of the TRACE architecture use red rectangle overlays to indicate which sections of the model architecture are being utilized for each outcome metric. In (c) and (e), red-filled boxes indicate separate classifiers not included when training the model, green-filled boxes indicate attached classifiers which contribute to the model’s loss function, and gray-filled boxes indicate fully-connected encoder and decoder layers. All metrics are shown with reference to TRACE and a complexity-matched standard autoencoder (AE) for simplicity, but the metrics are applied equivalently across all models; see Methods for details.
Fig. 2
Fig. 2
Quantitative comparison between TRACE and other models (AE, VAE, and PCA) on the four outcome metrics, for the two benchmark datasets (MNIST & Fashion MNIST) for bottleneck dimensionalities between 2 and 150. Columns show the different evaluation metrics: reconstruction fidelity, bottleneck classifier accuracy, reconstruction class specificity, and reconstruction classifier accuracy (see Methods and Fig. 1b–e). TRACE is indicated by the dark red line in all panels, with other models indicated by other colors; the dashed lines show the input class specificity and input classifier accuracy in the relevant panels. Outcome metrics for all bottleneck dimensionalities tested (dimensionalities of 2–784) are shown in Figure S2; locations of peaks for all four metrics are shown in Table S1. The chance levels of bottleneck and reconstruction classifier accuracy are both 10% (not shown in the plot). Note that conducting statistical tests is not feasible since the results reported here come from the training of cross-validated models on the entire dataset at each dimensionality of the bottleneck.
Fig. 3
Fig. 3
Performance of TRACE and other models as a function of sample size for the optimal bottleneck dimension of d = 2. At 98% truncation level, we used 50 independent jack-knife resamplings to truncate 98% of exemplars and reported the means and standard deviations of the metrics (calculated on the standard test set) for MNIST and Fashion MNIST. Error bars show the standard deviation of results across the 50 jack-knife resamplings at 98% data truncation. Small variations in the metrics are likely due to random initialization of weights and use of GPUs in fitting the models.
Fig. 4
Fig. 4
Visualization of bottleneck features and reconstructions for MNIST and Fashion MNIST datasets using TRACE, AE, VAE, and PCA. (a) When trained on the full dataset, TRACE shows clear superiority in creating distinctive clusters in the bottleneck for different classes for MNIST dataset in comparison to other models The distinction is less clear but still apparent in the Fashion MNIST dataset. This pattern persists even at the 98% truncation level (trained on only 2% of the data), again showing the robustness of TRACE. (b) The reconstruction of three representative instances of numbers “three” and “six” in MNIST dataset and three instances of classes “sandal” and “shirt” in the fashion MNIST dataset when there are two features in the bottleneck shows the same pattern. TRACE shows a more clear and canonical reconstruction of the inputs across several exemplars from the same category.
Fig. 5
Fig. 5
Comparison between quantitative metrics for TRACE and other models for fMRI dataset (n = 59). TRACE shows superior performance in three out of four metrics (excluding reconstruction fidelity and only for d > 250).

Similar articles

Cited by

References

    1. Sidhu, G. S., Asgarian, N., Greiner, R. & Brown, M. R. G. Kernel Principal Component Analysis for dimensionality reduction in fMRI-based diagnosis of ADHD. Front. Syst. Neurosci.6, 74 (2012). - PMC - PubMed
    1. Mannfolk, P., Wirestam, R., Nilsson, M., Ståhlberg, F. & Olsrud, J. Dimensionality reduction of fMRI time series data using locally linear embedding. MAGMA23, 327–338 (2010). - PubMed
    1. Yang, Z., LaConte, S., Weng, X. & Hu, X. Ranking and averaging independent component analysis by reproducibility (RAICAR). Hum. Brain Mapp.29, 711–725 (2008). - PMC - PubMed
    1. P.-H. (cameron) Chen, et al., A Reduced-Dimension fMRI Shared Response Model in Advances, In: Neural Information Processing Systems, C. Cortes, N. Lawrence, D. Lee, M. Sugiyama, R. Garnett, (Eds). (Curran Associates, Inc., London), (2015).
    1. Bejjanki, V. R., da Silveira, R. A., Cohen, J. D. & Turk-Browne, N. B. Noise correlations in the human brain and their impact on pattern classification. PLoS Comput. Biol.13, e1005674 (2017). - PMC - PubMed

Publication types