. 2025 Jan 8;15(1):1294.
doi: 10.1038/s41598-024-84018-7.

Identifying ADME-related gene signature for immune landscape and prognosis in KIRC by single-cell and spatial transcriptome analysis

Affiliations

Identifying ADME-related gene signature for immune landscape and prognosis in KIRC by single-cell and spatial transcriptome analysis

Hongyun Wang et al. Sci Rep. .

Abstract

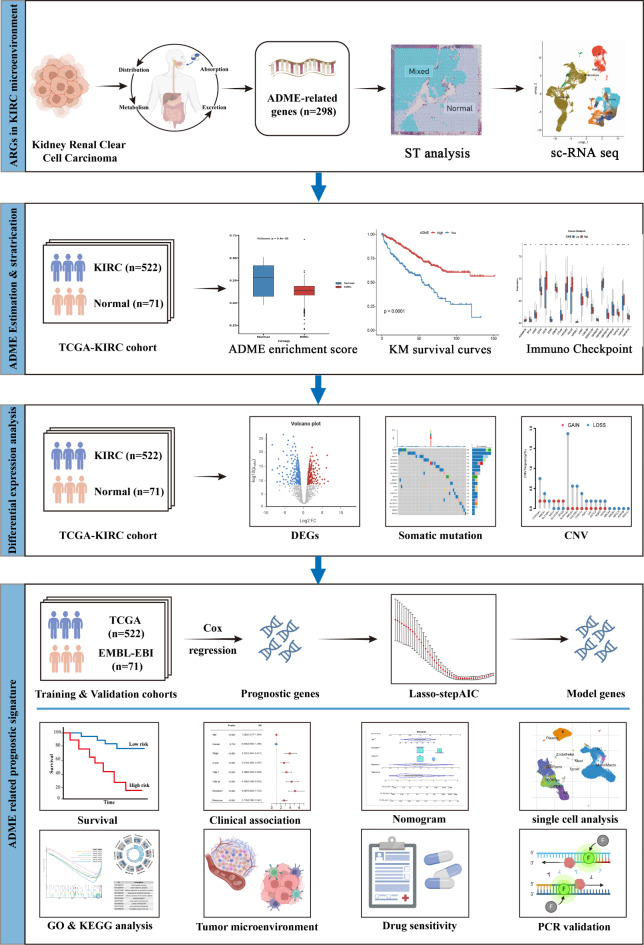
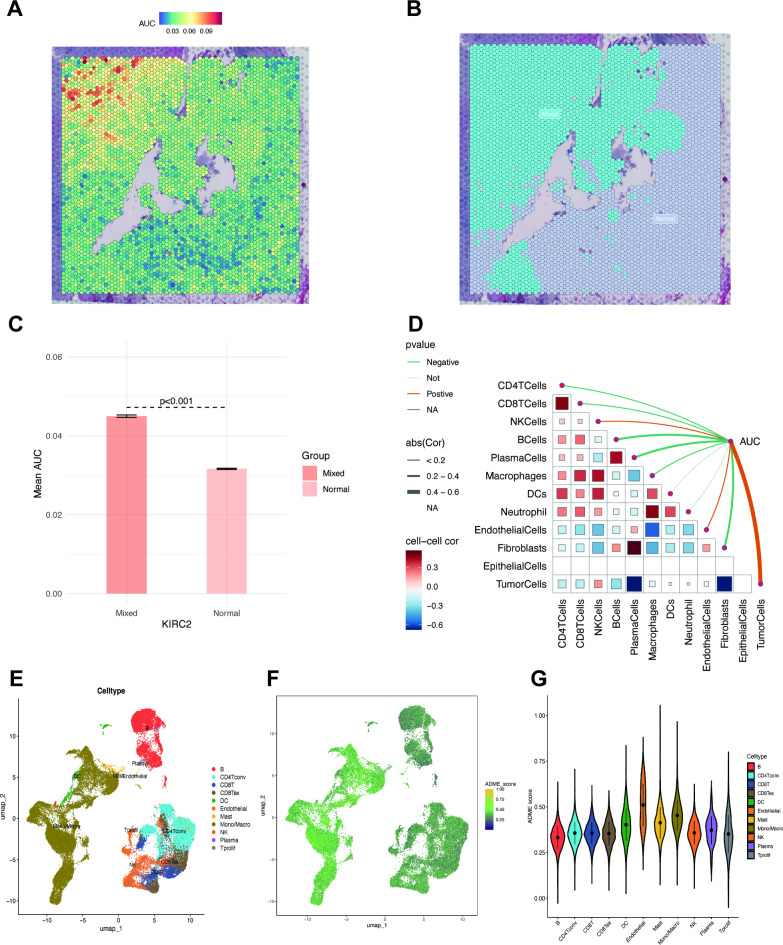
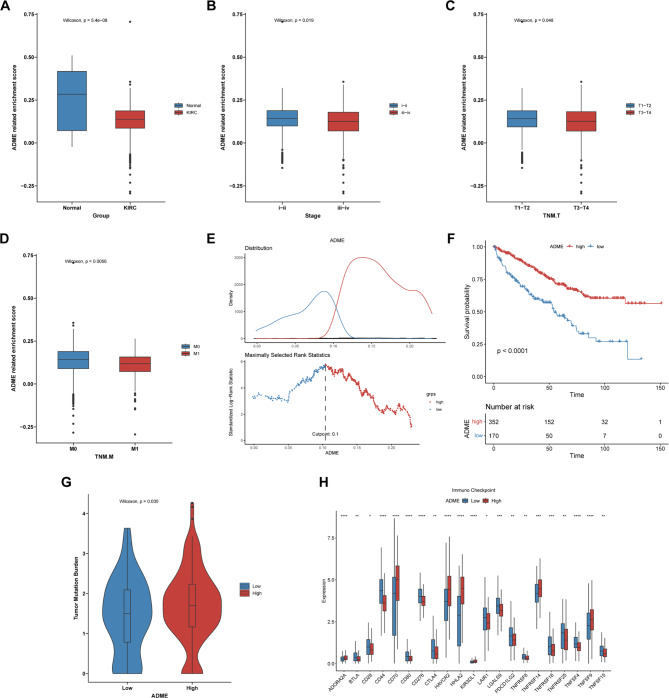
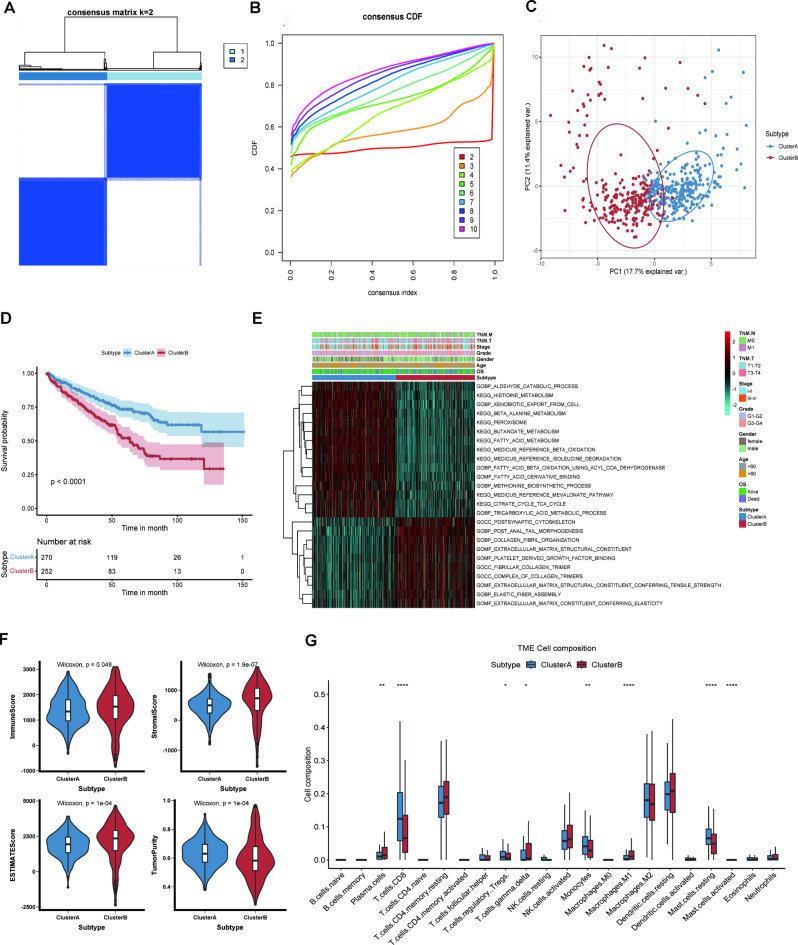
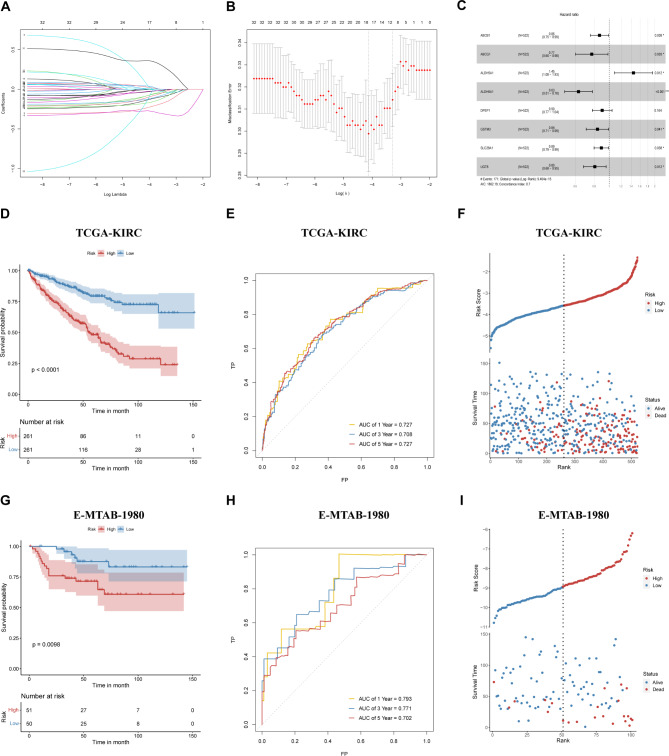
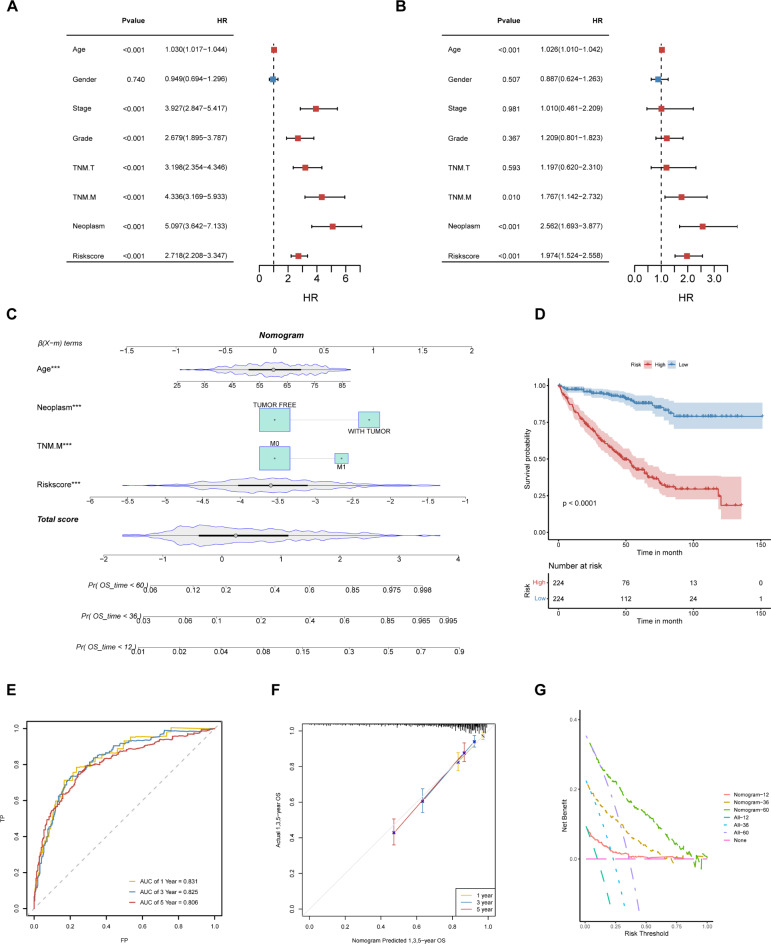
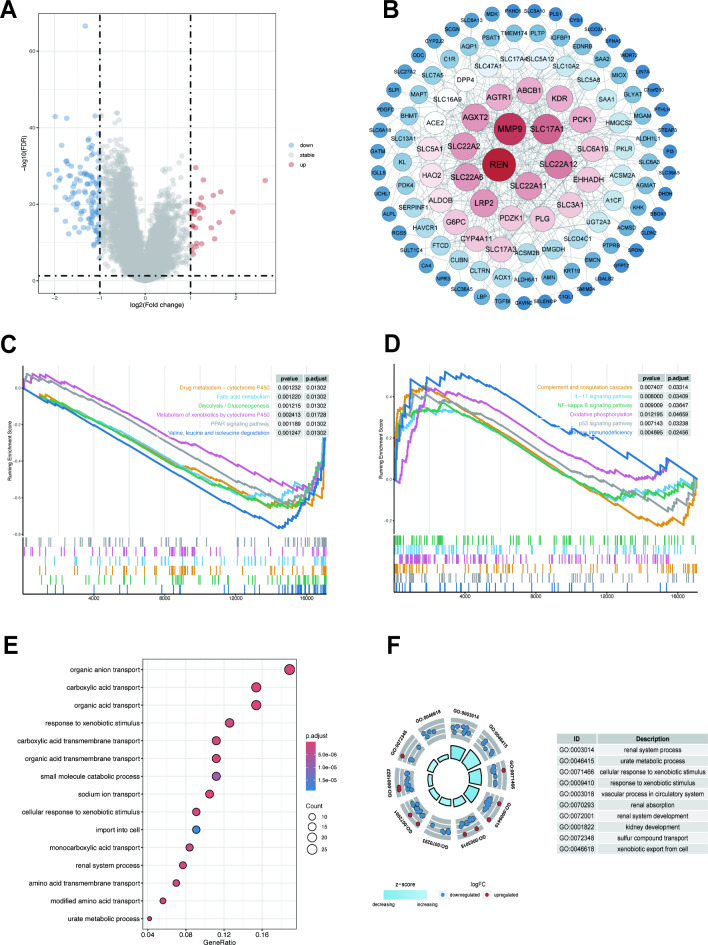
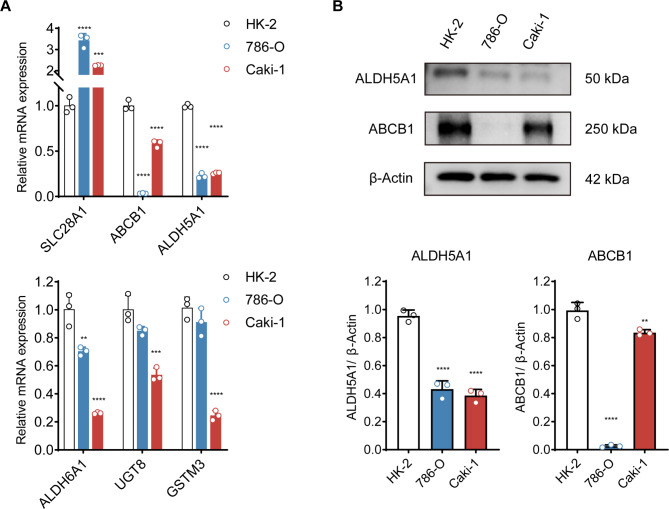
Kidney renal clear cell carcinoma (KIRC) is the most prevalent subtype of kidney cancer. Although multiple therapeutic agents have been proven effective in KIRC, their clinical application has been hindered by a lack of reliable biomarkers. This study focused on the prognostic value and function of drug absorption, distribution, metabolism, and excretion- (ADME-) related genes (ARGs) in KIRC to enhance personalized therapy. The critical role of ARGs in KIRC microenvironment was confirmed by single cell RNA-seq analysis and spatial transcriptome sequencing analysis for the first time. Then, an ADME-related prognostic signature (ARPS) was developed by the bulk RNA-seq analysis. The ARPS, created through Cox regression, LASSO, and stepAIC analyses, identified eight ARGs that stratified patients into high-risk and low-risk groups. High-risk patients had significantly poorer overall survival. Multivariate analysis confirmed the independent predictive ability of ARPS, and an ARPS-based nomogram was constructed for clinical application. Gene ontology and KEGG pathway analyses revealed immune-related functions and pathways enriched in these groups, with low-risk patients showing better responses to immunotherapy. Finally, the expression of ARGs was validated by qRT-PCR and Western blotting experiments. These findings underscore the prognostic significance of ARPS in KIRC and its potential application in guiding personalized treatment strategies.

Keywords: ADME genes; Gene signature; Immune cell infiltration; Kidney renal clear cell carcinoma; Survival.


Conflict of interest statement

Declarations. Competing interests: The authors declare no competing interests. Cell lines identity: The human kidney cell lines, including HK-2, 786-O, and Caki-1, were purchased from Wuhan Pricella Biotechnology Co.

Figures

Fig. 1
Fig. 1
Flowchart for comprehensive analysis of ADME-related gene signature for immune landscape and prognosis in patients with Kidney renal clear cell carcinoma (KIRC).
Fig. 2
Fig. 2
ADME-related characteristic in spatial transcriptome and scRNA-seq. (A) Spatial visualization of ADME intensity. (B-C) Differential anlysis of ADME related activity in mixed malignant, and normal regions. (D) Spearman correlation of ADME related activity with microenvironmental components at spatial transcriptome resolution. (E) Single cell types identified by marker genes. (F) The ADME enrichment score (activity) in each cell. (G) The distribution of ADME score in different cell types. *p < 0.05; **p < 0.01; ***p < 0.001; ****p < 0.0001. ADME: Absorption, distribution, metabolism and excretion.
Fig. 3
Fig. 3
ARS estimation and stratification analysis in KIRC patients. (A) Box plot showing the differences in ssGSEA ARS between KIRC and normal samples by Wilcoxon test. Box plot comparing ssGSEA ARS between (B) Stage, (C) TNM.T, (D) TNM.M., (E) KIRC patients were divided into the low-ARS and high-ARS groups using the surv_cutpoint function. (F) KM survival curves of the OS for KIRC patients in the high-ARS and low-ARS groups. (G) Comparison of TMB between the high-ARS and low-ARS groups. (H) Comparison of the immune checkpoint between the high-ARS and low-ARS groups. *p < 0.05; **p < 0.01; ***p < 0.001; ****p < 0.0001. TMB: Tumor mutation burden. ADME: Absorption, distribution, metabolism and excretion.
Fig. 4
Fig. 4
Variant landscape of ARGs in KIRC patients. (A) Volcano plot of DEGs in KIRC (blue: downregulated DEGs; red: upregulated DEGs; gray: unchanged genes), FDR < 0.05 and |log2FC| > 1. (B) Venn diagram between KIRC DEGs and ARGs. (C) PPI network of ADME-related DEGs. (D) Oncoplot of the top 20 ADME-related DEGs in the TCGA cohort. (E) Frequencies of CNV gain, loss, and non-CNV among the top 20 ADME-related DEGs. (F) Bar plot of KEGG analysis of ADME-related in KIRC. (G) Dot plot of GO BP analysis of ADME-related in KIRC. GO, Gene ontology; KEGG, Kyoto Encyclopedia of Genes and Genomes.
Fig. 5
Fig. 5
Subtype identification, TME infiltration characteristics, and biological signal features of two distinct ADME related clusters in KIRC. (A). Samples from the TCGA-KIRC cohort were divided into two clusters using a consensus clustering algorithm (k = 2). (B) Cumulative Distribution Function (CDF) from k = 2 to 10. (C) Principal Component Analysis (PCA) shows significant differences between the two ADME clusters. (D) Kaplan-Meier curve shows different overall survival (OS) between the two ADME clusters. (E) Heatmap shows differences in clinical characteristics and biological functions between two ADME clusters. (F) The violin plot shows higher immune infiltration, stromal, and ESTIMATE score and lower TumorPurity in ClusterB. (G) The boxplot of 28 infiltrated immune cell types was calculated by CIBERSORT between the two ADME clusters. *p < 0.05; **p < 0.01; ***p < 0.001; ****p < 0.0001.
Fig. 6
Fig. 6
Construction of an ARPS for KIRC patients. (A-B). LASSO regression analysis of ADME-related DEGs. The coefficients changed with increasing lambda value. (C) Forest plot of the final eight prognostic genes in the risk model from the stepAIC regression analysis. (D) OS of patients in the LR and HR score groups in TCGA-KIRC. (E) ROC curve of the risk model in predicting survival in TCGA-KIRC. (F) Distribution of risk score by the survival status and time in TCGA-KIRC. (G) OS of patients in the LR and HR score group in E-MTAB-1980. (H) ROC curve of the risk model in predicting survival in E-MTAB-1980. (I) Distribution of risk score by the survival status and time in E-MTAB-1980. LASSO: Least absolute shrinkage and selection operator; stepAIC: Stepwise Akaike information criterion; ROC: Receiver operator characteristic.
Fig. 7
Fig. 7
Establishment and assessment of the nomogram survival model. (A). Univariate analysis for the clinicopathologic properties and risk score in TCGA-KIRC. (B) Multivariate analysis for the clinicopathologic properties and risk score in TCGA-KIRC. (C) A nomogram for predicting the prognosis of KIRC patients. (D) Kaplan-Meier analysis for two KIRC groups according to the nomogram score. (E) ROC curve analysis of the nomogram in TCGA-KIRC. (F) Calibration plots showing the probability of 1-, 3-, and 5-year OS in TCGA-KIRC. (G) Decision curve analysis (DCA) of the nomogram predicting 1-, 3-, and 5-year OS.
Fig. 8
Fig. 8
Immune characteristics of ADME-related prognostic subgroups. (A). Violin plot showing lower immune infiltration, stromal, and ESTIMATE scores, and higher tumor purity in HR patients. (B) Box plot of expression levels of immune checkpoint- associated genes. (C) Box plot of 28 infiltrating immune cell types was calculated by ssGSEA. (D) Box plot of 22 infiltrating immune cell types was calculated by CIBERSORT. (E) Proportion of response to immunotherapy in the HR and LR groups based on TIDE results. (F) Violin plot of significantly increased hypoxic score in HR patients *p < 0.05; **p < 0.01; ***p < 0.001; ****p < 0.0001.
Fig. 9
Fig. 9
Mutation landscape between ADME-related prognostic subgroups. (A). Difference analysis of fraction genome altered in different risk score groups. (B) Patterns of copy number variation (CNV) in different risk cohorts. (C) Waterfall plot of somatic mutation characteristics in the HR and LR score groups. (D) Comparison of different mutation sites of BAP1 and PBRM1. *p < 0.05; ***p < 0.001; ****p < 0.0001.
Fig. 10
Fig. 10
Effectiveness of ADME-related signature in predicting drug sensitivity. (A). Bubble plot of the relationship between drugs and model genes. Boxplots of the comparison of IC50 of drugs between high- and low-risk groups, and correlation between the IC50 and risk score in TCGA-KIRC cohort: (B) Sunitinib; (C) Sorafenib; (D) Rapamycin; (E) Imatinib; (F) Erlotinib; (G) Bleomycin.
Fig. 11
Fig. 11
Biological functions underlying the ADME-related prognosis model. (A). Volcano plot for DEGs (FDR < 0.05 and |log2FC| > 0.5) between the HR and LR groups. (B) PPI network of Risk-related DEGs. GSEA analysis of KEGG pathways between (C) LR group; (D) HR group. (E) Dot plot of GO BP enrichment analysis. (F) GO circle plot of enriched GO BP terms.
Fig. 12
Fig. 12
Validation of ADME-related signature genes expression. (A) The mRNA levels of SLC28A1, ABCB1, ALDH5A1, ALDH6A1, UGT8, and GSTM3 were examined by qRT-PCR. (B) The protein levels of ABCB1 and ALDH5A1 were examined by WB. **p < 0.01; ***p < 0.001, ****p < 0.0001.

Similar articles

Cited by

References

    1. Siegel, R. L., Miller, K. D. & Jemal, A. Cancer statistics, 2018. CA Cancer J Clin68, 7–30. 10.3322/caac.21442 (2018). - PubMed
    1. Hsieh, J. J. et al. Renal cell carcinoma. Nat Rev Dis Primers3, 17009. 10.1038/nrdp.2017.9 (2017). - PMC - PubMed
    1. Li, Q. K., Pavlovich, C. P., Zhang, H., Kinsinger, C. R. & Chan, D. W. Challenges and opportunities in the proteomic characterization of clear cell renal cell carcinoma (ccRCC): A critical step towards the personalized care of renal cancers. Semin Cancer Biol55, 8–15. 10.1016/j.semcancer.2018.06.004 (2019). - PMC - PubMed
    1. Makino, T., Kadomoto, S., Izumi, K. & Mizokami, A. Epidemiology and prevention of renal cell carcinoma. Cancers10.3390/cancers14164059 (2022). - PMC - PubMed
    1. Cui, Y. Q., Meng, F., Zhan, W. L., Dai, Z. T. & Liao, X. High expression of GSDMC is associated with poor survival in kidney clear cell cancer. Biomed Res Int2021, 5282894. 10.1155/2021/5282894 (2021). - PMC - PubMed

Publication types

Substances

LinkOut - more resources