. 2025 Jan 8;16(1):479.
doi: 10.1038/s41467-025-55828-8.

Biochemical and structural characterization of Rab3GAP reveals insights into Rab18 nucleotide exchange activity

Affiliations

Biochemical and structural characterization of Rab3GAP reveals insights into Rab18 nucleotide exchange activity

Gage M J Fairlie et al. Nat Commun. .

Abstract

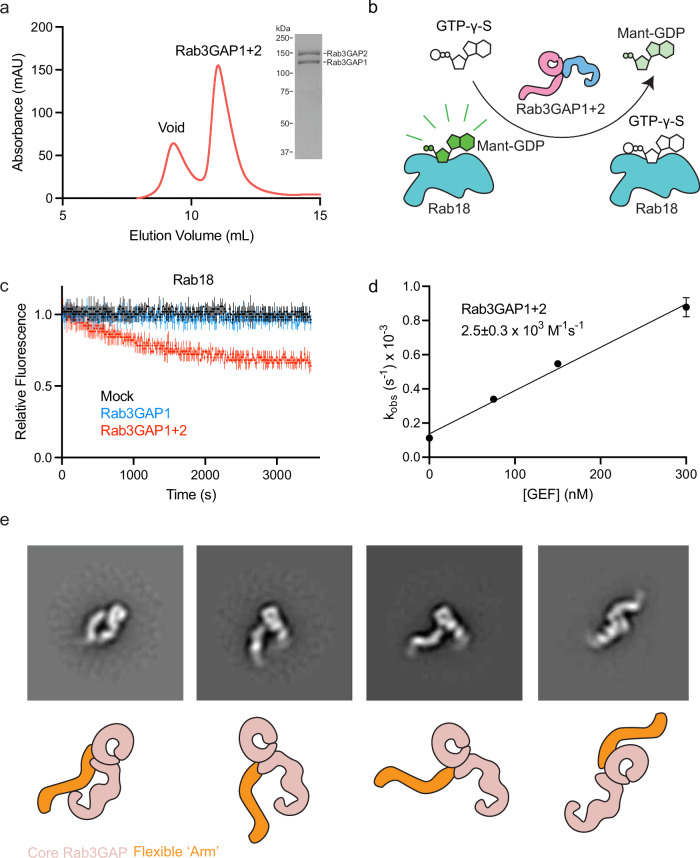
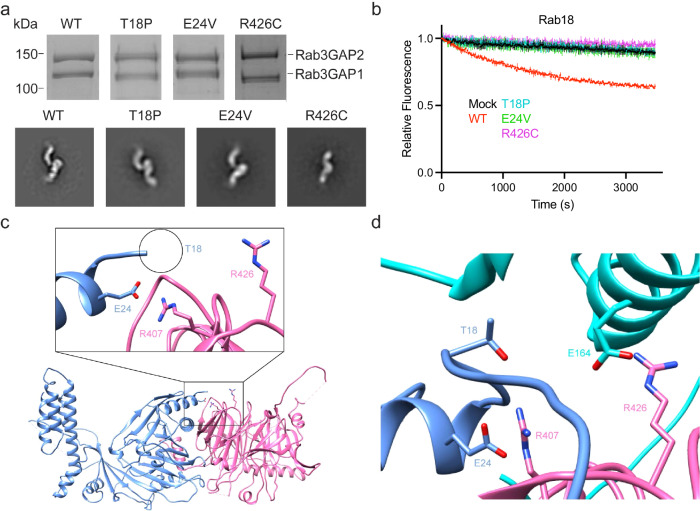
The heterodimeric Rab3GAP complex is a guanine nucleotide exchange factor (GEF) for the Rab18 GTPase that regulates lipid droplet metabolism, ER-to-Golgi trafficking, secretion, and autophagy. Why both subunits of Rab3GAP are required for Rab18 GEF activity and the molecular basis of how Rab3GAP engages and activates its cognate substrate are unknown. Here we show that human Rab3GAP is conformationally flexible and potentially autoinhibited by the C-terminal domain of its Rab3GAP2 subunit. Our high-resolution structure of the catalytic core of Rab3GAP, determined by cryo-EM, shows that the Rab3GAP2 N-terminal domain binds Rab3GAP1 via an extensive interface. AlphaFold3 modelling analysis together with targeted mutagenesis and in vitro activity assay reveal that Rab3GAP likely engages its substrate Rab18 through an interface away from the switch and interswitch regions. Lastly, we find that three Warburg Micro Syndrome-associated missense mutations do not affect the overall architecture of Rab3GAP but instead likely interfere with substrate binding.


Conflict of interest statement

Competing interests: J.E.B. reports personal fees from Scorpion Therapeutics and Reactive Therapeutics and research contracts from Novartis and Calico Life Sciences. All other authors declare no competing interests.

Figures

Fig. 1
Fig. 1. In vitro GEF assays and negative stain EM analysis reveal that reconstituted human Rab3GAP is a Rab18 GEF exhibiting conformational flexibility.
a Analytical gel filtration elution profile of Rab3GAP on an ENrich™ SEC 650 column and representative SDS-PAGE gel of the reconstituted complex stained with Coomassie Blue. Analytical gel filtration and SDS-PAGE gels were performed in biological triplicate (n = 3). b Schematic of in vitro GEF assays to assess nucleotide exchange activity towards Rabs using the fluorescent GDP analog, Mant-GDP. c GEF assays on Rab18 with Rab3GAP1 and Rab3GAP1/2. Nucleotide exchange was detected by measuring fluorescent decrease in reactions containing 0 nM GEF (Mock) or 300 nM GEF with 4 µM Mant-GDP loaded Rab18 and 100 µM GTPγS. Data are presented as mean with error bars showing SEM for assays performed in technical triplicate (n = 3). d Determination of catalytic efficiency (kcat/Km) using reactions with Rab3GAP1 + 2 (0–300 nM), 4 µM Mant-GDP loaded Rab18 and 100 µM GTPγS. Reactions were conducted in technical triplicate (n = 3). Data are presented as mean with error bars showing SEM and kcat/Km was calculated as described previously. e 2D class averages showing the general architecture of Rab3GAP and schematic representation of core Rab3GAP (pink) and the flexible arm (orange) adopting closed, V-shaped, and extended conformations. Source data are provided as a Source Data file.
Fig. 2
Fig. 2. In vitro GEF assays and negative stain EM analysis reveal that the reconstituted core Rab3GAP complex retains GEF activity towards Rab18 and adopts only one main conformation.
a Schematic of Rab3GAP1 with GAP domain annotated, and Rab3GAP2 domain 1 and Rab3GAP2 domain 2 connected by a flexible linker. b Analytical gel filtration elution profile of core Rab3GAP on an ENrich™ SEC 650 column and representative SDS-PAGE gel of the reconstituted complex stained with Coomassie Blue. Analytical gel filtration and SDS-PAGE gels were performed in biological triplicate (n = 3). c GEF assays on core Rab3GAP. Nucleotide exchange was detected by measuring fluorescent decrease in reactions containing 0 nM GEF (Mock) or 300 nM GEF with 4 µM Mant-GDP loaded Rab18 and 100 µM GTPγS. Data are presented as mean with error bars showing SEM for assays performed in technical triplicate (n = 3). d Representative 2D class averages comparing the general architecture of core Rab3GAP to full-length Rab3GAP. Schematic showing only a single conformation for core Rab3GAP compared to the open and closed conformation of full-length Rab3GAP, with Rab3GAP1 in blue and Rab3GAP2 in pink. Source data are provided as a Source Data file.
Fig. 3
Fig. 3. In vitro GEF assays reveal that core Rab3GAP has enhanced activity and membrane-presentation of Rab18 causes increased nucleotide exchange rate.
a In vitro GEF assays with full-length Rab3GAP or core Rab3GAP to detect activity towards Rab18. Nucleotide exchange was detected by measuring fluorescent decrease in reactions containing 0 nM GEF (Mock) or 300 nM GEF with 4 µM Mant-GDP loaded Rab18 and 100 µM GTPγS. Data are presented as mean with error bars showing SEM for assays performed in technical triplicate (n = 3). Data from Fig. 2c was used to generate this plot. b Determination of catalytic efficiency (kcat/Km) using reactions with full-length Rab3GAP or core Rab3GAP (0–300 nM), 4 µM Mant-GDP loaded Rab18 and 100 µM GTPγS. Reactions were conducted in technical triplicate (n = 3). Data are presented as mean with error bars showing SEM and kcat/Km was calculated as described previously. Data from Fig. 1d was used to generate this plot. c Schematic of Mant-GDP based GEF activation assay with C-terminally His-tagged Rab18 anchored to NiNTA-containing lipid vesicles. d Evaluation of membrane regulation for full-length or core Rab3GAP activity towards Rab18. Catalytic efficiency (kcat/Km) was calculated using reactions with full-length Rab3GAP or core Rab3GAP (0–15 nM), 4 µM Mant-GDP loaded Rab18, 0.2 mg mL−1 liposomes (75% PC, 20% PE, 5% 18:1 DGS-NTA(Ni), 100 nm) and 100 µM GTPγS. Reactions were conducted in technical triplicate (n = 3). Data are presented as mean with error bars showing SEM and kcat/Km was calculated as described previously. e Comparison between various membrane compositions with respect to regulation of Rab3GAP activity. Nucleotide exchange was detected by measuring fluorescent decrease in reactions containing 300 nM GEF, 4 µM Mant-GDP loaded Rab18, 100 µM GTPγS and 100 nm extruded liposomes with various lipid composition (Supplementary Table 2) at 0.2 mg mL−1. Data are presented as mean with error bars showing SEM for assays performed in technical triplicate (n = 3). f Data from e was fit to a non-linear one-phase exponential decay model to determine the rate of nucleotide exchange (kobs). Data are presented as mean with error bars showing SEM. p values were generated using an ordinary one-way Anova (ns indicates p > 0.05). Source data are provided as a Source Data file.
Fig. 4
Fig. 4. Cryo-EM structure of core Rab3GAP.
a Side views of the locally refined cryo-EM density map of the core Rab3GAP solved to 3.39 Å resolution from 170,636 particles. Map was processed using Phenix. b Local resolution of the cryo-EM map estimated in cryoSPARC. c Cryo-EM density and model for selected regions near the interface of the obtained map. d Atomic model and structural architecture of the core Rab3GAP complex. Rab3GAP1 and Rab3GAP2(1–544) are displayed in blue and pink, respectively.
Fig. 5
Fig. 5. HDX-MS differences between the free Rab3GAP1 and the Rab3GAP complex.
a Rab3GAP1 regions showing significant differences in deuterium exchange (defined as >5%, >0.4 Da, and p < 0.01 in an unpaired two-tail t-test at any time point) upon complex formation with Rab3GAP2 are highlighted on the cryo-EM structure. The differences in deuterium exchange are indicated by the legend in (a). b Sum of the number of deuteron difference of Rab3GAP1 upon complex formation with Rab3GAP2, analyzed over the entire deuterium exchange time course for Rab3GAP1. Each point is representative of the center residue of an individual peptide. Peptides that met the significance criteria described in (a) are colored red. Experiments were performed in technical triplicate (n = 3). Each point represents a single peptide, and data are presented as the sum of the mean number of deuteron difference across all 5 time points (n = 3) and error bars represent the sum of standard deviations across all 5 time points (n = 3 for each time point). Domain schematic above depicts Rab3GAP1 architecture, with the thin box representing unmodelled residues in (a). c Selected deuterium exchange time courses of Rab3GAP1 peptides that showed significant decreases and increases in exchange. Data are presented as mean values with error bars representing SD from experiments performed in technical triplicate (n = 3). A full list of all peptides and their deuterium incorporation are provided as a Source Data file.
Fig. 6
Fig. 6. AlphaFold3, targeted mutagenesis and in vitro GEF assays reveal that the Rab3GAP subunit interface mediates an interaction with Rab18 through a platform opposite of the switch regions.
a AlphaFold3 prediction of the interaction between Rab18 and core Rab3GAP. Rab3GAP1 in light blue, Rab3GAP2(1–544) in pink, Rab18 in cyan with switch I, switch II and p-loop colored in red, orange, and yellow, respectively. b Zoomed in view of AlphaFold3 model showing predicted electrostatic interactions at the Rab18-Rab3GAP binding interface. Residues predicted to form salt bridges (Rab3GAP2 R426 with Rab18 E164, Rab3GAP1 E13 and E31 with Rab18 R133 and R141 respectively) are shown as sticks and labeled on the structure. c In vitro GEF assays with full-length Rab3GAP to detect activity against Rab18 with mutations suspected of disrupting the Rab3GAP binding interface. Nucleotide exchange was detected by measuring fluorescent decrease in reactions containing 0 nM GEF (Mock) or 400 nM GEF with 4 µM Mant-GDP loaded Rab18 (WT, R133A, R141A or E164A) and 100 µM GTPγS. Data are presented as mean with error bars showing SEM for assays performed in technical triplicate (n = 3). d Data from Fig. 4c was fit to a non-linear one-phase exponential decay model to determine the rate of nucleotide exchange (kobs). Data are presented as mean with error bars showing SEM. p values were generated using a two-tailed Student’s t tests (***p < 0.01). e Nucleotide exchange was detected by measuring fluorescent decrease in reactions containing 0 nM GEF (Mock) or 300 nM GEF with 4 µM Mant-GDP loaded Rab18 and 100 µM GTPγS. Data are presented as mean with error bars showing SEM for assays performed in technical triplicate (n = 3). f GTPase activity was measured using the Promega GTPase-Glo assay with reactions containing 0 nM GAP (Mock) or 500 nM GAP, 5 µM GTP and 8 µM GST-Rab3a. Data are presented as mean with error bars showing SEM for assays performed in technical triplicate (n = 3), with p values generated using a two-tailed Student’s t tests (*p < 0.05). Source data are provided as a Source Data file.
Fig. 7
Fig. 7. Clinical Rab3GAP WMS mutants have impaired activity due to disruptions at the Rab18 binding interface as revealed by in vitro GEF assays and mutation mapping.
a SDS-PAGE gel of purified Rab3GAP complex containing Rab3GAP1 T18P, Rab3GAP1 E24V or Rab3GAP2 R426C mutations stained with Coomassie Blue. 2D class averages comparing the general architecture of WT Rab3GAP to complexes containing T18P, E24V or R426C point mutations. SDS-PAGE gel were performed in biological triplicate (n = 3). b In vitro GEF assays with clinical Rab3GAP WMS mutants to detect activity towards Rab18. Nucleotide exchange was detected by measuring fluorescent decrease in reactions containing 0 nM GEF (Mock) or 300 nM GEF with 4 µM Mant-GDP loaded Rab18 and 100 µM GTPγS. Data are presented as mean with error bars showing SEM for assays performed in technical triplicate (n = 3). c Zoomed in view showing Rab3GAP WMS mutants mapped onto the cryo-EM structure of core Rab3GAP. Residues mutated in WMS are shown as sticks and the predicted position of the T18P mutation is circled in black. d Zoomed in view of the AlphaFold3 generated model showing the WMS mutants mapped to the predicted Rab18 binding interface. Residues mutated in WMS and residues predicted to interact electrostatically with WMS residues are shown as sticks and labeled. Rab3GAP1 in light blue, Rab3GAP2(1–544) in pink and Rab18 in cyan. Source data are provided as a Source Data file.

References

    1. Derby, M. C. & Gleeson, P. A. New insights into membrane trafficking and protein sorting. Int. Rev. Cytol.261, 47–116 (2007). - PubMed
    1. Linders, P. T. A., Peters, E., Ter Beest, M., Lefeber, D. J. & van den Bogaart, G. Sugary logistics gone wrong: membrane trafficking and congenital disorders of glycosylation. Int. J. Mol. Sci.21, 1–28 (2020). - PMC - PubMed
    1. Yarwood, R., Hellicar, J., Woodman, P. G. & Lowe, M. Membrane trafficking in health and disease. Dis. Model Mech.13, dmm043448 (2020). - PMC - PubMed
    1. Li, G. Rab GTPases, membrane trafficking and diseases. Curr. Drug Targets12, 1188 (2011). - PMC - PubMed
    1. Müller, M. P. & Goody, R. S. Molecular control of Rab activity by GEFs, GAPs and GDI. Small GTPases9, 5–21 (2018). - PMC - PubMed

MeSH terms

Substances

Supplementary concepts

LinkOut - more resources