. 2025 Jan 8;15(1):1314.
doi: 10.1038/s41598-024-85024-5.

Hippocampal dendritic spines store-operated calcium entry and endoplasmic reticulum content is dynamic microtubule dependent

Affiliations

Hippocampal dendritic spines store-operated calcium entry and endoplasmic reticulum content is dynamic microtubule dependent

Anastasiya Rakovskaya et al. Sci Rep. .

Abstract

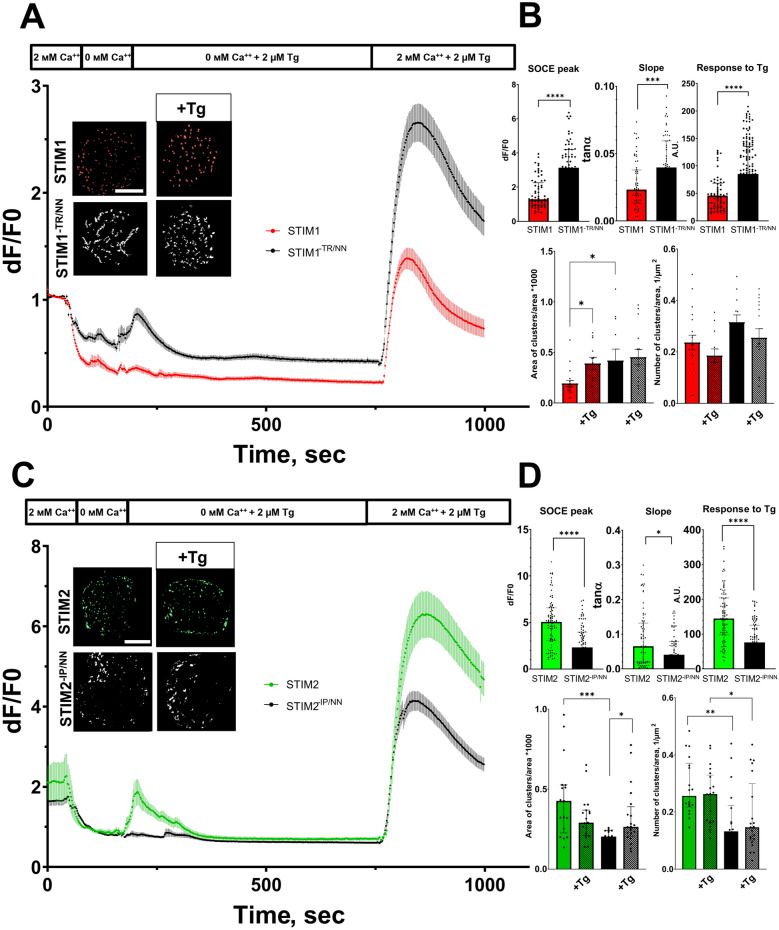
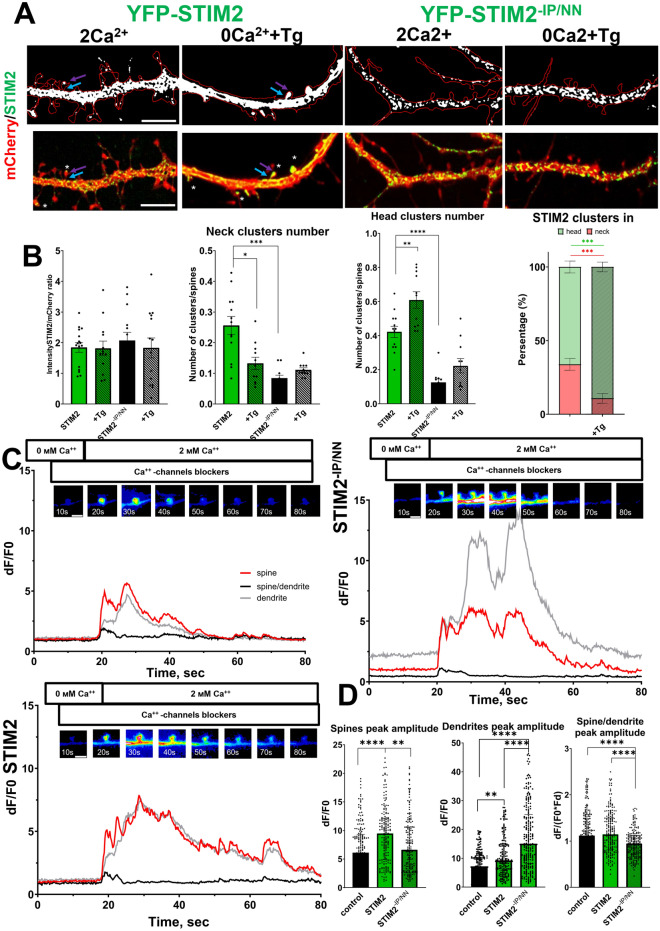
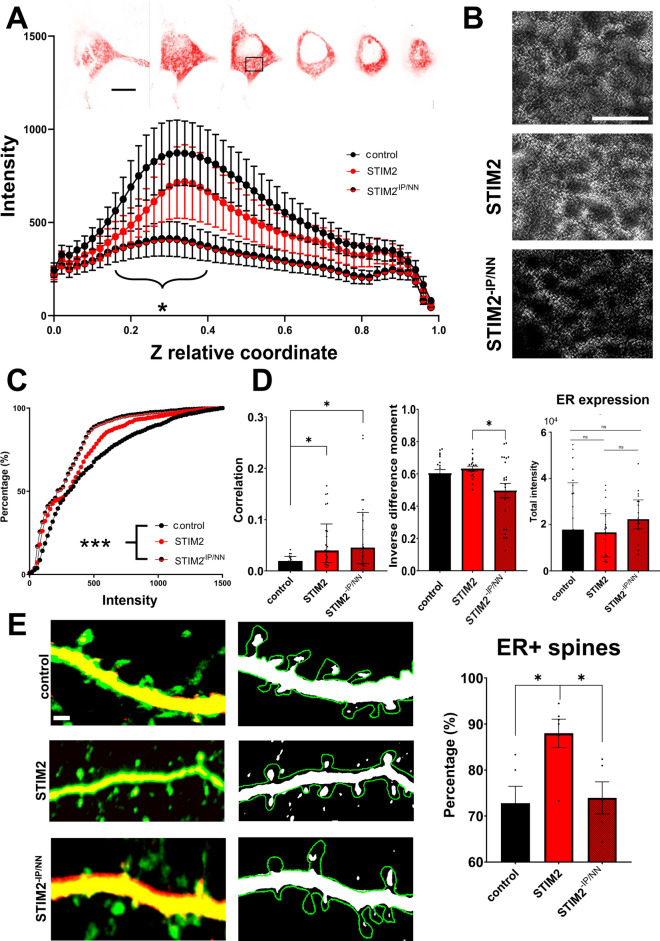
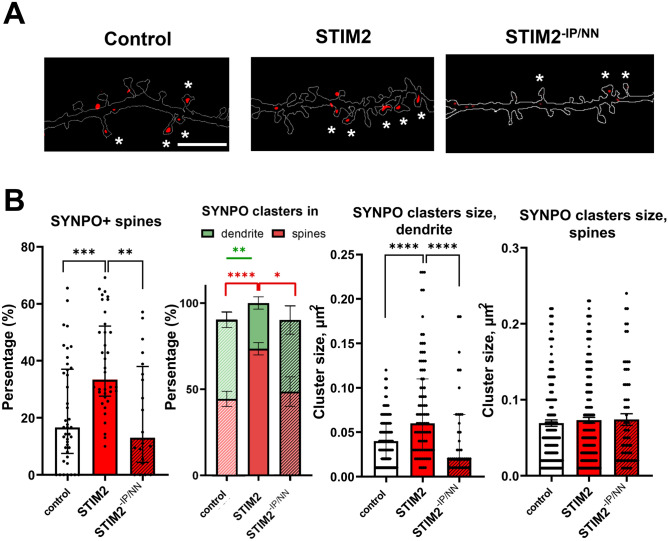
One of the mechanisms of calcium signalling in neurons is store-operated calcium entry (SOCE), which is activated when the calcium concentration in the smooth endoplasmic reticulum (ER) decreases and its protein-calcium sensor STIM (stromal interacting molecule) relocate to the endoplasmic reticulum and plasma membrane junctions, forms clusters and induces calcium entry. In electrically non-excitable cells, STIM1 is coupled with the positive end of a tubulin microtubule through interaction with EB1 (end-binding) protein, which controls its oligomerization, SOCE and participates in ER movement. STIM2 homologue, which is specific for mature hippocampal dendritic spines, is known to interact with EB3 protein, however, not much is known about the role of this interaction in STIM2 clustering or ER trafficking in neurons. Intriguingly, in neurons, reducing the expression of EB3 protein or disrupting the interaction of STIM2 protein with EB proteins results in decreased SOCE, in contrast to experiments with STIM1 in non-excitable cells. In this study, these two homologues are compared side-by-side in HEK-293T, and it is shown for the first time that their clustering and SOCE is oppositely regulated by dynamic tubulin microtubules. In particular, for STIM2, the interaction with dynamic microtubule cytoskeleton is required for clustering and is shown to potentiate SOCE, while for STIM1 this interaction restricts clustering, resulting in SOCE decrease. After store depletion in primary hippocampal neurons, the wild type STIM2 is redistributed from the necks to the heads of dendritic spines, while the STIM2 variant with a mutation that disrupts the interaction with EB proteins is excluded from dendritic spines. In addition, overexpression of the mutant variant leads to ER reorganization in neuronal soma and reduction of ER presence in spines. It also leads to a reduction in the number of spines containing the spine apparatus formed by ER cisternae, as well as a reduction in dendritic spines SOCE. These effects are opposite of those detected during overexpression of the wild type STIM2. Considered together, these findings underline the important role of dynamic microtubules in regulation of neuronal SOCE and ER morphology.

Keywords: Dendritic spine; Dynamic microtubules; EB proteins; End-binding proteins; Endoplasmic reticulum; STIM puncta; Spine apparatus; Store-operated calcium entry.


Conflict of interest statement

Declarations. Competing interests: The authors declare no competing interests.

Figures

Fig. 1
Fig. 1
Dynamic tubulin microtubules oppositely regulate STIM1 and STIM2 proteins induced SOCE and clustering. (A) Binarized images of detected STIM1 and STIM1−TR/NN protein clusters in HEK-293T cells after expansion microscopy in the control group and in cells incubated with thapsigargin (Tg) for 10 min. Scale bar corresponds to 5μm. SOCE triggered by 2 µM Tg treatment, monitored by GCaMP5.3 ratio in HEK-293T cells transfected with Cherry-STIM1 (red trace) or Cherry-STIM1−TR/NN (black trace). (B) Bar charts show average SOCE peak (Mann–Whitney test), speed of entries (initial slope) (Mann–Whitney test), peak response to Tg (Mann–Whitney test), Tukey’s tes). (C) Binarized images of detected STIM2 and STIM2−IP/NN protein clusters in HEK-293T cells after expansion microscopy in the control group and in cells incubated with Tg for 10 min. Scale bar corresponds to 5μm. SOCE triggered by 2 µM Tg treatment, monitored by GCaMP5.3 ratio in HEK-293T cells transfected with CFP-STIM2 (green trace ) or CFP-STIM2−IP/NN(black trace). (D) Bar charts show average SOCE peak (Mann–Whitney test), speed of entries (initial slope) (Mann–Whitney test), peak response to Tg (Mann–Whitney test), area of (Conover-Iman test) and number of STIM2 clusters (Conover-Iman test). n ≥ 16 cells from 3 batches of cultures ****p < 0.0001, ***p < 0.001, **p < 0.01, *p < 0.05).
Fig. 2
Fig. 2
STIM2 localization in dendritic spines and SOCE is EB-proteins dependent. (A) Confocal and binary images of primary hippocampal dendrites co-transfected with plasmids encoding mCherry and STIM2 or STIM2−IP/NN at 7 DIV and fixed at DIV 16–17 in normal condition (2Ca2+) and after ER depletion with thapsigargin (0Ca2++Tg).The purple arrow indicates the head and blue arrow indicates the neck of the dendritic spines. Scale bar corresponds to 5μm. (B) Bar charts show the fluorescence intensity STIM2 normalized to Cherry (one-way ANOVA), number of STIM2 and STIM2−IP/NN protein clusters in head (Tukey’s test) and neck (Dunnett’s T3 test) of dendritic spines and the percentage of STIM2 clusters in spine head and neck under normal conditions and with Tg (Mann–Whitney test). (C) Synaptic GCaMP6f Ca2+ signals at resting state and after Ca2+ readdition (F/F0 of spine—red, F/(F0*Fdendrite)—black, F/F0 of dendrite—gray) are shown for DIV14 hippocampal neurons transfected with GCaMP6f or co-transfected with GCaMP6f and CFP-STIM2, CFP-STIM2−IP/NN, plasmids at DIV7. Scale bar corresponds to 1 μm. (D) Bar charts show average synaptic SOCE peak (Dunn’s test), average dendrite SOCE peak (Dunn’s test) and average synaptic SOCE peak normalized to dendritic signals (Dunn’s test). n ≥ 21 neurons from 3 batches of cultures (****p < 0.0001; ***p < 0.001; **p < 0.01; *p < 0.05).
Fig. 3
Fig. 3
Dynamic tubulin microtubules lead to endoplasmic reticulum reorganization in the soma and dendritic spines of hippocampal neurons via STIM2-EB interaction. (A) Intensity of fluorescence of endoplasmic reticulum in the soma of primary hippocampal neurons transfected with DsRed-ER or co-transfected with plasmids encoding DsRed-ER and STIM2 or STIM2−IP/NN distribution plotted against relative cell Z coordinate, snippets of a confocal Z stack illustrate the movement along the cell coordinate (Mann–Whitney test, see supplement table S1). Scale bar corresponds to 10μm. (B) Confocal images of endoplasmic reticulum from the boxed region in (A). Scale bar corresponds to 5μm. (C) Cumulative distribution of endoplasmic reticulum fluorescent signal (Kolmogorov–Smirnov test). (D) Bar charts show average Inverse Difference Moment of confocal images of endoplasmic reticulum (Dunnet T3 test), median gray level co-occurrence matrix correlation (Correlation) (Dunn’s test) and median total intensity of fluorescence of ER (Dunn’s test). (E) Confocal images and binarized confocal images of primary hippocampal dendrites transfected with DsRed-ER or co-transfected with plasmids encoding DsRed and STIM2 or STIM2−IP/NN and transducted with GFP lentivirus. Scale bar corresponds to 1μm. Bar chart shows average ER-positive spine percentage (Tukey’s test). n ≥ 19 neurons from 3 batches of cultures (***p < 0.001; *p < 0.05).
Fig. 4
Fig. 4
STIM2-EB interaction potentiates spine apparatus formation in hippocampal neuron dendritic spines. (A) Binarized confocal images of primary hippocampal neuron dendrites co-transfected with plasmids encoding GFP and CFP-STIM2 or GFP and CFP-STIM2−IP/NN at DIV 7, fixed at DIV 16–17 and incubated with anti-synaptopodin antibodies (red). Scale bar corresponds to 5μm. (B) Bar charts show the percentage of dendritic spines containing synaptopodin clusters (Dunn’s test), the percentage of synaptopodin clusters in spines and dendrite (Dunnett’s T3 test), synaptopodin cluster size in dendrites (Dunn’s test) and dendritic spines (Kruskal–Wallis test). n ≥ 36 neurons from 3 batches of cultures (****p < 0.0001, ***p < 0.001, **p < 0.01).

Similar articles

References

    1. Berridge, M. J. Neuronal calcium signaling. Neuron21(1), 13–26 (1998). - PubMed
    1. Putney J. W., Jr. Store-operated calcium channels. Handb. Cell Signal.66, 911–914 (2010).
    1. Parekh, A. B. & Putney, J. W. Jr. Store-operated calcium channels. Physiol. Rev.85(2), 757–810 (2005). - PubMed
    1. Lewis, R. S. Calcium signaling mechanisms in T lymphocytes. Annu. Rev. Immunol.19(1), 497–521 (2001). - PubMed
    1. Fahrner, M. et al. A coiled-coil clamp controls both conformation and clustering of stromal interaction molecule 1 (STIM1). J. Biol. Chem.289(48), 33231–33244 (2014). - PMC - PubMed

Publication types

MeSH terms

LinkOut - more resources