. 2025 Jan 8;15(1):1339.
doi: 10.1038/s41598-025-85569-z.

Identification of a novel disulfidptosis-related gene signature in osteoarthritis using bioinformatics analysis and experimental validation

Affiliations

Identification of a novel disulfidptosis-related gene signature in osteoarthritis using bioinformatics analysis and experimental validation

Mingjie Wei et al. Sci Rep. .

Abstract

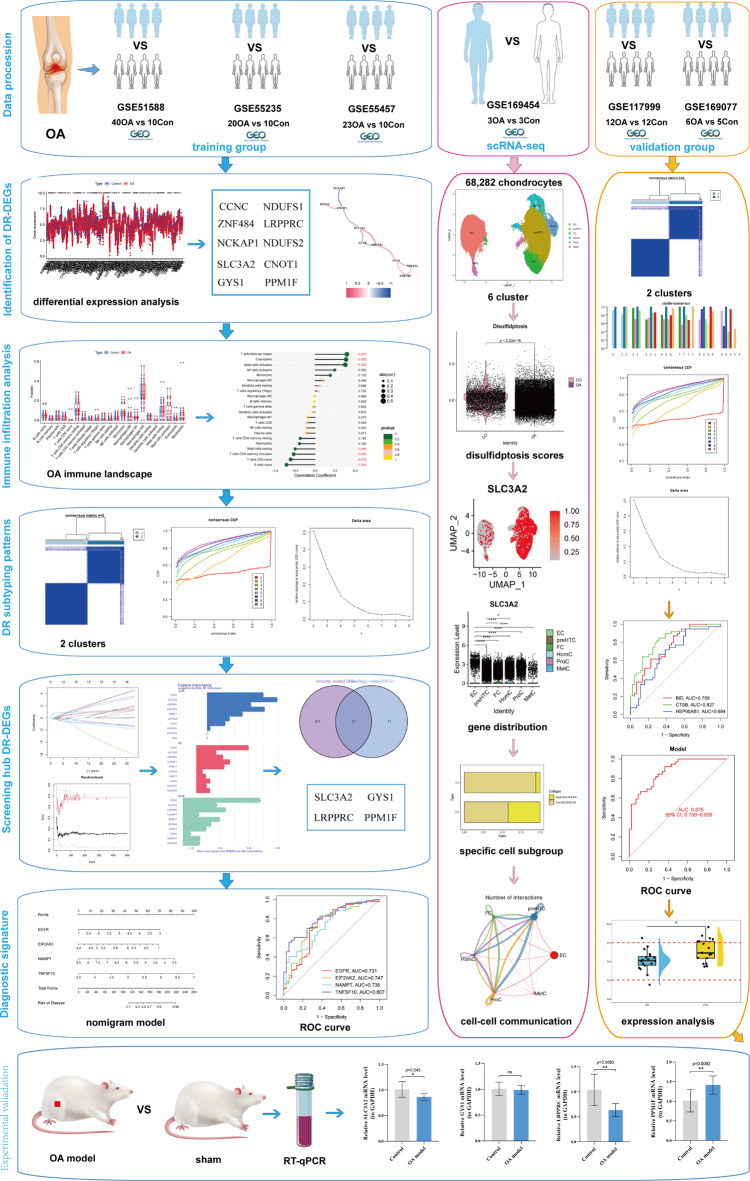
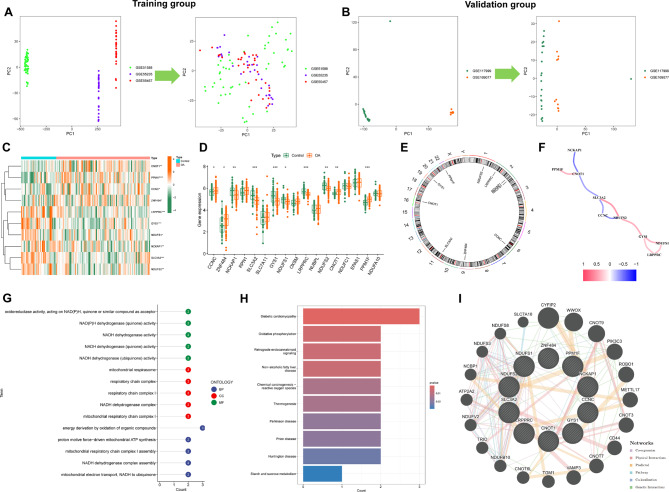
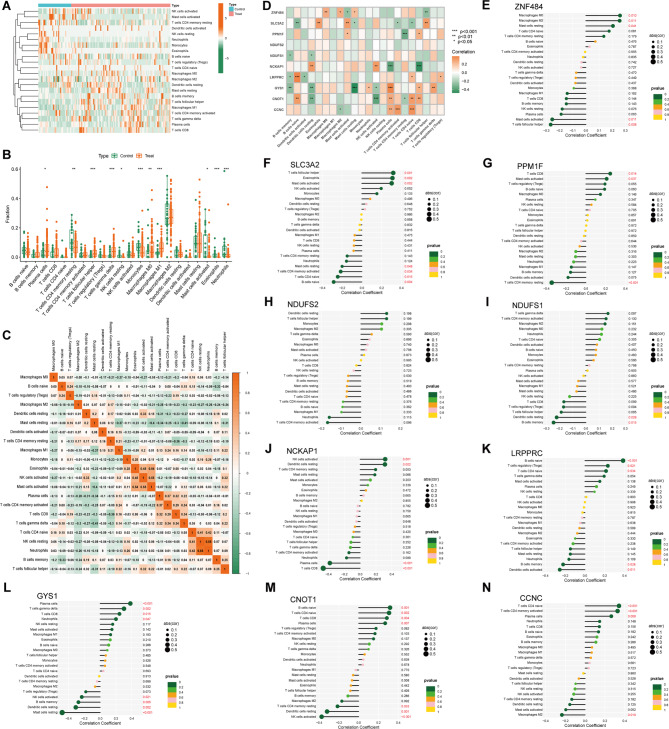
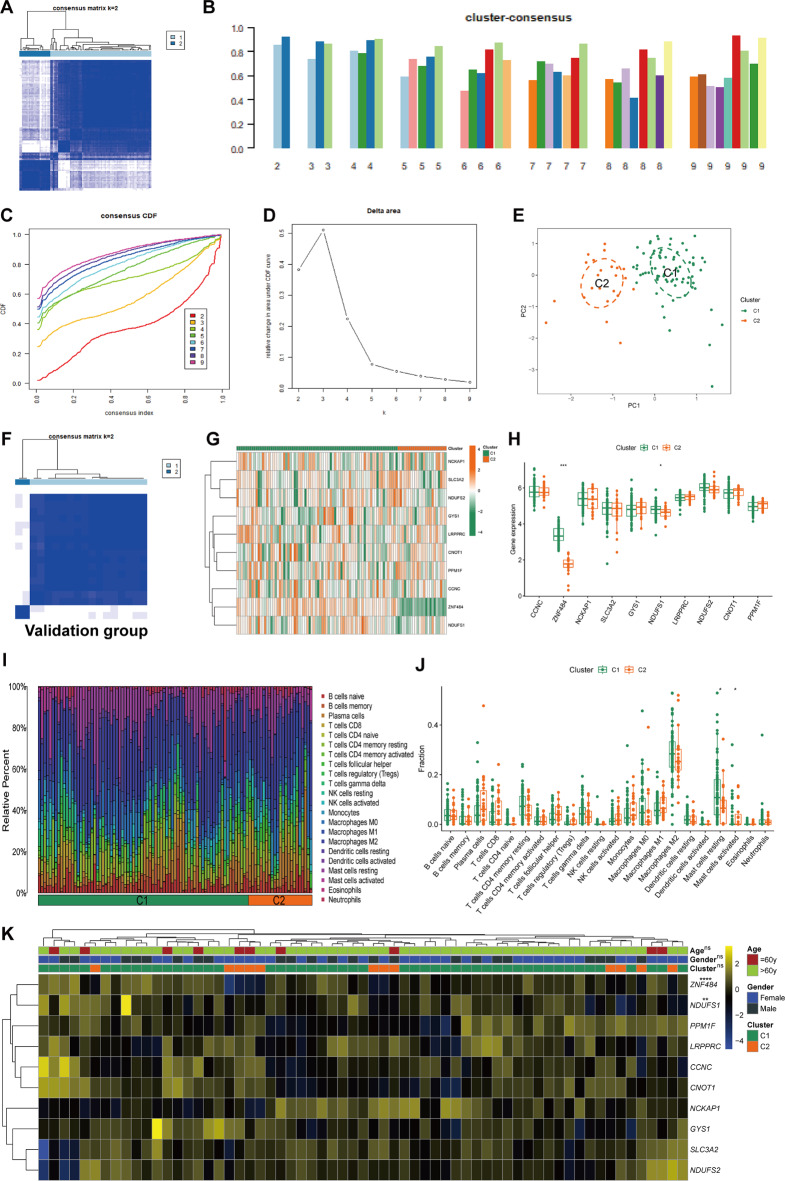
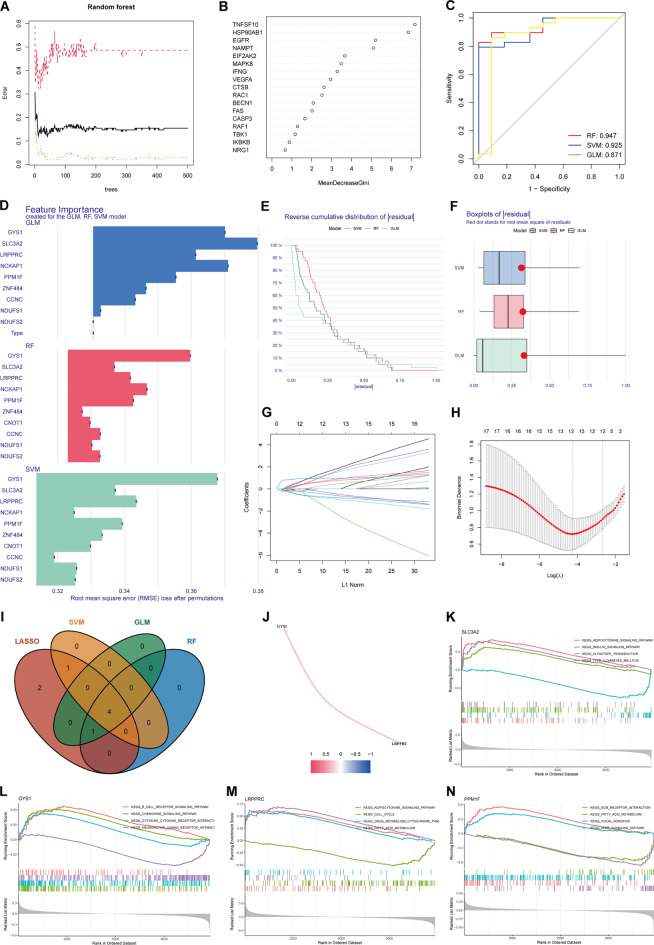
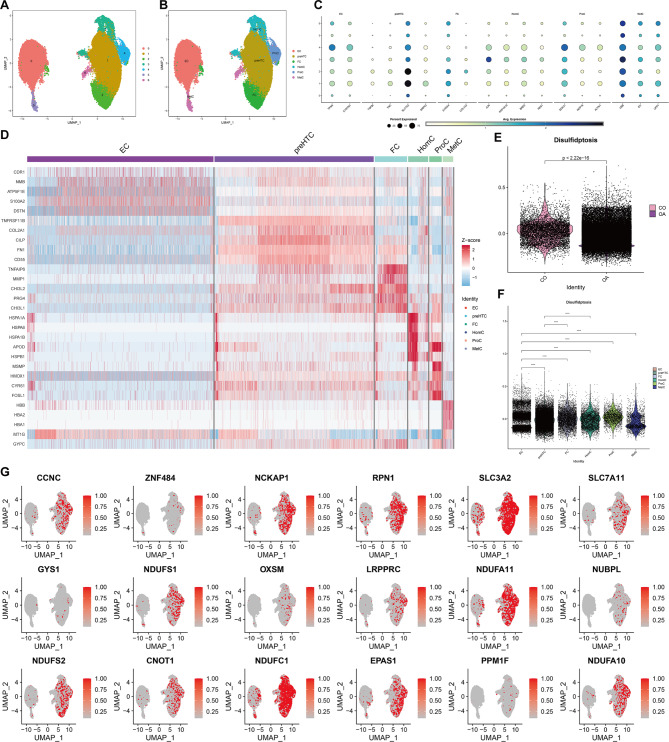
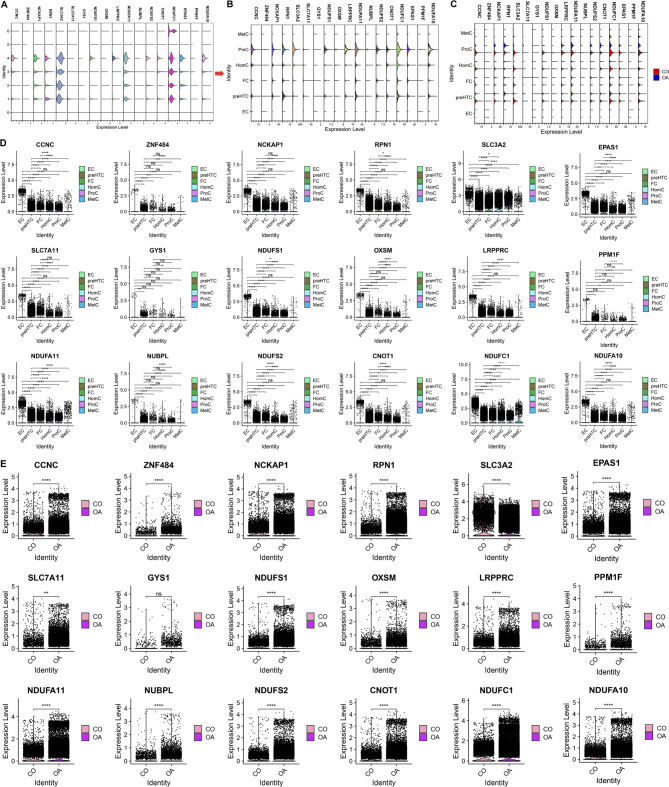
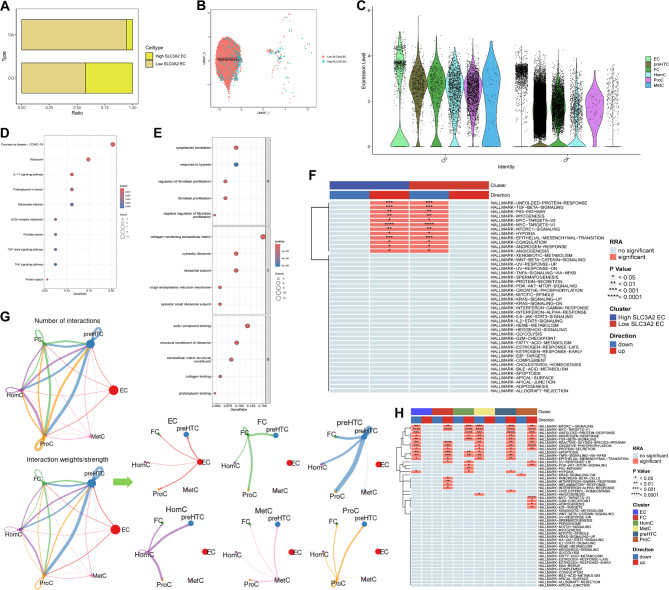
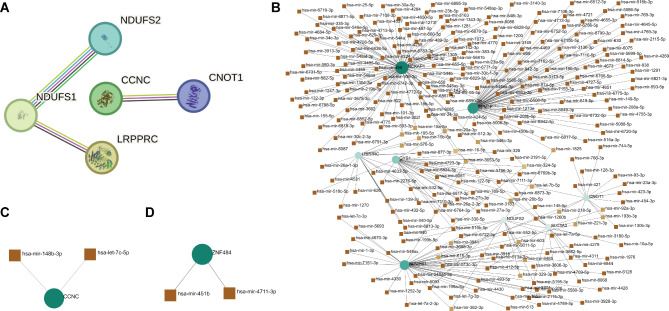
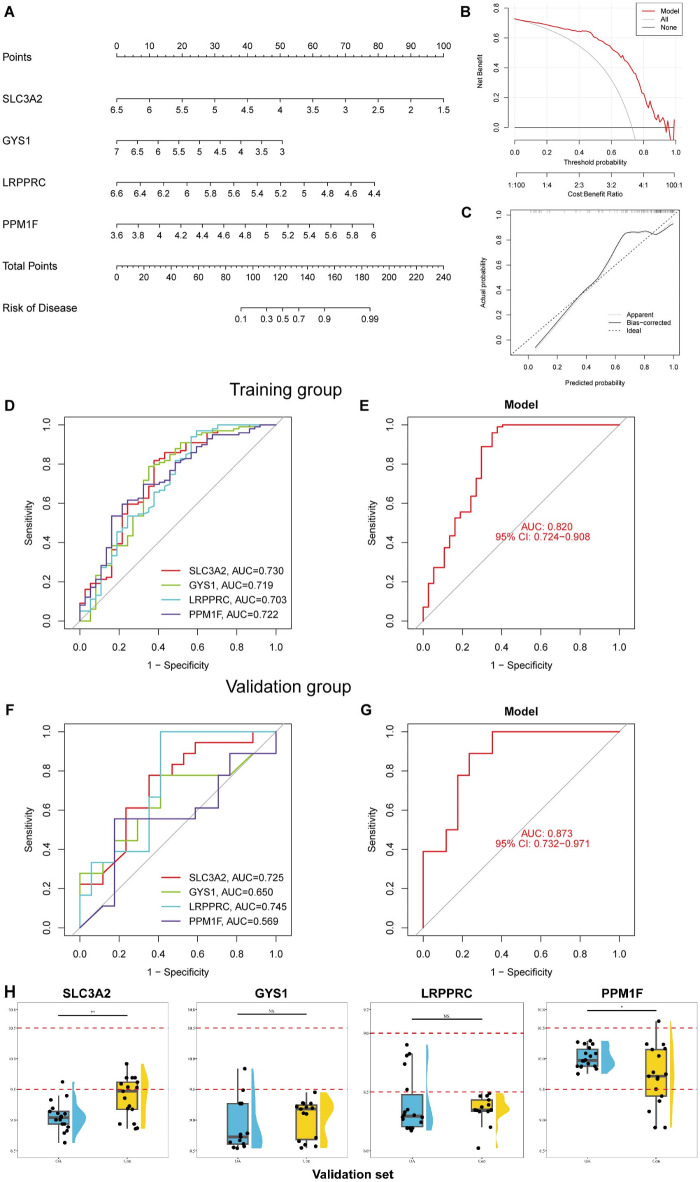
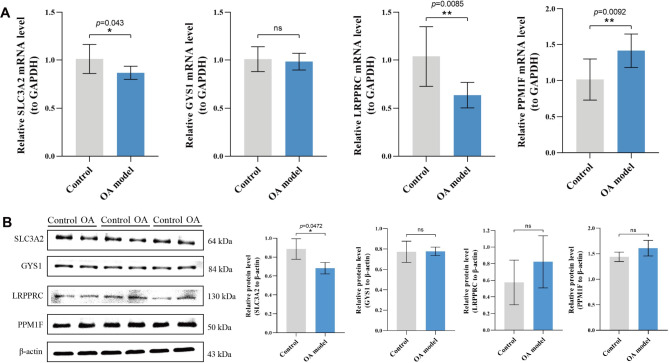
Osteoarthritis (OA) is a degenerative bone disease characterized by the destruction of joint cartilage and synovial inflammation, involving intricate immune regulation processes. Disulfidptosis, a novel form of programmed cell death, has recently been identified; however, the effects and roles of disulfidptosis-related genes (DR-DEGs) in OA remain unclear. We obtained six OA datasets from the GEO database, using four as training sets and two as validation sets. Differential expression analysis was employed to identify DR-DEGs, and unique molecular subtypes of OA were constructed based on these DR-DEGs. Subsequently, the immune microenvironment of OA patients was comprehensively analyzed using the "CIBERSORT" algorithm for immune infiltration. Various machine learning algorithms were utilized to screen characteristic DR-DEGs, and nomogram models and ROC curves were built based on these genes. The scRNA dataset (GSE169454) was used to classify chondrocytes in OA samples into distinct cell types, further exploring the gene distribution and correlation of characteristic DR-DEGs with specific cell subpopulations. Moreover, the expression levels of four characteristic DR-DEGs were validated through OA cell models and rat models. In our study, we identified 10 DR-DEGs with significant differences in expression within OA samples. Based on these DR-DEGs, two distinct molecular subtypes were recognized (cluster 1 and 2). ZNF484 and NDUFS1 were found to be significantly overexpressed in subtype 1, while the infiltration abundance of activated mast cells was markedly elevated in subtype 2. Moreover, significant differences were observed in the infiltration proportions of 11 immune cell types between OA and control samples, with 9 DR-DEGs demonstrating substantial correlations with immune cell infiltration levels. Further analysis of the scRNA dataset revealed that SLC3A2 and NDUFC1 were predominantly expressed in the preHTC subpopulation. All 10 DR-DEGs exhibited notably higher expression in the EC subpopulation across various cell types. The proportion of EC subgroups with high SLC3A2 expression increased, mainly enriching pathways related to inflammation, such as the IL-17 signaling pathway and TGF-beta signaling pathway. Using machine learning, we identified four characteristic DR-DEGs, which, in combination with the nomogram and ROC models, demonstrated promising performance in the diagnosis of OA. Additionally, in vivo validation confirmed a significant elevation of PPM1F expression in OA models. This study identified DR-DEGs as potential biomarkers for the diagnosis and classification of OA and provided a preliminary understanding of their role in the immune microenvironment. However, further experimental and clinical studies are required to validate their diagnostic value and therapeutic potential.

Keywords: Chondrocyte; Diagnosis; Disulfidptosis; Osteoarthritis; Single-cell sequencing.


Conflict of interest statement

Competing interests: The authors declare no competing interests. Informed consent: 920th Hospital of Joint Logistics Support Force Committee on Ethics approved this study and consented to participate (2024-053-01), and all methods are reported in accordance with ARRIVE guidelines.

Figures

Fig. 1
Fig. 1
Flowchart of this study.
Fig. 2
Fig. 2
Identification of disulfidptosis-related differentially expressed genes (DR-DEGs) in OA patients. (A) Principal component analysis (PCA) plots before and after batch correction in the training set. (B) PCA plots before and after batch correction in the validation set. (C) Heatmap of the 10 DR-DEGs. Green represents low expression genes in the samples, and orange represents high expression genes in the samples. (D) Differential expression analysis of the 17 DRGs. Green represents control samples, and orange represents OA samples. (E) Circos plot illustrating the chromosomal location distribution of the top 9 DR-DEGs. (F) Correlation analysis of the top 9 DR-DEGs. Blue indicates negative correlation, and red indicates positive correlation. (G) GO functional analysis of the 10 DR-DEGs, including BP, MF, and CC. (H) KEGG pathway analysis of the 10 DR-DEGs. (I) Gene-miRNAs interaction analysis of the 10 DR-DEGs. *P < 0.05, **P < 0.01, ***P < 0.001, ****P < 0.0001.
Fig. 3
Fig. 3
Comprehensive immune landscape of OA patients. (A) Heatmap of the differences in 22 immune infiltrating cell types. Green represents low expression cells, and red represents high expression cells. (B) Box plot showing the expression differences of 22 different immune cells in OA and control samples. Green represents control samples, and red represents OA samples. (C) Correlation analysis of the infiltration levels of 22 immune cell types. Green indicates negative correlation, and red indicates positive correlation. (D) Correlation analysis of the expression levels of the 10 DR-DEGs with the infiltration levels of 22 immune cells. The correlation analysis of ZNF484 (E), SLC3A2 (F), PPM1F (G), NDUFS2 (H), NDUFS1 (I), NCKAP1 (J), LRPPRC (K), GYS1 (L), CNOT1 (M), and CCNC (N) with the infiltration levels of the 22 immune cells. *P < 0.05, **P < 0.01, ***P < 0.001, ****P < 0.0001.
Fig. 4
Fig. 4
Determining molecular subtypes of OA patients based on DR-DEGs. (A) Consensus matrix heatmap (cluster K = 2). (B) Consensus clustering scores (cluster K = 2–9). (C) Cumulative distribution functions of consistency (CDF) for the 2–9 clusters, illustrating the area under the curve. (D) Selecting an appropriate K value using delta area. (E) PCA analysis (cluster K = 2). (F) Consensus matrix heatmap in the OA validation cohort (cluster K = 2). (G) Heatmap of the expression of the 10 DR-DEGs in different samples. Green represents low expression genes, and orange represents high expression genes. (H) Expression differences of the 10 DR-DEGs between two different clusters. (I) Immune landscape of the two different clusters. (J) Differential infiltration proportions of 22 immune cells between the two different clusters. (K) Heatmap displays the relationship of 10 DR-DEGs and clinical features in OA patients (OA cluster, age and gender). *P < 0.05, **P < 0.01, ***P < 0.001, ****P < 0.0001.
Fig. 5
Fig. 5
Screening of key DR-DEGs using multiple machine learning algorithms. (A) Random forest (RF) model. (B) Ranking the importance of the 10 DR-DEGs based on MeanDecreaseGini values. (C) ROC curves for RF, SVM, and GLM. (D) Importance ranking of feature genes in RF, SVM, and GLM. (E) Reverse cumulative distribution of residual in RF, SVM, and GLM. (F) Box plot of residual in RF, SVM, and GLM. (G) Coefficient distribution plot of Lasso regression analysis. (H) Cross-validation curve. (I) Intersection of DR-DEGs from four machine learning algorithms. (J) Correlation analysis of GYS1 and LRPPRC. Single-gene GSEA in SLC3A2 (K), GYS1 (L), LRPPRC (M) and PPM1F (N).
Fig. 6
Fig. 6
Identification of chondrocyte subpopulations. (A) UMAP representation of the different 7 cell clusters (cluster = 0–6). (B) UMAP representation of the 6 distinct chondrocyte subpopulations with different features. (C) Specific markers for the 6 cell types. (D) Subtyping heatmap of the 6 chondrocyte subpopulations. (E) Differences in disulfidptosis gene set scores between OA and control samples. (F) Differences in disulfidptosis gene set scores among the 6 different chondrocyte cell types. (G) Violin plot showing the expression of the 18 DR-DEGs in OA chondrocytes. *P < 0.05, **P < 0.01, ***P < 0.001, ****P < 0.0001.
Fig. 7
Fig. 7
Expression analysis of DR-DEGs in OA chondrocyte subpopulations. (A) Expression of the 18 DR-DEGs among the 7 cell clusters. (B) Expression of the 18 DR-DEGs among the 6 different OA chondrocyte subpopulations. (C) Composite violin plot showing the expression of the 18 DR-DEGs among the 6 different OA chondrocyte subpopulations in OA and control samples, respectively. (D) Expression differences of the 18 DR-DEGs among the different OA chondrocyte subpopulations. (E) Expression differences of the 18 DR-DEGs between OA and control samples. *P < 0.05, **P < 0.01, ***P < 0.001, ****P < 0.0001.
Fig. 8
Fig. 8
Expression and functional analysis of SLC3A2 in ECs. (A) Proportion of High-TIMP1 EC and Low-TIMP1 EC groups in OA and control samples. (B) UMAP representation showing the gene distribution of High-TIMP1 EC and Low-TIMP1 EC groups. (C) Expression level of SLC3A2 among the 6 OA chondrocyte cell types in OA and control samples, respectively. (D) KEGG pathway analysis between High-TIMP1 EC and Low-TIMP1 EC groups. (E) GO functional analysis between High-TIMP1 EC and Low-TIMP1 EC groups. (F) Hallmark gene set enrichment analysis between High-TIMP1 EC and Low-TIMP1 EC groups. (G) Communication networks among different cell types. (H) Hallmark gene set enrichment analysis among different cell types. *P < 0.05, **P < 0.01, ***P < 0.001, ****P < 0.0001.
Fig. 9
Fig. 9
Potential molecular mechanisms of key DR-DEGs. (A) Protein-protein interaction network. (B) Gene-TF-miRNA network based on key DR-DEGs. (C) ZNF484 and CCNC-miRNA interaction network.
Fig. 10
Fig. 10
Nomogram model and ROC curve based on characteristic DR-DEGs in OA training sets. (A) Nomogram model for OA patients. (B) Clinical decision curve for OA patients. (C) Fitted curves in OA training sets. (D) ROC curve of key DR-DEGs in OA training sets. (E) A Logistic regression model was constructed based on the OA training set. (F) ROC curve of key DR-DEGs in OA validation sets. (G) A Logistic regression model was constructed based on the OA validation set. (H) The expression levels of SLC3A2, GYS1, LRPPRC, and PPM1F in the OA validation set.
Fig. 11
Fig. 11
RT-qPCR validation of key DR-DEGs. (A) The expression levels of SLC3A2, GYS1, LRPPRC, and PPM1F in the OA models. (B) The protein expression levels of SLC3A2, GYS1, LRPPRC, and PPM1F in the OA model group and the control group were compared.

Similar articles

References

    1. Perruccio, A. V. et al. Osteoarthritis year in review 2023: epidemiology & therapy. Osteoarthr. Cartil. (2023). - PubMed
    1. Jang, S., Lee, K. & Ju, J. H. Recent updates of diagnosis, pathophysiology, and treatment on Osteoarthritis of the knee. Int. J. Mol. Sci.22, 5 (2021). - PMC - PubMed
    1. Mandl, L. A. Osteoarthritis year in review 2018: clinical. Osteoarthr. Cartil.27(3), 359–364 (2019). - PubMed
    1. Sharma, L. et al. Knee tissue lesions and prediction of incident knee osteoarthritis over 7 years in a cohort of persons at higher risk. Osteoarthr. Cartil.25(7), 1068–1075 (2017). - PMC - PubMed
    1. Zhang, Y. & Jordan, J. M. Epidemiology of osteoarthritis. Clin. Geriatr. Med.26(3), 355–369 (2010). - PMC - PubMed

Publication types