. 2025 Jan;637(8047):974-982.
doi: 10.1038/s41586-024-08371-3. Epub 2025 Jan 8.

Bidirectional histone monoaminylation dynamics regulate neural rhythmicity

Affiliations

Bidirectional histone monoaminylation dynamics regulate neural rhythmicity

Qingfei Zheng et al. Nature. 2025 Jan.

Abstract

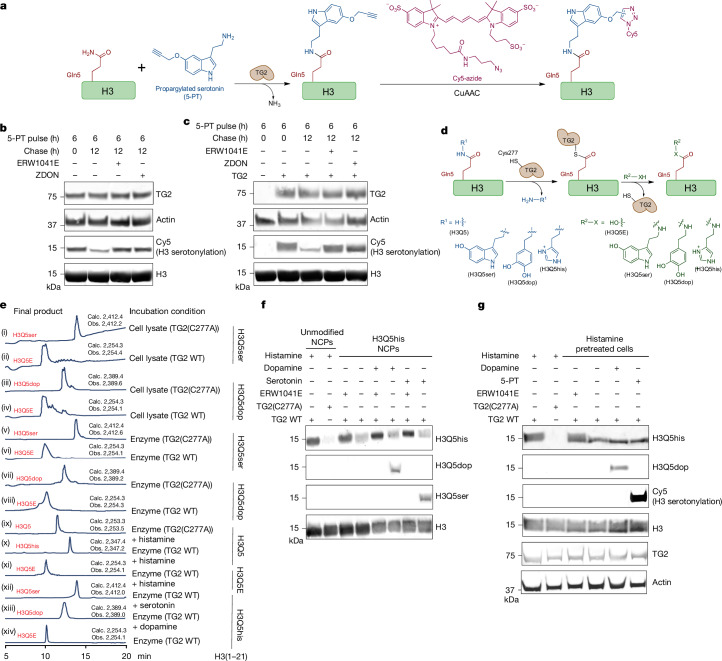
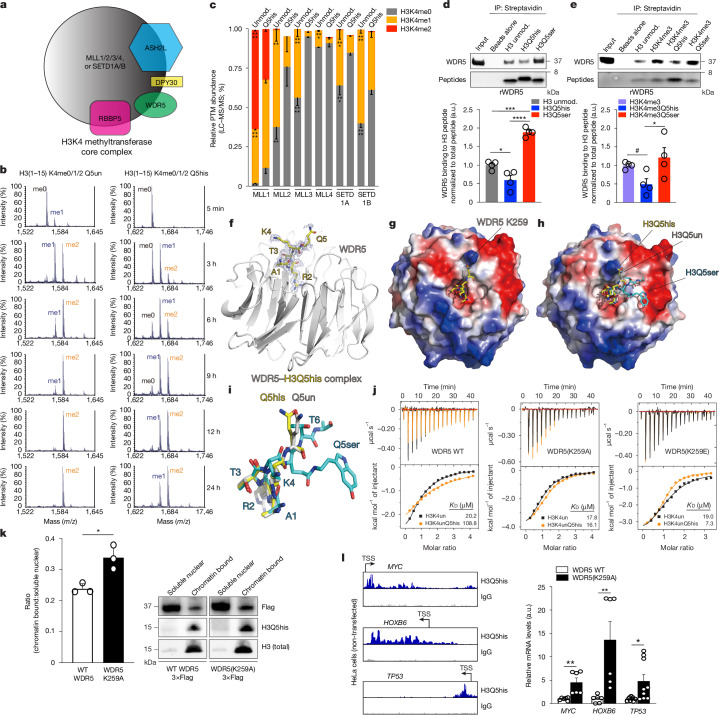
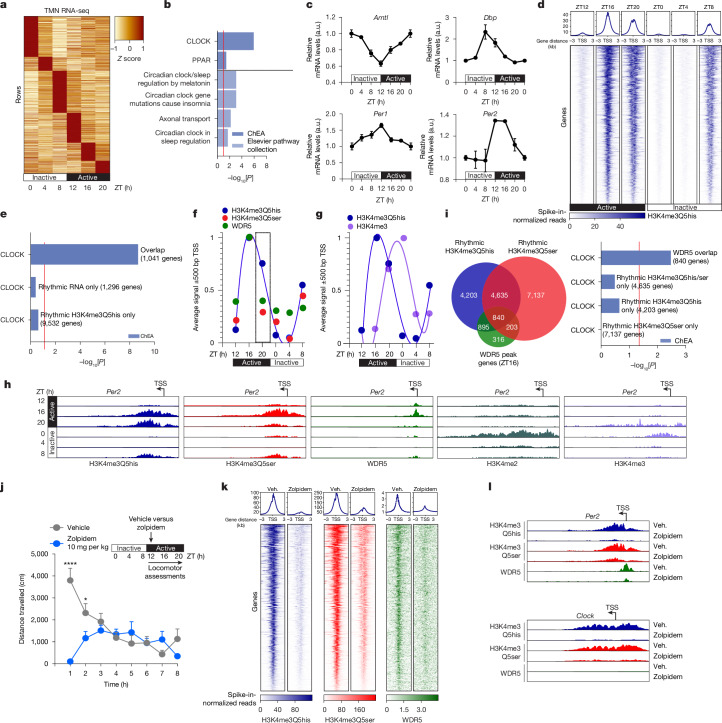
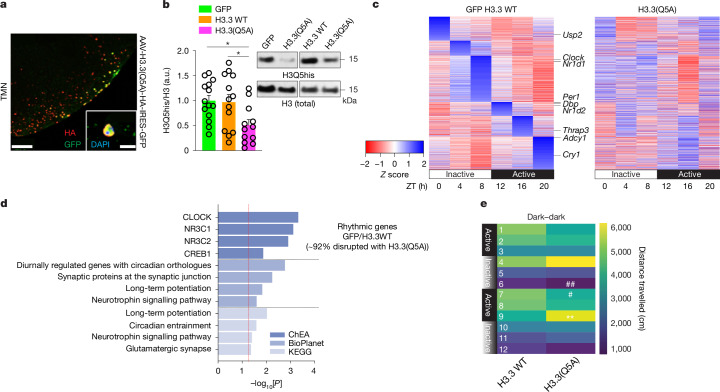
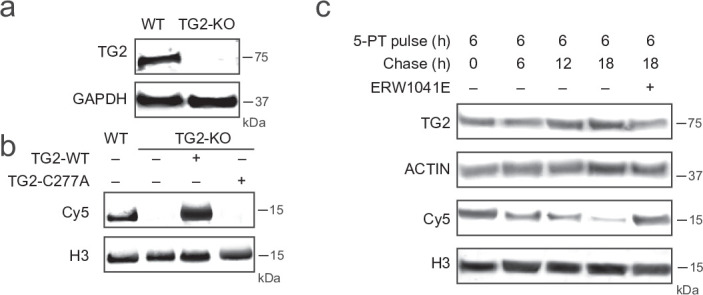
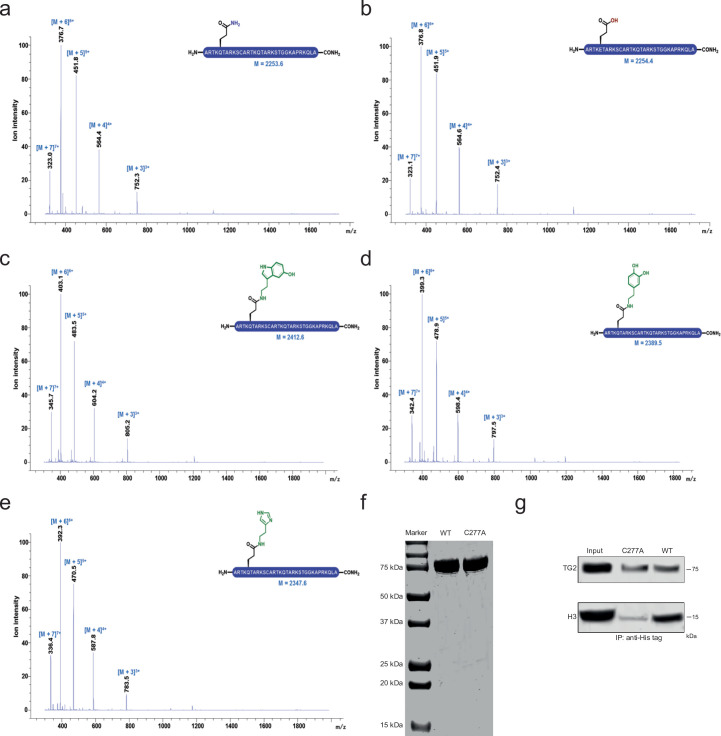
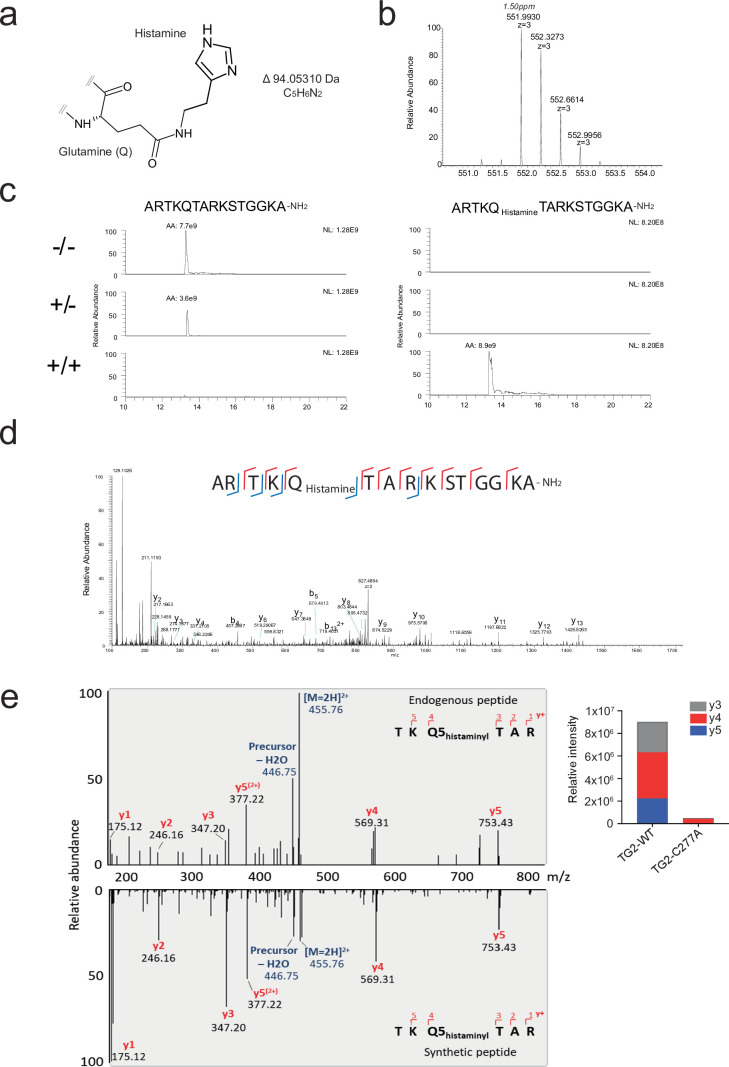
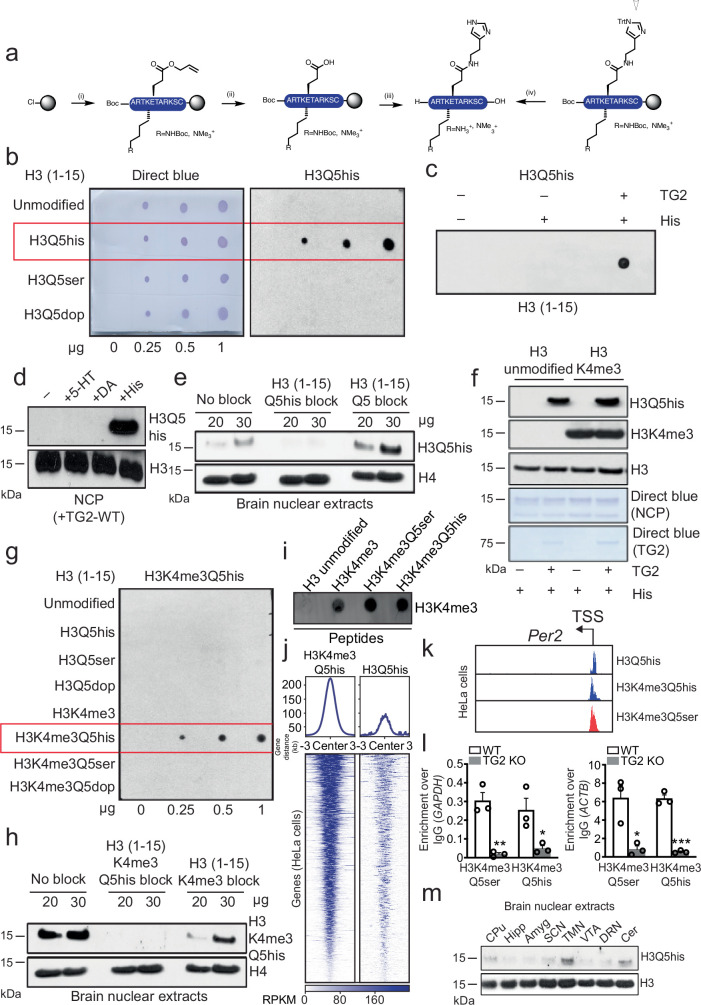
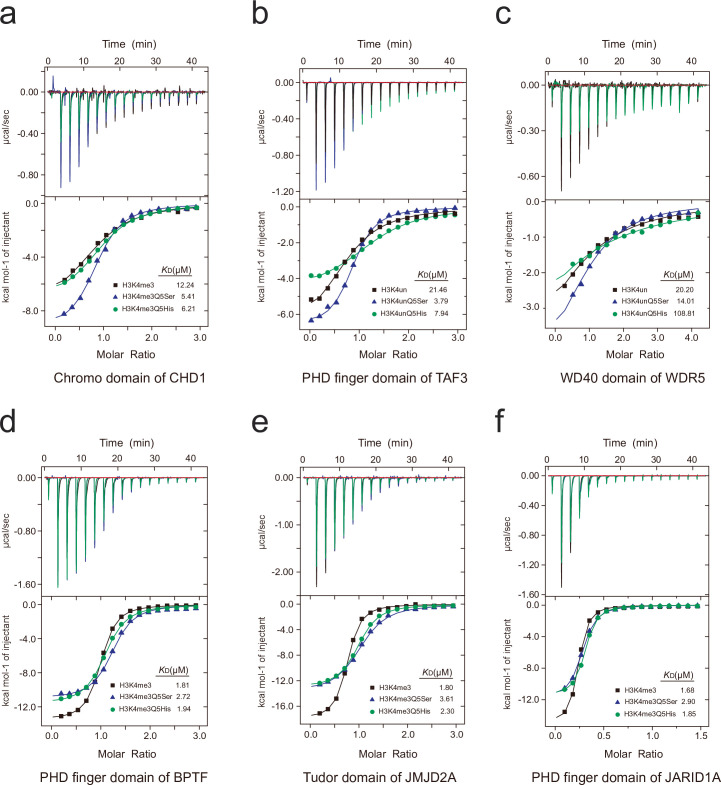
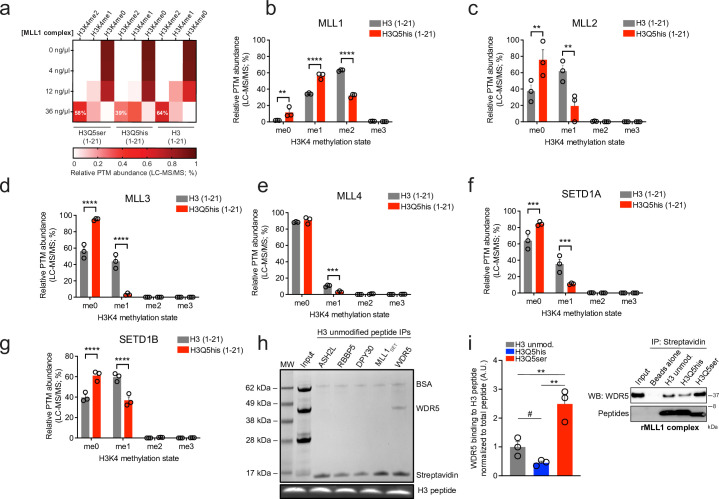
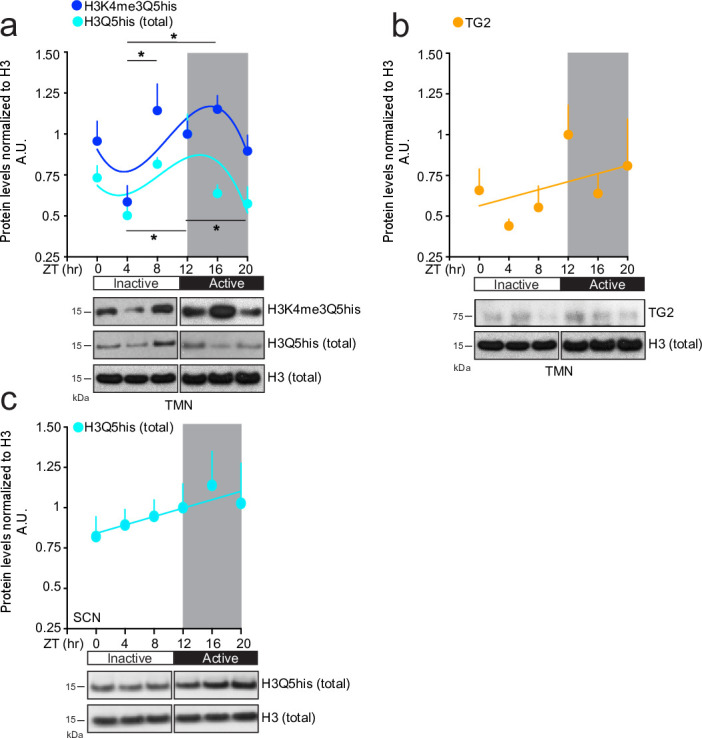
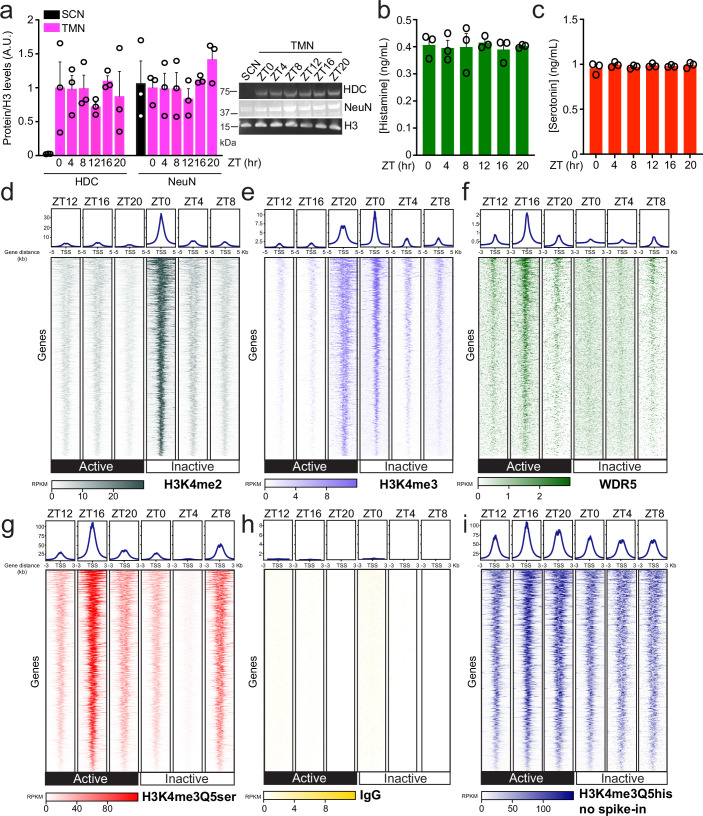
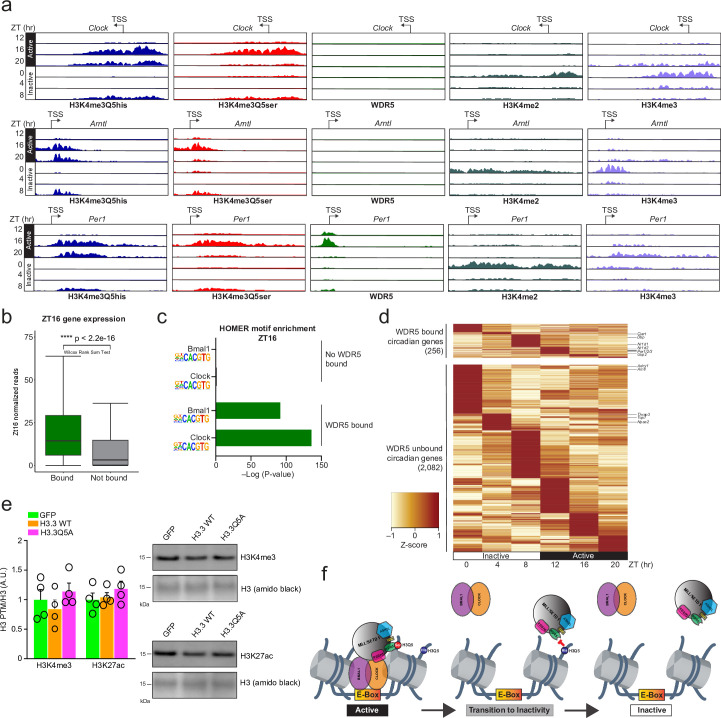
Histone H3 monoaminylations at Gln5 represent an important family of epigenetic marks in brain that have critical roles in permissive gene expression1-3. We previously demonstrated that serotonylation4-10 and dopaminylation9,11-13 of Gln5 of histone H3 (H3Q5ser and H3Q5dop, respectively) are catalysed by transglutaminase 2 (TG2), and alter both local and global chromatin states. Here we found that TG2 additionally functions as an eraser and exchanger of H3 monoaminylations, including H3Q5 histaminylation (H3Q5his), which displays diurnally rhythmic expression in brain and contributes to circadian gene expression and behaviour. We found that H3Q5his, in contrast to H3Q5ser, inhibits the binding of WDR5, a core member of histone H3 Lys4 (H3K4) methyltransferase complexes, thereby antagonizing methyltransferase activities on H3K4. Taken together, these data elucidate a mechanism through which a single chromatin regulatory enzyme has the ability to sense chemical microenvironments to affect the epigenetic states of cells, the dynamics of which have critical roles in the regulation of neural rhythmicity.


Conflict of interest statement

Competing interests: The authors declare no competing interests.

Figures

Fig. 1
Fig. 1. TG2 is a writer, eraser and exchanger of H3 monoaminylations.
a, TG2-mediated covalent modification of H3Q5 by 5-PT, and its visualization by CuAAC-meditated Cy5 conjugation. b, 5-PT pulse–chase in HeLa cells treated with or without TG2 inhibitors (ERW1041E or ZDON) after removal of 5-PT. Western blotting was performed for Cy5 (that is, H3 serotonylation) and TG2. c, 5-PT pulse–chase experiment in HEK293T cells transfected with WT TG2 and treated with or without TG2 inhibitors after removal of 5-PT. Western blotting was performed for Cy5 and TG2. d, Suggested mechanism for TG2-mediated H3 monoaminylation writing, erasing and exchange. e, LC–MS analysis of modified H3 peptides (as well as a deamidated H3Q5E peptide standard) (xi) after incubation with cellular lysates expressing WT TG2 versus TG2(C277A) (i–iv) or recombinant WT TG2 versus TG2(C277A) (v–x). H3Q5his peptide was incubated with WT TG2 in the presence or absence of replacement monoamine donors (xii (serotonin) versus xiii (dopamine)), demonstrating WT TG2-mediated deamidation of H3 monoaminylations in the absence of replacement donors (xiv), and exchange of H3 monoaminylations in the presence of replacement donors. Calculated (calc.) versus observed (obs.) masses are provided. High-performance LC (HPLC) UV traces, λ = 214 nm. f, WT TG2, but not TG2(C277A), transamidated histamine to H3Q5 on NCPs. NCPs premodified by histamine at H3Q5 could be deamidated by WT TG2, which was inhibited by treatment with ERW1041E. WT TG2 exchanged H3Q5his on NCPs in the presence of replacement donors, resulting in the establishment of H3Q5ser or H3Q5dop. NCP, nucleosome core particle. g, WT TG2, but not TG2(C277A), transamidated histamine to H3Q5 in HEK293T cells. H3Q5his-premodified histones could be deamidated by WT TG2 in cellulo, which was inhibited by treatment with ERW1041E. WT TG2 exchanged H3Q5his in cellulo in the presence of replacement donors, such as 5-PT (Cy5) or dopamine. H3 and actin were used as loading controls for western blotting. All of the experiments were repeated three times. Uncropped blots are shown in Supplementary Fig. 1.
Fig. 2
Fig. 2. H3Q5his antagonizes H3K4 methyltransferase activities and WDR5 binding.
a, H3K4 methyltransferase complexes. b, MALDI-TOF analysis of MLL1-mediated H3K4 methylation on peptides. n = 1 per peptide per timepoint. Q5un, unmodified Gln5. c, LC–MS/MS analysis of MLL–SETD1-mediated H3K4 methylation on peptides. n = 3 per peptide per complex. **P < 0.01, ***P < 0.001, ****P < 0.0001. Statistical details are provided in Extended Data Fig. 6b–g. Unmod, unmodified. d, Peptide IPs against WDR5. Streptavidin was used to visualize peptides after IP (used for normalization). n = 4 per peptide. Statistical analysis was performed using one-way analysis of variance (ANOVA) (P < 0.0001, F2,9 = 57.34) with Tukey’s multiple-comparison test; significant comparisons are noted (H3un versus H3Q5his (*P = 0.0243); H3un versus H3Q5ser (***P = 0.0001); H3Q5his versus H3Q5ser (****P < 0.0001)). e, Peptide IPs against WDR5. Streptavidin was used to visualize peptides after IP (used for normalization). n = 4 per peptide. Statistical analysis was performed using one-way ANOVA (P = 0.0492, F2,9 = 4.287) with Tukey’s multiple-comparison test; significant comparisons are noted (H3K4me3Q5his versus H3K4me3Q5ser (*P = 0.0456)); #P = 0.0177 indicates a significant difference as determined using an a posteriori unpaired Student’s t-test (t6 = 3.237). f,g, Electron density map (f) and electrostatic potential surface view (g) of the WDR5-WD40–H3Q5his complex. The peptide is shown as sticks. h,i, Electrostatic potential surface view (h) and amino acid orientation (i) of alignments between WDR5-WD40–H3Q5un versus WDR5-WD40–H3Q5ser versus WDR5-WD40–H3Q5his. j, ITC assessments of WDR5-WD40 (left), WDR5-WD40(K259A) (middle) or WDR5-WD40(K259E) (right) peptide binding. k, 3×Flag-tagged WT versus K259A WDR5 chromatin binding in HeLa cells. n = 3 biological replicates per construct. Statistical analysis was performed using unpaired Student’s t-tests (t4 = 4.163); *P = 0.0141. l, Quantitative PCR (qPCR) analysis (right) of H3Q5his-enriched target genes in HeLa cells (IGV browser tracks of H3Q5his versus IgG enrichment at H3Q5his targets are shown on the left) after transfection with WDR5 WT versus WDR5(K259A). Statistical analysis was performed using unpaired Student’s t-tests for each gene (MYC: **P = 0.0052, t10 = 3.559, n = 6 per group; HOXB6: **P = 0.0098, t10 = 3.182, n = 6 per group; TP53: *P = 0.0186, t16 = 2.620, n = 9 biological replicates per group). Uncropped blots are shown in Supplementary Fig. 1. Data are mean ± s.e.m. a.u., arbitrary units, all normalized to the respective controls. Source data
Fig. 3
Fig. 3. Neural H3Q5 monoaminylations are diurnally rhythmic.
a, RNA-seq analysis of the mouse TMN across ZT (JTKcycle, Padj < 0.05). n = 3 biological replicates per timepoint. b, Ontology analysis (P < 0.05) of RNA-seq data from a. c, Known circadian genes identified in a. d, CUT&RUN–seq enrichment for H3K4me3Q5his across ZT at genic loci in TMN. n = 3 biological replicates per timepoint (JTKcycle, Padj < 0.05). e, Ontology analysis (P < 0.05) comparing enrichment of CLOCK-mediated gene targets for genes displaying rhythmic H3K4me3Q5his only versus circadian genes not displaying rhythmic H3K4me3Q5his and/or gene expression. f, The average signal intensity ±500 bp from the transcription start site (TSS) across ZT for H3 monoaminylations and WDR5. g, The average signal intensity ±500 bp from the TSS across ZT for H3K4me3Q5his and H3K4me3. h, IGV tracks for Per2 across ZT for H3 monoaminylations versus WDR5 versus H3K4me2/3. i, Overlap of rhythmic H3 monoaminylation genes with WDR5-enriched genes at ZT16 (left), and ontology analysis (P < 0.05) comparing enrichment of CLOCK-mediated gene targets for genes displaying rhythmic H3 monoaminylation versus WDR5 enrichment at ZT16 (right). j, Locomotor activity in mice treated with zolpidem (n = 12 mice) versus vehicle (n = 13 mice) during their active phase. Statistical analysis was performed using repeated-measures two-way ANOVA (main effects of interaction, time × zolpidem: P < 0.0001, F7,161 = 11.98) with Tukey’s multiple-comparison test; significant post hoc comparisons (vehicle (veh.) versus zolpidem) are noted (1 h: ****P < 0.0001; 2 h: *P = 0.0412). k, CUT&RUN–seq enrichment for H3 monoaminylations and WDR5 at ZT20 after treatments with zolpidem versus vehicle (at ZT12) at genic loci in TMN. n = 3 biological replicates per timepoint. l, IGV tracks for Per2 and Clock at ZT20 for H3 monoaminylations and WDR5 after treatments with zolpidem versus vehicle (at ZT12) at genic loci in the TMN. Data are mean ± s.e.m. Source data
Fig. 4
Fig. 4. H3Q5 monoaminylations causally contribute to transcriptional and behavioural rhythmicity.
a, Immunohistochemistry and immunofluorescence analysis confirming nuclear expression of H3.3(Q5A)–HA in the TMN of mice expressing AAV-H3.3(Q5A)-HA-IRES-GFP. The experiment was repeated three times. b, Western blot validation of H3Q5his downregulation in the TMN after AAV-mediated expression of H3.3(Q5A) (n = 12 biological replicates) versus H3.3 WT (n = 13 biological replicates) or empty vector controls (n = 13 biological replicates). Statistical analysis was performed using one-way ANOVA (P = 0.0154, F2,36 = 4.701) with Tukey’s multiple-comparison test; significant comparisons are noted (GFP versus H3.3(Q5A): *P = 0.0228; WT H3.3 versus H3.3(Q5A): *P = 0.0378). Data are mean ± s.e.m. normalized to total H3 signal. a.u. are normalized to GFP controls. c, RNA-seq data from the mouse TMN across ZT for mice that were transduced with GFP (n = 32 mice) or WT H3.3 (n = 39 mice) (collapsed; JTKcycle, Padj < 0.05) versus H3.3(Q5A) (n = 40 mice). Notable circadian genes are highlighted. d, ChEA, BioPlanet and KEGG ontology analyses (P < 0.05) revealed that rhythmic genes disrupted by H3.3(Q5A) are CLOCK targets and enriched for pathways/processes related to circadian entrainment, neurotrophin signalling and synaptic function. e, After intra-TMN transduction with H3.3(Q5A) (n = 11 mice) versus WT H3.3 (n = 10 mice), mice were monitored for locomotor activity beginning 12 h after a shift from light–dark to dark–dark to examine whether disrupting H3Q5his alters normal circadian cycling. Disrupting normal H3Q5his dynamics in the TMN resulted in shifts in diurnal locomotor activity during transitions from inactive to active states and vice versa. The heat map presents locomotor data binned into 4 h intervals for a total of 48 h. Statistical analysis was performed using two-way repeated-measures ANOVA (interaction of time × virus, P = 0.0040), with Šidák’s multiple-comparison test (**P = 0.0079); and a posteriori unpaired Student’s t-tests (#P < 0.05, ##P < 0.01). Data are mean ± s.e.m. Uncropped blots are shown in Supplementary Fig. 1. Source data
Extended Data Fig. 1
Extended Data Fig. 1. TG2 is a bona fide writer of histone H3 monoaminylations.
a, Western blotting validation of TG2 KO in HeLa cells following CRISPR-mediated deletion of TG2. GAPDH served as a loading control. b, 5-PT experiment in WT vs. TG2 KO HeLa –/+ ‘rescue’ with TG2-WT vs. TG2-C277A. c, HeLa cells treated with 5-PT and cultured for 6 h before media was changed to monoamine-free DMEM with or without TG2 inhibitor, ERW1041E. Cells were cultured for an additional 6, 12 or 18 h before being harvested. Histones were extracted, labelled by Cy5 and blotted with indicated antibodies. All WB experiments repeated 3X. Supplementary Fig. 1 = uncropped blots.
Extended Data Fig. 2
Extended Data Fig. 2. Structures/LC-MS analysis of monoaminylated peptides, TG2 purification and identification of a TG2-H3 thioester complex.
ae, The synthetic H3 N-terminal peptides (containing 21 amino acid residues) used as standards and substrates include: (a) H3Q5, (b) H3Q5E, (c) H3Q5ser, (d) H3Q5dop and (e) H3Q5his. Side-chain protecting groups are omitted for clarity. f, Validation of recombinant TG2 purification via western blotting. Lanes from left to right = protein marker, WT TG2 and the TG2-C277A mutant, respectively. g, Identification of a TG2-H3 thioester complex from an in vitro biochemical reaction. All WB experiments repeated 3X. Supplementary Fig. 1 = uncropped blots.
Extended Data Fig. 3
Extended Data Fig. 3. LC-MS/MS validation of H3Q5his on peptides and in cells.
a, Proposed structure of histaminylated glutamine. b, High resolution/high mass accuracy mass spectrum of the triply charged histaminylated H3 tail peptide (ARTKQTARKSTGGKA-NH2; +histamine/+TG2 condition). The difference between measured and expected mass of the amidated peptide was 1.5 ppm. c, Extracted m/z (5 ppm) ion traces of the 2+, 3+ and 4+ amidated H3 tail peptide with (right panels) and without (left panels) histaminylated glutamine. Top, middle and bottom panels show signals measured under –/–, –/+ and +/+ (histamine/TG2) conditions, respectively. Integrated areas under curve are shown next to the peaks. Based on extracted signals, the reaction is close to complete. d, Tandem mass spectrum (35,000 resolution) of the doubly charged glutamine 5 histaminylated H3 tail peptide (+histamine/+TG2 condition). Selected fragment ions (y and b) are labelled. Lowest mass was m/z 100. Vertical lines in red and blue within the peptide sequence are used to show matched peptide fragment ions. e, LC-MS/MS identification of endogenous H3Q5his in HEK293T cells transfected with TG2-WT following histamine treatments. The cellular MS/MS spectra were aligned to that of a synthetic H3Q5his peptide, and y+ ions are annotated. Right: relative intensities of the most abundant y fragment ions from the H3Q5his peptide in 293T cells expressing TG2-WT vs. TG2-C277A. All experiments repeated 2X.
Extended Data Fig. 4
Extended Data Fig. 4. Generation and validation of H3Q5his antibodies.
a, Synthesis of peptide antigens on 2-Cl trityl resin by (i) iterative Fmoc solid-phase peptide synthesis incorporating Fmoc–Glu(OAII)-OH at position 5 and either Fmoc–Lys(Boc)-OH or Fmoc–Lys(Me3)-OH at position 4, (ii) followed by Pd(0) deallylation, (iii) coupling of Trt-protected histamine (iv) acidolytic cleavage from the resin and global deprotection. Side-chain protecting groups are omitted for clarity. b, Peptide dot blot titrations testing the H3Q5his antibody’s specificity against unmodified vs. Q5his vs. Q5ser vs. Q5dop peptides. Direct blue staining was used to control for peptide loading. c, Peptide dot blots testing the H3Q5his antibody’s reactivity −/+ histamine, −/+ TG2. d, Western blot analysis testing the H3Q5his antibody’s reactivity/specificity on NCPs following TG2-mediated transamidation of histamine vs. serotonin vs. dopamine. Total H3 served as a loading control. e, Peptide competition (i.e., no block vs. unmodified H3 block vs. histaminyl blocks) western blotting analysis of lysates from mouse brain indicating the specificity of our H3Q5his antibody. f, Western blotting following TG2-mediated histaminylation on unmodified vs. H3K4me3 mononucleosomes revealed that TG2 can transamidate histamine to H3 in the context of adjacent H3K4me3. g, Peptide dot blot titrations testing the H3K4me3Q5his antibody’s specificity against unmodified vs. Q5his vs. Q5ser vs. Q5dop vs. K4me3 vs. K4me3Q5his vs. K4me3Q5ser vs. K4me3Q5dop peptides. h, Peptide competition (i.e., no block vs. H3K4me3 block vs. H3K4me3Q5his blocks) western blotting analysis of lysates from mouse brain indicating the specificity of our H3K4me3Q5his antibody. i, H3 unmodified vs. H3K4me3 vs. H3K4me3Q5ser vs. H3K4me3Q5his peptide dot blot, followed by western blotting for H3K4me3, demonstrating that the H3K4me3 antibody used in CUT&RUN-seq experiment in brain recognizes H3K4me3 in the context of Q5ser and Q5his. j, Heatmap of H3K4me3Q5his and H3Q5his peak enrichment at genic loci in HeLa cells anchored on H3Q5his peak-enriched genes. k, Representative IGV browser tracks of overlapping H3Q5his vs. H3K4me3Q5his vs. H3K4me3Q5ser enrichment at the Per2 locus in HeLa cells. l, CUT&-RUN-qPCRs (n = 3 biological replicates) for H3K4me3Q5ser and H3K4me3Q5his at H3Q5his-enriched genic loci (GAPDH and ACTB) in WT vs. TG2 KO HeLa cells, demonstrating loss of H3 monoaminylation signal in TG2 KO cells (GAPDH: *p = 0.0362, t4 = 3.101/**p = 0.0033, t4 = 6.297; ACTB: *p = 0.0179, t4 = 3.875/***p = 0.0002, t4 = 13.78). m, Western blotting for H3Q5his across multiple brain regions in mouse reveals relative enrichment for the mark in TMN vs. other non-histaminergic monoaminergic and non-monoaminergic brain structures. Bar graphs presented as mean +/– SEM. Supplementary Fig. 1 = uncropped blots. Source data provided as a Source Data file. Source data
Extended Data Fig. 5
Extended Data Fig. 5. H3Q5his selectively antagonizes WDR5 binding to H3 vs. other H3 tail readers.
af, ITC assessments of (a) CHD1Chromodomain, (b) TAF3PHD, (c) WDR5WD40, (d) BPTFPHD, (e) JMJDATudor and (f) JARID1A binding to H3K4(K4me3)Q5unmod vs. H3K4(K4me3)Q5his vs. H3K4(K4me3)Q5ser peptides. Note that titrations of Q5un/Q5ser/Q5his peptides were performed in the same batch, and the Q5un/Q5ser data have been published in earlier work. The Q5un/Q5ser data are included here as controls for the Q5his data. Supplementary Table 1 = ITC statistics. All experiments repeated 2X.
Extended Data Fig. 6
Extended Data Fig. 6. MLL and SETD1 enzymatic assay quantifications.
a, LC-MS/MS quantification of H3K4 methylation states (H3K4me0 vs. H3K4me1 vs. H3K4me2; H3K4me3 signal was negligible and was thus omitted) on H3 (1-21) unmodified vs. H3Q5ser vs. H3Q5his peptides, titrating the concentration of MLL1 complex in the system. bg, Enzymatic quantifications related to Fig. 2c: LC-MS/MS quantification of H3K4 methylation states (H3K4me0 vs. H3K4me1 vs. H3K4me2 vs. H3K4me3) on H3 (1-21) unmodified vs. H3Q5his peptides for (b) MLL1, (c) MLL2, (d) MLL3, (e) MLL4, (f) SETD1A and (g) SETD1B complexes (n = 3 per peptide/complex). Two-way ANOVA (main effects of interaction: MLL1 – p < 0.0001, F3,16 = 105.5; MLL2 – p = 0.0002, F3,16 = 12.29; MLL3 – p < 0.0001, F3,16 = 86.82; MLL4 – p = 0.0003, F3,16 = 11.26; SETD1A – p < 0.0001, F3,16 = 18.86; SETD1B – p < 0.0001, F3,16 = 41.49), Sidak’s MC tests; significant post hoc comparisons are noted [MLL1: **p = 0.0017 (H3K4me0), ****p < 0.0001 (H3K4me1/2); MLL2: **p = 0.0036 (H3K4me0), **p = 0.0014 (H3K4me1); MLL3: ****p < 0.0001 (H3K4me0 and H3K4me1); MLL4: ***p = 0.0001 (H3K4me1); SETD1A: ***p = 0.0006 (H3K4me0), ***p = 0.0001 (H3K4me1); SETD1B: ****p < 0.0001 (H3K4me0/1)]. h, H3 (1-21) unmodified peptide IPs against recombinant core members of the MLL1 complex (ASH2L, RBBP5, DPY30, MLL1SET and, WDR5) demonstrating that only WDR5 interacts with the unmodified H3 tail in monomeric form. i, H3 (1-21) unmodified vs. H3Q5his vs. H3Q5ser peptide IPs (Streptavidin) against the recombinant MLL1 complex, followed by western blotting for WDR5 (n = 3 per peptide). Streptavidin was used to visualize the peptides post-IP, which were used for normalization. One-way ANOVA (p = 0.0014, F2,6 = 24.03), Tukey’s MC test: significant comparisons are noted (H3 unmodified vs. H3Q5ser, p = 0.0065; H3Q5his vs. H3Q5ser, p = 0.0013). #p = 0.0462 indicates a significant difference via an a posteriori unpaired Student’s t-test (t4 = 2.854). Data presented as mean +/– SEM. A.U., arbitrary units, normalized to respective controls (e.g., H3 unmodified peptide). Supplementary Fig. 1 = uncropped blots. Source data provided as a Source Data file. Source data
Extended Data Fig. 7
Extended Data Fig. 7. H3Q5his and H3K4me3Q5his display diurnal rhythmicity in TMN, but not SCN.
a,c, H3Q5his and H3K4me3Q5his in (a) TMN, but not (c) SCN (H3Q5his only), display a rhythmic pattern of expression across ZT in mice [TMN – H3K4me3Q5his: ZT0/ZT4/ZT8, n = 9 biological replicates per time point; ZT12/ZT16/ZT20, n = 10 biological replicates per time point; TMN – H3Q5his: ZT0/ZT4/ZT12/ZT20, n = 9 biological replicates per time point; ZT8/ZT16, n = 7 biological replicates per time point; SCN – H3Q5his: ZT0/ZT4/ZT8/ZT12/ZT16/ZT20, n = 9 biological replicates per time point). Comparison of fits analysis between third order polynomial, cubic/rhythmic trend (alternative hypothesis) vs. first order polynomial, straight line/linear trend (null hypothesis): TMN H3K4me3Q5his – p = 0.0428, null hypothesis rejected; TMN H3Q5his – p = 0.0135, null hypothesis rejected; SCN H3Q5his – p = 0.8500, null hypothesis not rejected. Data additionally analysed via one-way ANOVA (TMN H3K4me3Q5his: p = 0.0181, F5,51 = 3.029; TMN H3Q5his: p = 0.0066, F5,40 = 3.796; SCN H3Q5his: p = 0.8077, F5,42 = 0.454) with Tukey’s MC tests. Statistical differences between time points are noted [TMN H3K4me3Q5his: *p = 0.0317 (ZT4 vs. ZT8), *p = 0.0133 (ZT4 vs. ZT16); TMN H3Q5his: *p = 0.0108 (ZT4 vs. ZT12), *p = 0.0381 (ZT12 vs. ZT20)]. Data presented as mean +/– SEM. b, TG2 in TMN does not display rhythmic fluctuations in expression across ZT (ZT0/8/12/16, n = 8 biological replicates per time point; ZT4/20, n = 7 biological replicates per time point). Comparison of fits analysis between third order polynomial, cubic/rhythmic trend (alternative hypothesis) vs. first order polynomial, straight line/linear trend (null hypothesis): – p = 0.5718, null hypothesis not rejected. Data additionally analysed via one-way ANOVA (p = 0.2246). Supplementary Fig. 1 = uncropped blots. Source data provided as a Source Data file. Source data
Extended Data Fig. 8
Extended Data Fig. 8. Dynamic epigenomic regulation of H3 monoaminylations vs. H3K4 methylation across ZT.
a, Neither Hdc nor NeuN levels display rhythmic regulation across ZT in TMN (n = 3 biological replicates/time point). Data analysed via one-way ANOVA (Hdc: p = 0.9132, F5,12 = 0.2835; NeuN: p = 0.3223, F5,12 = 1.313). SCN was used as a negative control to monitor the accuracy of dissections for TMN tissues. b,c, Neither (b) histamine nor (c) serotonin levels (total concentrations, not exclusively intracellular) in TMN display rhythmic regulation across the ZT in TMN (n = 3 biological replicates/time point). Data analysed via one-way ANOVA (histamine ELISA: p = 0.9901, F5,12 = 0.1007; serotonin ELISA: p = 0.7543, F5,12 = 0.5236). di, Heatmaps displaying enrichment for (d) H3K4me2, (e) H3K4me3, (f) WDR5 and (g) H3K4me3Q5ser across ZT at genic loci in TMN. Data were normalized to both (h) IgG (the signal of which was not appreciable in TMN) and E. coli spike-in DNA; (i) note that without appropriate normalization to E. coli spike-in DNA, rhythmic patterns of H3K4me3Q5his are largely not observed. See Supplementary Tables 3 and 4 for rhythmic analyses of H3K4me3Q5his and H3K4me3Q5ser. Bar graphs presented as mean +/– SEM. Supplementary Fig. 1 = uncropped blots. Source data provided as a Source Data file. Source data
Extended Data Fig. 9
Extended Data Fig. 9. WDR5 enriches at Clock/Bmal1 motifs and correlates with rhythmic regulation of Clock/Bmal1 target genes.
a, Representative IGV browser tracks of H3K4me3Q5his, H3K4me3Q5ser, WDR5, H3K4me2 and H3K4me3 at Clock/Bmal1 targets (e.g., Per1) vs. non-Clock/Bmal1 target loci (e.g., Clock and Arntl), demonstrating selective enrichment/rhythmicity of WDR5 at Clock/Bmal1 target genes. b, Assessment of gene expression (normalized reads) for genes bound by WDR5 vs. those that are not bound by WDR5 at ZT16 (the height of WDR5’s binding to chromatin across the ZT; Supplementary Table 5), indicating that WDR5 bound genes are more highly expressed vs. genes not bound by WDR5 (Wilcox Rank Sum Test, p < 2.2e-16). c, HOMER motif enrichment analysis of WDR5 bound vs. unbound loci, indicating that WDR5 significantly enriches that Clock/Bmal1 motifs (Benjamini-Hochberg, p < 0.05). d, Heatmap of gene expression (related to Fig. 3a and Supplementary Table 2) comparing WDR5 bound rhythmic genes vs. expression of genes not bound by WDR5 across the ZT, indicating that WDR5 bound genes are largely direct targets of Clock/Bmal1 (e.g., Per1/2, Dbp, Nr1d1/2, etc.), whereas circadian genes that are not bound by WDR5 are not direct targets of Clock/Bmal1 (e.g., Arntl, Npas2, etc.). e, Western blotting analyses of H3K4me3 and H3K27ac (normalized to H3/amido black staining) in TMN tissues virally transduced with AAV-GFP vs. H3.3 WT vs. H3.3Q5A. One-way ANOVAs were performed with no significant effects observed (n = 4 biological replicates/viral treatment; H3K4me3 – p = 0.4306, F2,9 = 0.9266; H3K27ac – p = 0.4646, F2,9 = 0.8357). f, Model: our genomics and biochemical data indicate that: (1) during periods of activity in TMN, WDR5 – likely in complex with MLL/SETD1 – is recruited to Clock/BMAL1 (E-Box) target genes (e.g., Per1/2, Dbp, Nr1d1/2, etc.), which are induced in their expression as a result of Clock/Bmal1 binding, and its binding is further stabilized to H3Q5ser; (2) during transitional periods towards inactivity, WDR5/MLL (SETD1) becomes destabilized at Clock/BMAL1 target genes owing, in part, to loss of H3Q5ser and stabilization of H3Q5his, the latter of which is antagonistic to WDR5 binding and H3K4 HMT activities; and (3) during periods of inactivity, H3Q5his is further reduced in its enrichment at Clock/Bmal1 targets, thereby allowing for spreading of H3K4 methylation, and the eventual re-recruitment of WDR5/MLL (SETD1) during transitions back into phases of activity. Supplementary Fig. 1 = uncropped blots. Source data provided as a Source Data file. Source data

Similar articles

Cited by

References

    1. Cervantes, M. & Sassone-Corsi, P. Modification of histone proteins by serotonin in the nucleus. Nature567, 464–465 (2019). - PubMed
    1. Girault, J. A. Epigenetic tinkering with neurotransmitters. Science368, 134–135 (2020). - PubMed
    1. Al-Kachak, A. & Maze, I. Post-translational modifications of histone proteins by monoamine neurotransmitters. Curr. Opin. Chem. Biol.74, 102302 (2023). - PMC - PubMed
    1. Farrelly, L. A. et al. Histone serotonylation is a permissive modification that enhances TFIID binding to H3K4me3. Nature567, 535–539 (2019). - PMC - PubMed
    1. Zhao, S. et al. Histone H3Q5 serotonylation stabilizes H3K4 methylation and potentiates its readout. Proc. Natl Acad. Sci. USA118, e2016742118 (2021). - PMC - PubMed