. 2025 Feb;638(8050):510-518.
doi: 10.1038/s41586-024-08377-x. Epub 2025 Jan 8.

Complex rearrangements fuel ER+ and HER2+ breast tumours

Affiliations

Complex rearrangements fuel ER+ and HER2+ breast tumours

Kathleen E Houlahan et al. Nature. 2025 Feb.

Abstract

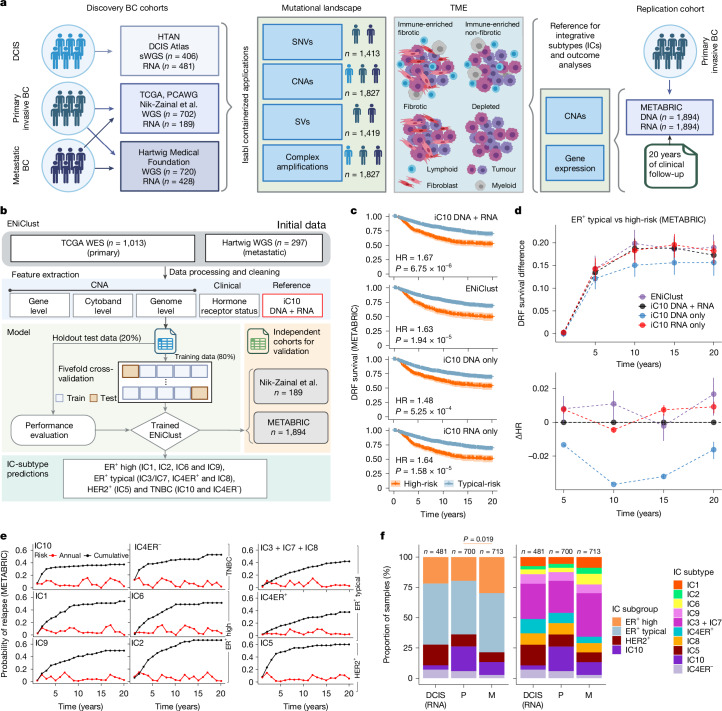
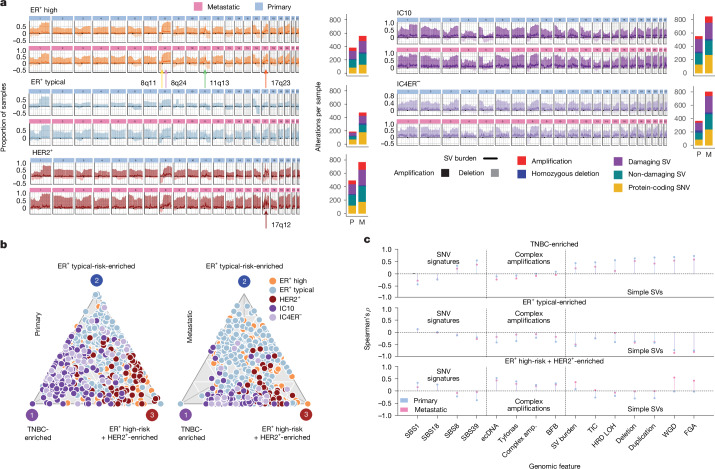
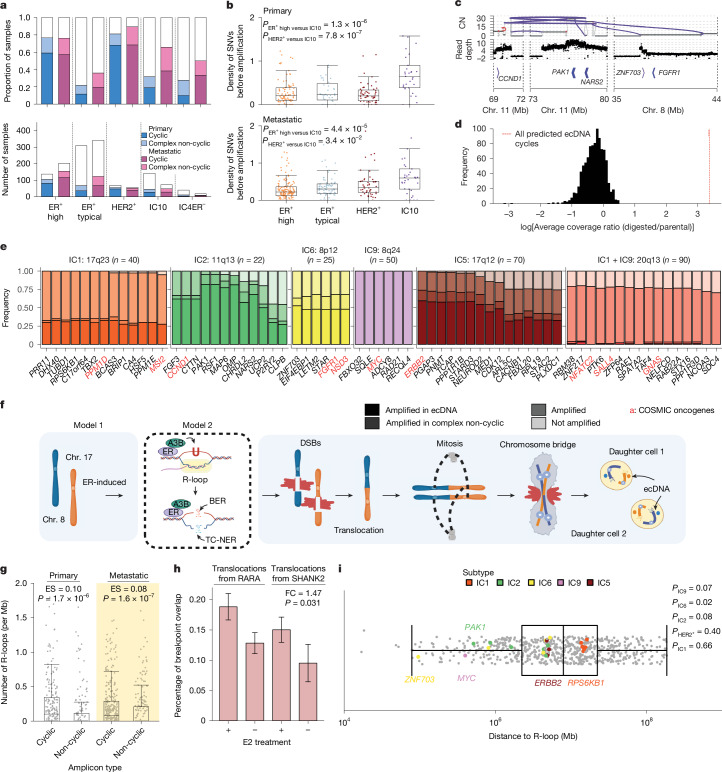
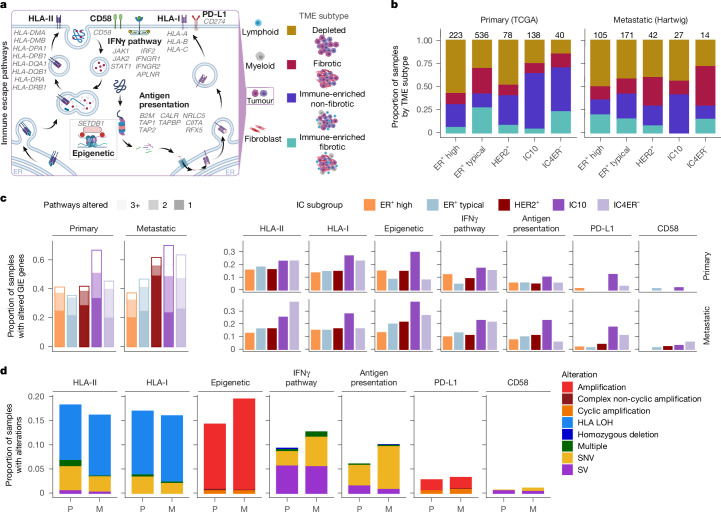
Breast cancer is a highly heterogeneous disease whose prognosis and treatment as defined by the expression of three receptors-oestrogen receptor (ER), progesterone receptor and human epidermal growth factor receptor 2 (HER2; encoded by ERBB2)-is insufficient to capture the full spectrum of clinical outcomes and therapeutic vulnerabilities. Previously, we demonstrated that transcriptional and genomic profiles define eleven integrative subtypes with distinct clinical outcomes, including four ER+ subtypes with increased risk of relapse decades after diagnosis1,2. Here, to determine whether these subtypes reflect distinct evolutionary histories, interactions with the immune system and pathway dependencies, we established a meta-cohort of 1,828 breast tumours spanning pre-invasive, primary invasive and metastatic disease with whole-genome and transcriptome sequencing. We demonstrate that breast tumours fall along a continuum constrained by three genomic archetypes. The ER+ high-risk integrative subgroup is characterized by complex focal amplifications, similar to HER2+ tumours, including cyclic extrachromosomal DNA amplifications induced by ER through R-loop formation and APOBEC3B-editing, which arise in pre-invasive lesions. By contrast, triple-negative tumours exhibit genome-wide instability and tandem duplications and are enriched for homologous repair deficiency-like signatures, whereas ER+ typical-risk tumours are largely genomically stable. These genomic archetypes, which replicate in an independent cohort of 2,659 primary tumours, are established early during tumorigenesis, sculpt the tumour microenvironment and are conserved in metastatic disease. These complex structural alterations contribute to replication stress and immune evasion, and persist throughout tumour evolution, unveiling potential vulnerabilities.


Conflict of interest statement

Competing interests: Unrelated to this work, the following interests are declared: S.P. has equity in Inocras; J.L.C.-J. holds grants from Effector Therapeutics, Novartis and QED Therapeutics; C.C. has advised Bristol Myers Squibb, DeepCell, Genentech, NanoString, Pfizer and 3T Biosciences and has equity in 3T Biosciences, DeepCell and Illumina. All other authors declare no competing interests.

Figures

Fig. 1
Fig. 1. ENiClust identifies the IC subtypes.
a, Schematic of the study design. BC, breast cancer; HTAN, Human Tumor Atlas Network; sWGS, shallow WGS; TCGA, The Cancer Genome Atlas; PCAWG, Pan-Cancer Analysis of Whole Genomes. b, Schematic of the ENiClust IC classifier. WES, whole-exome sequencing. c, Kaplan–Meier curves of distant relapse-free (DRF) survival of the ER+ typical-risk and ER+ high-risk classes detected by the four IC subtype classifiers. Shaded area represents 95% confidence interval. HR, hazard ratio. d, Difference in distant relapse-free survival probability (top) or delta in Cox proportional hazard ratio (bottom) between ER+ typical-risk and ER+ high-risk classes detected by the four different IC classifiers. Error bars represent the difference in 95% confidence intervals between ER+ typical-risk and ER+ high-risk in each model. e, Differential pattern of relapse across the ICs, illustrated by the cumulative (black) and annual (red) risk of relapse over time. f, IC subgroup (left) and subtype (right) distributions across disease stages. P, primary; M, metastatic. The schematics in a,b were created with BioRender.com.
Fig. 2
Fig. 2. SVs define three distinct genomic archetypes.
a, IC group-level CNA profile (shaded area; dark denotes amplification, light denotes deletion) with SV burden (line) as overlay and total alteration burden in primary and metastatic samples. b, Pareto front projection on ternary plot of CNA and SV signature profiles from primary (left) and metastatic (right) tumours independently, resulting in three genomic archetypes. Each plotted circle represents a tumour. c, Lollipop plots illustrating the correlation between mutational features and the distance to each archetype. amp., amplification; BFB, breakage–fusion–bridge; TIC, templated insertion chain; LOH, loss of heterozygosity; WGD, whole-genome doubling; FGA, fraction of genome altered.
Fig. 3
Fig. 3. Cyclic amplifications are early mutational processes in ER+ high-risk and HER2+ breast tumours.
a, Proportion (top) and number (bottom) of samples with at least one cyclic or complex non-cyclic amplification in primary or metastatic tumours. b, The density of SNVs occurring before amplification in primary (top) and metastatic (bottom) tumours. Boxplot represents median, 0.25 and 0.75 quantiles with whiskers at 1.5× the interquartile range. c, Illustration showing copy number (CN) and SVs linking together disjoint segments in ecDNA (top), ratio of read depth in the tumor versus normal sample (middle) and location of oncogenes in ecDNA (bottom) in a representative primary IC2 tumour. d, Ratio of sequencing coverage in digested versus parental UCD65 (IC2) cell line in the predicted ecDNA region (dashed red line) compared to 1,000 null regions. e, Proportion of tumours within each IC subtype that harbour cyclic, complex non-cyclic or linear amplification in IC-specific oncogenes. f, Schematic for the genesis of cyclic amplifications. TC-NER, transcription-coupled nucleotide-excision repair. g, The density of ER-induced R-loops in cyclic versus complex non-cyclic amplifications. h, The percentage of breakpoints that overlap ER-induced R-loops with (+) or without (−) E2 treatment. Error bars represent the standard deviation across three replicates. i, The distance of each oncogene to the nearest ER-induced R-loop. The schematic in f was created with BioRender.com.
Fig. 4
Fig. 4. Complex alterations contribute to IC-specific immune escape.
a, Schematic of TME subtypes and select immune escape pathways. b, Comparison of TME subtypes by IC subgroup. The number of tumours in each subgroup is indicated on the top of each bar. c, Left: proportion of primary and metastatic samples in each IC subgroup with GIE. Right: proportion of samples with alterations in each pathway stratified by IC subgroup and stage of progression. d, Proportion of alteration types in primary and metastatic samples for each of the immune escape pathways. The schematic in a was adapted from BioRender.com (credit: A. Iwasaki & J.-H. Lee; https://app.biorender.com/biorender-templates/figures/all/t-5f4fb77c3b02b700b74df8c6-mhc-class-i-and-ii-pathways).
Fig. 5
Fig. 5. Genomic and microenvironmental evolution of breast cancer subgroups.
a, Schematic summary of the genomic and microenvironmental characteristics of the three dominant genomic archetypes in breast cancer. b, Temporal changes in genomic stability, ER signalling and immune enrichment from pre-invasive, primary invasive to metastatic disease across subgroups. The schematics in a,b were created with BioRender.com.
Extended Data Fig. 1
Extended Data Fig. 1. IC subgroup distribution varies across stages of progression, ancestry and histology.
a) IC subgroup (left) and subtype (right) across stages of progression in ER+ samples. b) Inferred ancestry (primary samples, left or metastatic samples, right) across IC subgroups. c) IC subgroup (left) and subtype (right) across inferred ancestry in primary (top) and metastatic (bottom) stages. d) IC subgroup (left) and subtype (right) across inferred ancestry in primary (top) and metastatic (bottom) stages in ER+ samples. e) IC subtypes (left) and subgroups (right) across paired primary and metastatic samples with WES data. f) Graphical network representing primary/primary or primary/metastatic pairs; dots corresponding to a tumour biopsy colored by IC subgroup, the edge between two dots indicates whether the classification is stable (black) or changes (red) through metastasis. The surrounding color represents the PAM50 subtype (gray indicates missing data). g) IC subtype or subgroup consistency with PAM50 in pre-invasive DCIS (left), primary (middle), and metastatic (right) samples. h) ER early transcriptional signature according to subgroup. i) ER early signaling transcriptional signature in primary and metastatic tumours. j) Schematic overview of IC-specific amplification peaks and associated genes. ES, effect size. DCIS, ductal carcinoma in situ; LumA, luminal A; LumB, luminal B. The schematic in j was created with BioRender.com.
Extended Data Fig. 2
Extended Data Fig. 2. Genomic features of primary IC subgroups.
a) IC group-level copy number profile with SV burden overlay in DCIS. b) Fraction of genome altered by subgroup across pre-invasive, primary invasive and metastatic tumours. Boxplot represents median, 0.25 and 0.75 quantiles with whiskers at 1.5x interquartile range. c) Alteration burden in metastatic tumours split based on treatment prior to biopsy. The sample size is indicated at the top of each bar. d) Fraction genome altered, fraction LOH, and number of damaging SVs in IC10 and IC4ER- subtypes. e) Proportion of IC10 and IC4ER- tumours with alterations in genes involved in three key pathways: cell cycle, DNA damage response (DDR), and ubiquitination. f) Alteration burden distribution in metastatic samples across metastatic sites. The sample size for each group is at the top of each bar. g-h) Activity of each of the six rearrangement signatures across the IC subgroups (g) or the ER+ High-risk subtypes (h) in primary tumours. i) Copy number and SV profiles of primary (left) and metastatic (right) samples, each representative of either a TNBC -enriched, ER+ Typical -enriched, ER+ High/HER2 + -enriched, or mixed profile in the center of the Pareto front. j) Proportion that each complex SV event contributes to the total complex SV burden stratified by subgroup. DEL, deletion; LOH, loss-of-heterozygosity; FDR, false discovery rate; BFB, bridge-fusion breakage; CPXDM, complex double minute; DM, double minute; INVDUP, inverted-duplication; TIC, templated insertion chain; TRA, translocation.
Extended Data Fig. 3
Extended Data Fig. 3. Genomic features are conserved though elevated through metastasis.
a) Pareto front projection with tumours colored by presence of co-amplification of two or more amplifications in the following cytobands: 17q23 (IC1), 11q13 (IC2), 17q12 (IC5/HER2 + ), 8p12 (IC6) or 8q24 (IC9). b) Pareto front projection with tumours colored by HRD and ER status. c) Barplot shows the proportion and number of samples predicted to be BRCA1-like or BRCA2-like across the subgroups. d) Proportion of various SV events in BRCA1-like, BRCA2-like or non-HRD tumours across the subgroups. e) Replication of the Pareto front projection using the GEL (primary) cohort. Each dot represents the architecture profile of each tumour colored by IC subgroup. f) Activity of six SV signatures across the IC subgroups in metastatic tumours. g) Distribution of primary and metastatic tumours on Pareto front. h) Comparison of SV signatures in primary and metastatic tumours across the IC subgroups. Barplot shows the log fold change of each rearrangement signature between primary and metastatic tumors across the IC subgroups. i) Transition vector corresponding to the difference in position on the Pareto fronts from (g) between the centroid of primary samples and the centroid of metastatic samples in each IC group. j) Replication of the Pareto front projection using the METABRIC (primary) cohort. Each dot represents the architecture profile of each tumour colored by IC subgroup. k) Forest plot shows the association between the proportion of archetypes and distant relapse free (DRF) survival, correcting for ER and HER2. Dots correspond to estimated hazard ratios and segments to 95% confidence intervals. l) Association between recurrence in the ER+ Typical-risk samples and the distance to each archetype (spanning from 0 to 1, linear regression, top), transcriptomic proliferative and HRD LOH scores (linear regression, bottom) and histological type (IDC or ILC, fisher’s exact test, bottom) in the METABRIC dataset. Significance: P ≤ 0.05 (*), P ≤ 0.01 (**), and P ≤ 0.001 (***). m) Differential pattern of relapse across ER + IC subgroups and by histology (IDC: invasive ductal carcinoma and ILC: invasive lobular carcinoma), illustrated by the cumulative (black) and annual (red) risk of relapse. n) ER+ Typical IDC and ILC distribution on the Primary-Discovery Pareto front. o) ER+ Typical IDC and ILC distribution on the METABRIC Pareto front. SV, structural variant; WGD, whole-genome doubling; HRD, homologous repair deficiency; LOH, loss-of-heterozygosity; IDC, invasive ductal carcinoma; ILC, invasive lobular carcinoma.
Extended Data Fig. 4
Extended Data Fig. 4. Cyclic amplifications preferentially amplify IC-specific oncogenes.
a) Proportion or number of samples with at least one cyclic or complex non-cyclic amplification in primary GEL tumours. b) Proportion or number of samples with at least one cyclic or complex non-cyclic amplification in HER2+ primary tumors stratified by ER positivity. c) Proportion or number of primary samples with at least one cyclic amplification according to JaBbA. d) Proportion of samples where AmpliconArchitect called a cyclic amplification but JaBbA called an alternative type of alteration. Colors indicate which alteration JaBbA called. e) Proportion of HER2+ primary tumours that harbor cyclic or linear amplification in ER+ High-risk-specific oncogenes (left), and the SV types (right). f) Proportion or number of samples with at least one cyclic or complex non-cyclic amplification in DCIS lesions. Left panel: DCIS cohort stratified by subgroup, right panel: DCIS cohort and additional samples from GEL stratified by sequencing method. g) Proportion of cyclic amplifications, stratified by subgroup, that amplify IC-specific or alternative oncogenes in primary tumours, both the discovery and replication (GEL) cohorts. The number of amplifications in each category are included on each bar. h) Number ecDNA involving more than one IC-specific oncogene. i) Number of oncogenes per megabase involved in ecDNA in each subgroup. Boxplot represents median, 0.25 and 0.75 quantiles with whiskers at 1.5x interquartile range. j) Ratio of oncogenes amplified on ecDNA compared vs. oncogenes in the IC-specific cytoband per megabase. k) Proportion of ER+ Typical-risk ecDNA that incorporate each oncogene. l) Proportion of each archetype in ER+ High-risk, ER+ Typical and ER+ Typical containing ecDNA tumours.
Extended Data Fig. 5
Extended Data Fig. 5. Cyclic amplifications are maintained in metastatic tumours.
a-b) Number of recurrent oncogenes per Mbp for each subgroup in primary (a) and metastatic (b) tumors. c-d) Proportion of cyclic amplifications, stratified by subgroup, that amplify IC-specific or alternative oncogenes in metastatic (c) and DCIS (d) lesions. The number of amplifications in each category is included on each bar. e) Proportion of metastatic tumours within each IC subtype that harbor cyclic, complex non-cyclic or linear amplification in the IC-specific oncogenes. The number of tumors within each subtype are indicated at the top of each subpanel. f) Two representative examples of ER+ High-risk DCIS lesions harboring ecDNA containing at 8p11 (IC6). AMP, amplification.
Extended Data Fig. 6
Extended Data Fig. 6. Elevated replication stress in TNBC, ER+ High-risk and HER2+ tumours.
a-b) Replication stress signature stratified by IC subgroup (left) or by histology within ER+ Typical-risk subgroup IDC and ILC (right) in the TCGA (a) and METABRIC (b) datasets. FDR adjusted p-values are reported. c-d) Replication stress signature stratified by IC subtypes in TCGA (c) and METABRIC (d) datasets. e) Pareto projection of METABRIC tumors, colored by replication stress. f) Replication stress signature in HER2+ tumors; IC1, IC6, and IC9 subtypes of ER+ High-risk; and TNBC IC10 stratified by presence of ecDNA. ER+ High IC2 was excluded due to lack of sample size (n = 2 for ecDNA+ IC2). g-h) cGAS/STING signature stratified by IC subgroup (left) or by histology within ER+ Typical-risk subgroup IDC and ILC (right) in the TCGA (g) and METABRIC (h) datasets. FDR adjusted p-values are reported. In a-d, effect sizes (ES) and FDR-adjusted p-values from Mann-Whitney Rank Sum test are shown. In f, ES and p-values from linear regression correcting for cohort are shown. Additionally, the amplicon copy number was corrected for amplicon-driven HER2+ and ER+ Typical tumors.
Extended Data Fig. 7
Extended Data Fig. 7. Model for ER-induced R-loops in ecDNA genesis.
a) Simplified schematic illustrating model. Blue letters correspond to figure panels in Extended Data Fig. 7. Created with BioRender.com. b) Number of translocations in cyclic vs. non-cyclic amplifications across subgroups. Boxplot represents median, 0.25 and 0.75 quantiles with whiskers at 1.5x interquartile range. c) ESR1 mRNA abundance in cyclic amplification-positive vs. -negative (top) and non-cyclic amplification-positive vs. -negative (bottom) primary from Nik-Zainal et al., TCGA or metastatic tumors stratified by the IC subgroups, considering ER+ High-risk and HER2+ subgroups. Odds ratio from logistic regression correcting for tumor purity and error bars represent 95% confidence intervals. d) Density of APOBEC3B and ER ChIP-Seq peaks within cyclic and complex non-cyclic amplifications in primary tumours. e) ER early signaling transcriptional signature in DCIS and primary ER+ Typical vs. ER+ High-risk tumors. f-g) Density of ER-induced R-loops in cyclic and complex non-cyclic amplifications stratified by IC subgroups in primary (f) and metastatic (g) tumours. h) Density of all R-loops in cyclic vs. non-cyclic amplifications in primary and metastatic tumors. i) Difference in number of R-loops between A3B knockout (KO) wildtype (WT) MCF10A cell lines overlapping cyclic or non-cyclic amplifications at baseline or after A3B activation (PMA treatment). j-k) Median distance between a translocation and its closest ER-induced R-loop considering translocations within or outside cyclic amplifications in primary (j) and metastatic (k) tumors. l) Percent of breakpoints that overlap any R-loop with (+) or without (−) E2 treatment. Error bars represent the standard deviation across three replicates. m) Proportion of samples with or without ecDNA stratified by inferred APOBEC3B germline copy number. The total number of samples is included at the top of each bar. In b and j-l fold change (FC) and p-values or false discovery rates (FDR) are from Mann-Whitney Rank Sum test. In d-i, effect sizes (ES) are the difference in medians and p-values are from Mann-Whitney Rank Sum test. BER, base-excision repair; TC-NER, transcription-coupled nucleotide excision repair; E2, estrogen.
Extended Data Fig. 8
Extended Data Fig. 8. IC subgroups harbor distinct TMEs.
a) Schematic illustrating additional transcriptomic profiles and overlap with genomic profiles induced in Fig. 1a. Created with BioRender.com. b) Mean proportion of different cell types from IMC data by TME subtypes. The Wilcoxon test significance was reported above each comparison as follow: ns: not significant, P ≤ 0.05 (*), P ≤ 0.01 (**), P ≤ 0.001 (***), and P ≤ 0.0001 (****). c) Proportion of TME subtypes in primary and metastatic samples for the ER+ High-risk ICs and IC5 (HER2 + ) by ER status. d) Proportion of TME subtypes for primary samples (METABRIC) in ER+ Typical invasive IDC and ER+ Typical ILC. e) Mean proportion of fibroblasts and T cells in TNBC samples with IMC proteomic data obtained from bootstrapping (n = 1000). f) Proportion of TME subtypes for primary and metastatic samples stratified by ER status. g) Proportion of TME subtypes for primary samples and liver metastases by groups. IMC, imaging mass cytometry; SMA, smooth muscle actin.
Extended Data Fig. 9
Extended Data Fig. 9. Genetic mechanisms of immune escape in IC subgroups.
a) Proportion of primary and metastatic samples in each ER+ High-risk subtype with genetic immune escape (GIE) alterations, where values correspond to the number of pathways altered (left). Proportion of samples with alterations in each pathway stratified by IC subtype and disease stage (right). b) Proportion of primary ER+ High-risk samples with co-amplification of IDO1 with FGFR1 or ZNF703 by IC subgroup. c) Proportion of IC6 tumours with immune enriched (IE or IE/F) or immune depleted (D or F) TME subtypes stratified by the co-amplification of IDO1 with FGFR1 or ZNF703 in METABRIC and TCGA. d) Proportion of ER+ Typical IDC and ILC with GIE (left). Odds ratio and p-value from Fisher’s exact test. Proportion of pathways altered in IDC and ILC with GIE (right). e) Number of alteration in immune escape pathways for primary and metastatic samples, normalized by number of samples with alterations. f) Odds ratio for the frequency of GIE pathway alterations, comparing metastatic to primary samples. Background shading indicates FDR adjusted p-values (Fisher’s exact test). The color of the dot represents the direction and magnitude of the odds ratio while the dot size indicates the number of samples with a GIE in each pathway (y-axis). LOH, loss-of-heterozygosity.

References

    1. Cronin, K. A. et al. Annual report to the nation on the status of cancer, part 1: national cancer statistics. Cancer128, 4251–4284 (2022). - PMC - PubMed
    1. Gradishar, W. J. et al. NCCN Guidelines® Insights: breast cancer, version 4.2023. J. Natl Compr. Cancer Netw.21, 594–608 (2023). - PubMed
    1. Sparano, J. A. et al. Adjuvant chemotherapy guided by a 21-gene expression assay in breast cancer. N. Engl. J. Med.379, 111–121 (2018). - PMC - PubMed
    1. Curtis, C. et al. The genomic and transcriptomic architecture of 2,000 breast tumours reveals novel subgroups. Nature486, 346–352 (2012). - PMC - PubMed
    1. Rueda, O. M. et al. Dynamics of breast-cancer relapse reveal late-recurring ER-positive genomic subgroups. Nature567, 399–404 (2019). - PMC - PubMed

MeSH terms

LinkOut - more resources