. 2025 Jan;637(8047):965-973.
doi: 10.1038/s41586-024-08391-z. Epub 2025 Jan 8.

A foundation model of transcription across human cell types

Affiliations

A foundation model of transcription across human cell types

Xi Fu et al. Nature. 2025 Jan.

Abstract

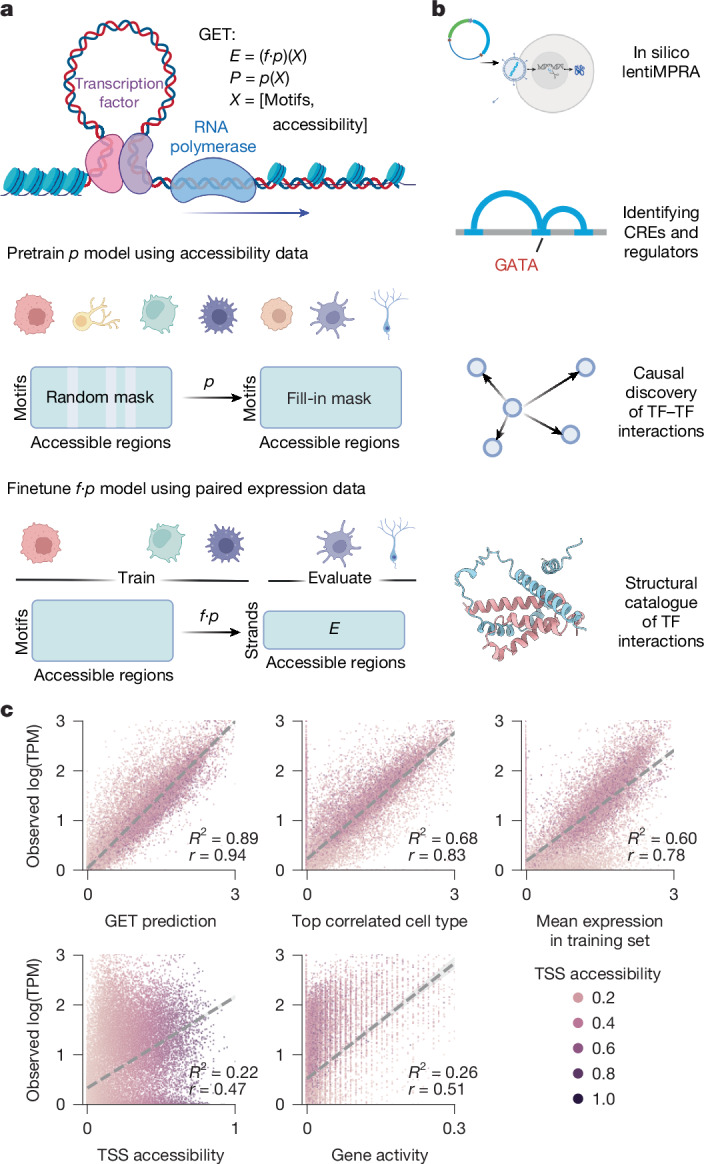
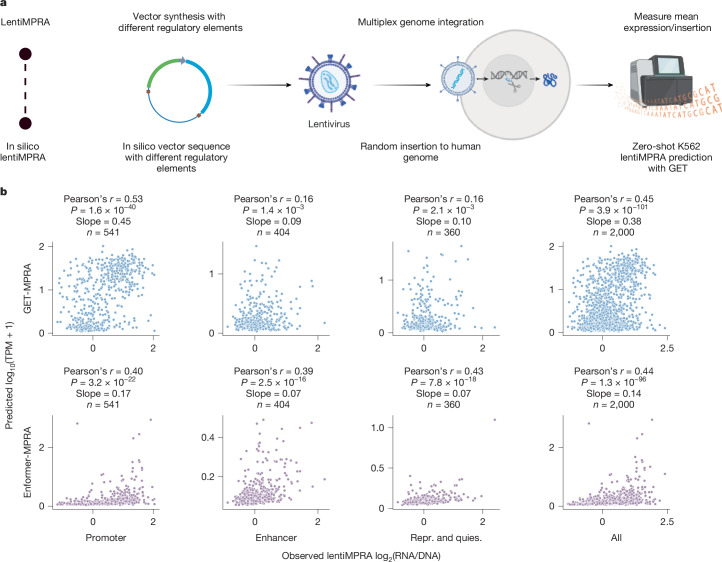
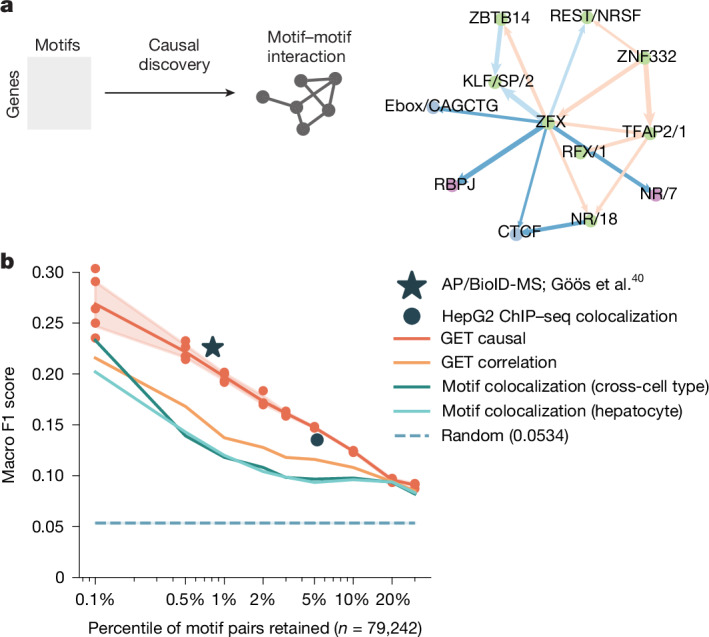
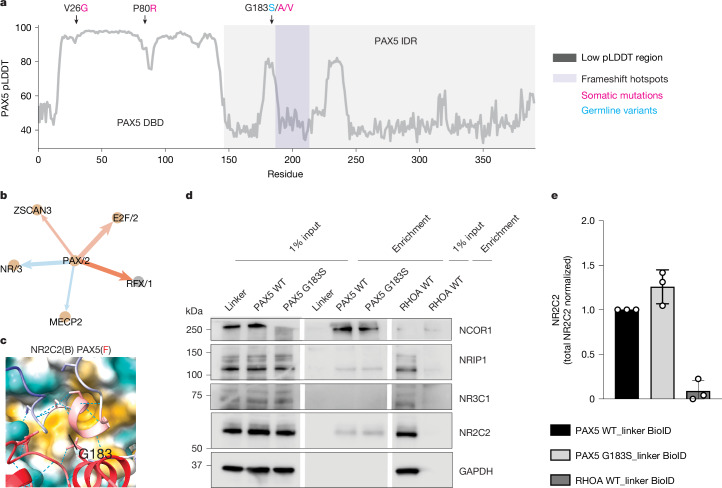
Transcriptional regulation, which involves a complex interplay between regulatory sequences and proteins, directs all biological processes. Computational models of transcription lack generalizability to accurately extrapolate to unseen cell types and conditions. Here we introduce GET (general expression transformer), an interpretable foundation model designed to uncover regulatory grammars across 213 human fetal and adult cell types1,2. Relying exclusively on chromatin accessibility data and sequence information, GET achieves experimental-level accuracy in predicting gene expression even in previously unseen cell types3. GET also shows remarkable adaptability across new sequencing platforms and assays, enabling regulatory inference across a broad range of cell types and conditions, and uncovers universal and cell-type-specific transcription factor interaction networks. We evaluated its performance in prediction of regulatory activity, inference of regulatory elements and regulators, and identification of physical interactions between transcription factors and found that it outperforms current models4 in predicting lentivirus-based massively parallel reporter assay readout5,6. In fetal erythroblasts7, we identified distal (greater than 1 Mbp) regulatory regions that were missed by previous models, and, in B cells, we identified a lymphocyte-specific transcription factor-transcription factor interaction that explains the functional significance of a leukaemia risk predisposing germline mutation8-10. In sum, we provide a generalizable and accurate model for transcription together with catalogues of gene regulation and transcription factor interactions, all with cell type specificity.


Conflict of interest statement

Competing interests: A provisional patent with application numbers 63/486,855 and PCT/US2024/017064 has been filed by Columbia University on the use of the method developed in this work to identify gene regulatory elements and alter gene regulation and expression; X.F. and R.R. are inventors on this patent. R.R. is a founder of Genotwin and a member of the SAB of Diatech Pharmacogenomics and Flahy. None of these activities are related to the work described in this manuscript.

Figures

Fig. 1
Fig. 1. The GET model and its applications.
a, Schematic illustration of GET. The input of GET is a peak (accessible region) × TF (motif) matrix derived from a human single-cell (sc)ATAC-seq atlas, summarizing regulatory sequence information across a genomic locus of more than 2 Mbp. Through self-supervised random masked pretraining of the input data across more than 200 cell types, GET learns transcriptional regulatory syntax (p). GET is fine-tuned on paired scATAC-seq and RNA-seq data and learns to transform the regulatory syntax to gene expression, even in leave-out cell types (fp). b, Schematic illustration of downstream applications of GET. CRE, cis-regulatory element. c, Benchmark of GET prediction performance on an unseen cell type (fetal astrocytes). Each point represents a gene. Colour represents normalized chromatin accessibility in the TSS. Gene activity is a score widely used in modern scATAC-seq analysis pipelines. Top correlated cell type is the training cell type whose observed gene expression has the strongest correlation with fetal astrocyte (in this case, fetal inhibitory neurons). Mean cell type is the mean observed gene expression across training cell types. Dashed line represents linear fits. Prediction is made for all accessible TSS in astrocytes and averaged to gene level. Schematics in a and b were created using BioRender (https://biorender.com).
Fig. 2
Fig. 2. In silico lentiMPRA with GET fine-tuned on K562.
a, Schematic workflow of lentiMPRA experiments and in silico lentiMPRA using GET model fine-tuned on K562 multiome data. b, Benchmarking of GET lentiMPRA prediction against Enformer on a random subset of elements. The x axes show observed lentiMPRA readout (log2(RNA/DNA)); y axes show predicted expression (log10 transcripts per million (TPM)). repr., repressive; quies., quiescent. Schematic in a was created using BioRender (https://biorender.com).
Fig. 3
Fig. 3. GET identifies long-range cis-regulatory elements.
a, Case study identifying cis-regulatory elements and regulators controlling a phenotype, fetal haemoglobin (HbF) level. b, GET identifies the GATA motif in an erythroid-specific enhancer that upregulates BCL11A, an HbF repressor. Top, guide RNA (gRNA) enrichment scores (HbFBase); higher scores indicate enrichment in a greater number of HbF cells, implying that these edits disturb a cis-regulatory element or regulator binding site that can upregulate BCL11A. Middle, scATAC-seq signal and peaks from fetal erythroblasts. Bottom, motif contribution score for BCL11A expression in the erythroid-specific enhancer. c, Genome tracks displaying inferred cis-regulatory elements for BCL11A and NFIX loci. Plots for HBG2 and MYB loci can be found in Supplementary Fig. 4c. From top to bottom, the tracks represent: HbFBase, showing the gRNA enrichment score from base-editing experiments; GET, showing the inferred region importance score; Enformer, showing the inferred region importance score; HyenaDNA, showing an in silico mutagenesis (ISM) result using the pretrained HyenaDNA language model; ABC Powerlaw, showing the activity-by-contact prediction using fetal erythroblast ATAC and K562 Hi-C powerlaw; ATAC-seq data from HUDEP-2, an erythroblast cell line; ATAC-seq data from fetal erythroblast cells, used in the training of GET; and HiChIP–seq data from HUDEP-2, demonstrating chromatin interactions. d, Benchmarking results comparing GET to other methods for predicting enhancer–promoter pairs, including analysis of distal (greater than 100 kb) interactions. Top, erythroblast fetal haemoglobin-regulating enhancer prediction. Bottom, K562 CRISPRi enhancer target prediction; the area under the precision–recall curve (AUPRC) is shown. Ablation of different GET prediction components (Jacobian, DNase, Powerlaw; Methods: ‘Enhancer–gene pair prediction’) is also shown in the plot. Data are presented as mean values with 95% confidence intervals across random bootstrapping (N = 1,000, 80% of the pairs). GWAS, genome-wide association study. Schematic in a was created using BioRender (https://biorender.com).
Fig. 4
Fig. 4. GET informs TF–TF interaction discovery.
a, Causal discovery using the GET motif contribution matrix identifies motif–motif interactions. Edge weights represent interaction effect size. Edge directions mark casual directions. Blue and red edge colours mark negative or positive estimated causal effect size by LiNGAM, respectively. Node colour indicates community detected on the full causal graph. In-community edges are marked by reduced saturation. b, Benchmark of concordance of inferred TF–TF interactions using different methods with physical interactions from the STRING database. The x axis shows different cutoffs for retained interactions by percentile of 79,242 total possible interactions; y axis shows the ratio of selected interactions that are also marked as interactions in STRING. The dashed line indicates the random selection background; the orange line indicates the results of selection using motif–motif contribution score correlation; the red line marks the mean of causal discovery results across five bootstraps; the shaded area indicates the standard error; and green and aqua lines show results from motif colocalization, computed as correlations between motif binding vectors in accessible regions across all cell types (green) or in hepatocytes (aqua). The star indicated a result from a recent mass-spectrometry-based TF–TF interaction atlas (0.23 Macro F1 at 1.09% recall); and the round dot indicates the performance of a colocalization score computed from 677 HepG2 TF ChIP–seq (0.13 Macro F1 at 5.24% recall, Methods: ‘Causal discovery of regulator interaction’).
Fig. 5
Fig. 5. GET identifies a cell-type-specific TF–TF interaction affected by a cancer-associated germline variant.
a, pLDDT plot for PAX5, showing three mutational hotspots (V26G, P80R and G183S/A/V) and a frameshift hotspot. DBD, DNA-binding domain. b, B cell-specific motif interactions of PAX/2. PAX5 is the most highly expressed TF with a PAX/2 motif. The colour scheme follows that of Fig. 4a. c, AlphaFold3-predicted multimer structure of PAX5 IDR and NR2C2 NR domain showing contacts around G183 (B, back; f, front). The blue–yellow surface at the back represents hydrophilicity–hydrophobicity, respectively. Blue–red strands in the front show low–high prediction confidence. d, Detection of NCOR1, NRIP1, NR3C1 and NR2C2 PAX5-interacting proteins in streptavidin-enriched eluates (enrichment) from PAX5-WT, PAX5 G183S and RHOA WT-BioID-expressing B-ALL REH cell lines and in total protein lysates (1% input) using proximity labelling assays. Three independent experiments with similar results. A representative experiment is shown. GAPDH was used as a loading control in the same gel. Raw gel images are in Supplementary Fig. 2. e, Quantification of PAX5–NR2C2 interaction in the streptavidin immunoprecipitation shown in d. Data are presented as mean values with s.d. as well as total NR2C2-normalized values.
Extended Data Fig. 1
Extended Data Fig. 1. Architecture of GET.
The GET model uses chromatin accessibility data to predict gene expression. Input data consists of DNA sequences from ATAC-seq peaks, represented as (B, R, L*, 4), where B is batch size, R is number of regions, L* is variable sequence length, and 4 represents the four DNA bases. Motif mapping performed offline to the model converts sequences to a motif matrix (B, R, M), where M is the number of motifs. The quantitative ATAC signal can optionally be included in M. The RegionEmb layer projects the motif matrix to a latent space (B, R, D), where D is the latent dimension. This embedding is then processed by 12 Transformer encoder layers. The model output is generated by a projection layer followed by a SoftPlus activation, producing a (B, R, O) tensor, where O is the output channel. Four output heads are illustrated: MaskHead: Predicts masked motif matrix elements during pretraining (O = (R/2, M)). ExpHead: Predicts stranded gene expression as log1p(TPM) (O = 2). ATACHead: Predicts peak accessibility as log1p(CPM) (O = 1). CAGEHead: Predicts peak CAGE signal as log1p(CPM) (O = 1). The model architecture enables flexible processing of regulatory genomic data, capturing complex interactions between regulatory elements and transcription factors to predict various genomic features and gene expression levels.
Extended Data Fig. 2
Extended Data Fig. 2. GET model performance and benchmarking.
a. Pearson correlation of gene expression between biological replicates and across different culture systems for human astrocytes. b. Scatterplots showing predicted vs. observed log fold change (log FC) in gene expression between different cell type pairs. Top row compares erythroblast subtypes and hepatocytes. Bottom row compares enteric neurons to erythroblasts and astrocytes. Pearson correlations and R2 values are provided for each comparison. c. Comparison of Pearson correlation between predicted and observed gene expression in left-out cell types for different models and baselines. Quantitative ATAC: GET model with quantitative ATAC and motif input. Training cell type mean: Mean expression value across all training cell types. Enformer LP: Linear probing of Enformer CAGE header outputs. Binarized ATAC: GET model with only motif input. GET with finetuning shows the highest correlation at 0.94. d. Ablation study of GET pretraining on leave-out astrocytes, showing superior performance of finetuning the pretrained model when compared against random initialization and baselines. e. Comparison of GET to baseline machine learning models (CNN, MLP, CatBoost, SVMRegression, RandomForest, and LinearRegression) on leave-out-chromosome 11 and leave-out-astrocyte prediction performance (R2, Pearson correlation, Spearman correlation). f. Radar plot showing leave-one-chromosome-out finetuning performance (R2, Pearson correlation, Spearman correlation) of GET in fetal astrocytes.
Extended Data Fig. 3
Extended Data Fig. 3. Transfer learning adapts GET to new platforms and cell types.
a. GET trained on fetal cell types generalizes to adult cell types without retraining, outperforming the most correlated cell type baseline. X axis shows R2 score between GET prediction in adult cell types and observed expression in the most similar fetal cell types. Y axis shows R2 score between GET prediction and observed expression in the adult cell type. b. Schematic illustration of transferring GET to a lymph node 10x multiome dataset. c. Finetuned GET accurately predicts expression in training and leave-out evaluation lymph node cell types. d. Schematic showing the application of GET in the zero-shot setting to predict gene expression from glioblastoma (GBM) patient samples (top) and in the one-shot setting after being finetuned on a single GBM patient sample and used to predict gene expression for an extended cohort of GBM patients. e. Pearson correlation scores for GET expression prediction on GBM cells (n = 16 samples) comparing tumor cells, macrophages, and oligodendrocytes for zero-shot and one-shot (finetuned) settings. f. Radar plot showing leave-one-chromosome-out finetuning performance (R2, Pearson correlation, Spearman correlation) of GET in one GBM tumor sample. Schematics in b and d created using BioRender (https://biorender.com).
Extended Data Fig. 4
Extended Data Fig. 4. Transfer learning adapts GET to new modalities.
a. Three settings of GET finetuned on CAGE K562 dataset and evaluated on leave-out chromosome 14 as compared to Enformer predictions. GET finetuned with quantitative ATAC (“QATAC LoRA from QATAC fetal finetune” and “QATAC LoRA from BATAC pretrain”) outperforms GET finetuned with binarized ATAC (“BATAC LoRA from BATAC pretrain”) and Enformer predictions for the peak evaluation regions. Evaluation was performed for all TSS in chromosome 14. b. Performance of GET on ATAC prediction. GET performance for K562 and Astrocyte ATAC compared against Enformer’s predictions for DNase on K562 and Astrocyte output tracks. c. GET performance for K562 bulk OmniATAC, showing leave-one-chromosome-out Pearson correlation for all autosomes. d. GET performance for K562 scATAC, showing leave-out-motif analysis for randomly selected 1, 2, 3, 4, 10, or 20 motif features from the training set and evaluating on peaks with the left-out motifs (Methods: Model evaluation).
Extended Data Fig. 5
Extended Data Fig. 5. Ablation and enrichment analysis of GET-MPRA.
a. Scatter plot of lentiMPRA readout versus GET-MPRA prediction (top), observed ATAC signal (middle) and sum of GET-MPRA prediction and observed ATAC signal (bottom). b. Promoter (top) or ATAC peak (bottom) elements are gated into four sub-categories, respectively, based on high (+) or low (−) in Prediction (cutoff=1) or Observation (cutoff=0.5). c. Histone mark enrichment analysis of promoter (top) and peak (bottom) elements respectively using ENCODE K562 ChIP-seq data. d. Transcription factor binding site enrichment analysis of promoter (Top) and peak (Bottom) elements respectively using ENCODE K562 ChIP-seq data. Fisher exact test was performed. Tests with a p-value < 0.05 are shown. Color shows log10 (Fold enrichment). For transcription factors, the variance of fold enrichment across four groups was calculated, and the top 50 TFs are visualized.
Extended Data Fig. 6
Extended Data Fig. 6. Additional data on long range cis-regulatory elements identification.
a. Per-gene AUPRC benchmark of cis-regulatory region prediction with top 10% HbFbase as the label cut off. No bootstrapping was performed due to low number of enhancer-gene pairs. b. Distance stratified AUPRC benchmark using top 25% HbFbase as the label cut off. Data are presented as mean values with 95% confidence intervals across random bootstrapping (N = 1,000, 80% of the pairs). c. Cis-regulatory region prediction of HBG2 and MYB loci. d. Distance-stratified Pearson correlation between predicted scores and K562 CRISPRi effect size.
Extended Data Fig. 7
Extended Data Fig. 7. Regulatory analysis with GET.
a. Predicted top three regulators (motifs) for BCL11A, NFIX, and HBG2. Similar sequence patterns are highlighted with color shades. b. GATA downstream targets inferred by GET (top 10% motif score) show functional enrichment in ‘hemopoiesis’. Scatterplot shows predicted gene expression (X axis) and GATA-motif score (Y axis) for GATA-targeted genes with predicted expression larger than 1. All transcription factors among these genes are labeled in the plot, where those involved in Hemopoiesis are highlighted in red. c. Workflow to collect and visualize the cross-cell-type regulatory embedding, showing a tSNE visualization of the resulting embedding space colored by Louvain clustering. d. Subsampled first layer embeddings from fetal astrocyte (blue) and two fetal erythroblast cell types are visualized with UMAP (yellow and brown). e. Louvain clustering of subsampled embedding in panel d. f. Gene ontology enrichment of genes in cluster 2, showing astrocyte-relevant terms and astrocyte marker genes e.g. NFIA, GLI3. X axis shows adjusted -log10 P-value from one-sided Fisher’s exact test. g. GET motif contribution Z-score (red means higher score compared to other clusters) for each cluster. Note that cluster 2 has elevated NFI/1 and NFI/2 motifs, which correspond to the NFI family transcription factors. h. Top correlated motif pairs have significantly larger functional similarity. X-axis is cosine similarity computed on term (motif clusters) frequency–inverse document (Gene Ontology biological process) frequency (transcription factor-IDF) matrix. i. Example causal neighbor graph showing interactions (edges) between motifs (nodes). Edge weights represent interaction effect size. Edge directions mark causal direction. Blue and red edge colors mark negative and positive estimated causal effect sizes by LiNGAM, respectively. Node color marks community detected on the full causal graph. In-community edges are marked by reduced saturation. j. Out-degree distribution across cell-type-specific causal networks.
Extended Data Fig. 8
Extended Data Fig. 8. Structural properties of GET causal network.
a. Catalogs of TF-TF interactions. Direct interactions include homodimers, intra-family heterodimers, or inter-family heterodimers. Cofactor-mediated interactions may include both cooperative and competitive binding. b. pLDDT plot for the IDR (intrinsically disordered region) and DBD (DNA-binding domain) for TFAP2A and ZFX. c. Predicted monomer structure of ZFX. d. Predicted multimer structure of TFAP2A structured domains and ZFX IDR. Red and blue color marks negative and positive electrostatic surfaces, respectively. e. Molecular dynamics simulation (100 ns) of TFAP2A-ZFX IDR (red) and ZFX IDR monomer (purple). Collapsed structure in ZFX IDR monomer is highlighted in rectangle. f. Sequence logo of ZFX and TFAP2A transcription factor binding motifs. g. Immunoblot detection of TFAP2A, ZFX, and β-ACTIN from HeLa cell lysates subjected to co-immunoprecipitation using a TFAP2A antibody. β-ACTIN serves as a loading control in the same gel. Abbreviation: Pre, HeLa cell lysate prior to bead incubation; Post, HeLa cell lysate after bead incubation; IP, immunoprecipitated proteins. B, empty lane. Two independent experiments were repeated with similar results. A representative result was shown. Raw gel image is in Supplementary Fig. 1. h-j. Prediction of structural interactions between SNAI1 N-terminal and EP300 TAZ2 domain, SNAI1 N-terminal and EP300 TAZ1 domain, and RELA C-terminal and EP300 TAZ1 domain. Red and blue color marks negative and positive electrostatic surfaces, respectively.
Extended Data Fig. 9
Extended Data Fig. 9. Additional structural analysis of GET causal network.
a. Prediction performance of “intra-family binder” transcription factors using different multimer structure prediction confidence scores. (Left) ROC curve with X axis showing false positive rate and Y axis showing true positive rate. (Right) PR curve with X axis showing recall and Y axis showing precision. mean_plddt: Average predicted Local Distance Difference Test (pLDDT) score across all residues. pae: Predicted Aligned Error across all inter-chain interactions. pdockq: Predicted DockQ metric using interface pLDDT. pdockq_pae: Multiplication of pDockQ and pAE. b. Comparison of AlphaFold 2 predicted TFAP2A dimer structure (pink) with crystal structure of TFAP2A (yellow)-DNA (green) complex. c. Change in number of hydrogen bonds in TFAP2A-ZFX IDR complex or ZFX IDR monomer across simulation trajectory. d. Correlation between pLDDT and residue root mean square deviation (RMSD) across the simulation trajectory of ZFX IDR in the complex structure. Visualized in scatter plot (top) and line plot across the protein sequence (bottom). Yellow and blue shades in the line plot highlight beta sheets or alpha helices. e. Upper panel show AlphaFold3-based structure prediction between SRF IDR with its DNA-binding domain (133-230aa) removed and full length TFAP2A, demonstrating no clear interactions between these two proteins and low prediction confidence for SRF IDR, indicating its highly disordered structure. Color represents pLDDT (red is high, blue is low; left) or chains (pink, purple, green; right). Lower micrographs show immunoblot detection of SRF and β-ACTIN from HeLa cell lysates subjected to co-immunoprecipitation using a TFAP2A antibody. β-ACTIN serves as a loading control in the same gel, as well as a sample processing control for Extended Data Fig. 7g. SRF and β-ACTIN both show no interactions with TFAP2A as determined by co-immunoprecipitation. Abbreviations: Pre, HeLa cell lysate prior to bead incubation; Post, HeLa cell lysate after bead incubation; IP, immunoprecipitated proteins; B, empty lane. Raw gel image is in Supplementary Fig. 1. f. Predicted multimer structure of EGR1 IDR-ZFX IDR. g. Predicted multimer structure of ZEB1 C-terminal and ESR1 NR domain. h. Distribution of GET Causal Absolute Effect Size (Y axis) against AlphaFold2-derived EP300-mediated motif-motif interaction potential (X axis); Mann-Whitney U test P-value 9.73e-3; Fisher exact test P-value 7.3e-3 (one-sided, odds ratio=1.57) with GET Causal cutoff at 95% percentile over all motif-motif pairs. Box plot showing median and interquartile range.
Extended Data Fig. 10
Extended Data Fig. 10. Validation experiments for proximity labelling assay in B-ALL REH cell line.
a. Detection of biotinylated proteins in REH cell line transduced with PAX5 WT-linker-BioID (PAX5 WT) and PAX5 G183S-linker-BioID (PAX5 G183S) fusion proteins by western blot analysis using streptavidin-HRP. Expression of RHOA WT-linker-BioID is used as specificity control (RHOA WT). b. Detection of PAX5 and RHOA BioID-fusion proteins in REH cells by western blot analysis using anti-PAX5 and anti-HA antibodies. c. Fusion protein quantification from panel b. d. Detection of biotinylated proteins in whole cell lysates (input; 1% of total protein lysate) and Streptavidin-enriched eluates (Enrichment) by streptavidin-HRP staining. GAPDH was used as a loading control in the same gel. Raw gel images are in Supplementary Fig. 1.
Extended Data Fig. 11
Extended Data Fig. 11. PAX5 G183S drives a PAX5-NR2C2 coregulated transcriptional program.
a. Venn diagram of identified PAX/2 and NR/3 specific and common regulatory targets using GET gene-by-motif importance matrix. b. Enrichment analysis (-log 10 adjusted p-value from one-sided Fisher exact test) using B-cell associated gene sets in Shah et al. (top) and biological process gene ontology gene sets (bottom). Results for the PAX/2-NR/3 common genes are shown in this figure. c. Gene enrichment analysis of NR/3-specific (orange) and PAX/2-specific (blue) target genes using published B cell related gene sets. d. Gene enrichment analysis of NR/3-specific (orange) and PAX/2-specific (blue) target genes using gene ontology biological processes. e. Heatmap with the specific transcriptional program for the cases with the germline PAX5 G183S mutation. f. Enrichment analysis for differentially expressed genes between PAX5 wild type vs. PAX5 loss (left) and PAX5 G183S vs. other PAX5 alterations (CNV loss, P80R). * indicates statistical significance from one-sided hypergeometric tests. Benjamini-Hochberg adjusted P-values: PAX5: 6.34e-3 (left); NR/3: 4.24e-30; PAX5 + NR/3: 6.28e-18; ProB_Activated: 8.86e-3 (right).

Update of

References

    1. Domcke, S. et al. A human cell atlas of fetal chromatin accessibility. Science370, eaba7721 (2020). - PMC - PubMed
    1. Zhang, K. et al. A single-cell atlas of chromatin accessibility in the human genome. Cell184, 5985–6001.e19 (2021). - PMC - PubMed
    1. Li, J. et al. Conservation and divergence of vulnerability and responses to stressors between human and mouse astrocytes. Nat. Commun.12, 3958 (2021). - PMC - PubMed
    1. Avsec, Ž. et al. Effective gene expression prediction from sequence by integrating long-range interactions. Nat. Methods18, 1196–1203 (2021). - PMC - PubMed
    1. Gordon, M. G. et al. lentiMPRA and MPRAflow for high-throughput functional characterization of gene regulatory elements. Nat. Protoc.15, 2387–2412 (2020). - PMC - PubMed

LinkOut - more resources