. 2025 Feb;638(8051):814-822.
doi: 10.1038/s41586-024-08374-0. Epub 2025 Jan 8.

Satellite DNA shapes dictate pericentromere packaging in female meiosis

Affiliations

Satellite DNA shapes dictate pericentromere packaging in female meiosis

Damian Dudka et al. Nature. 2025 Feb.

Abstract

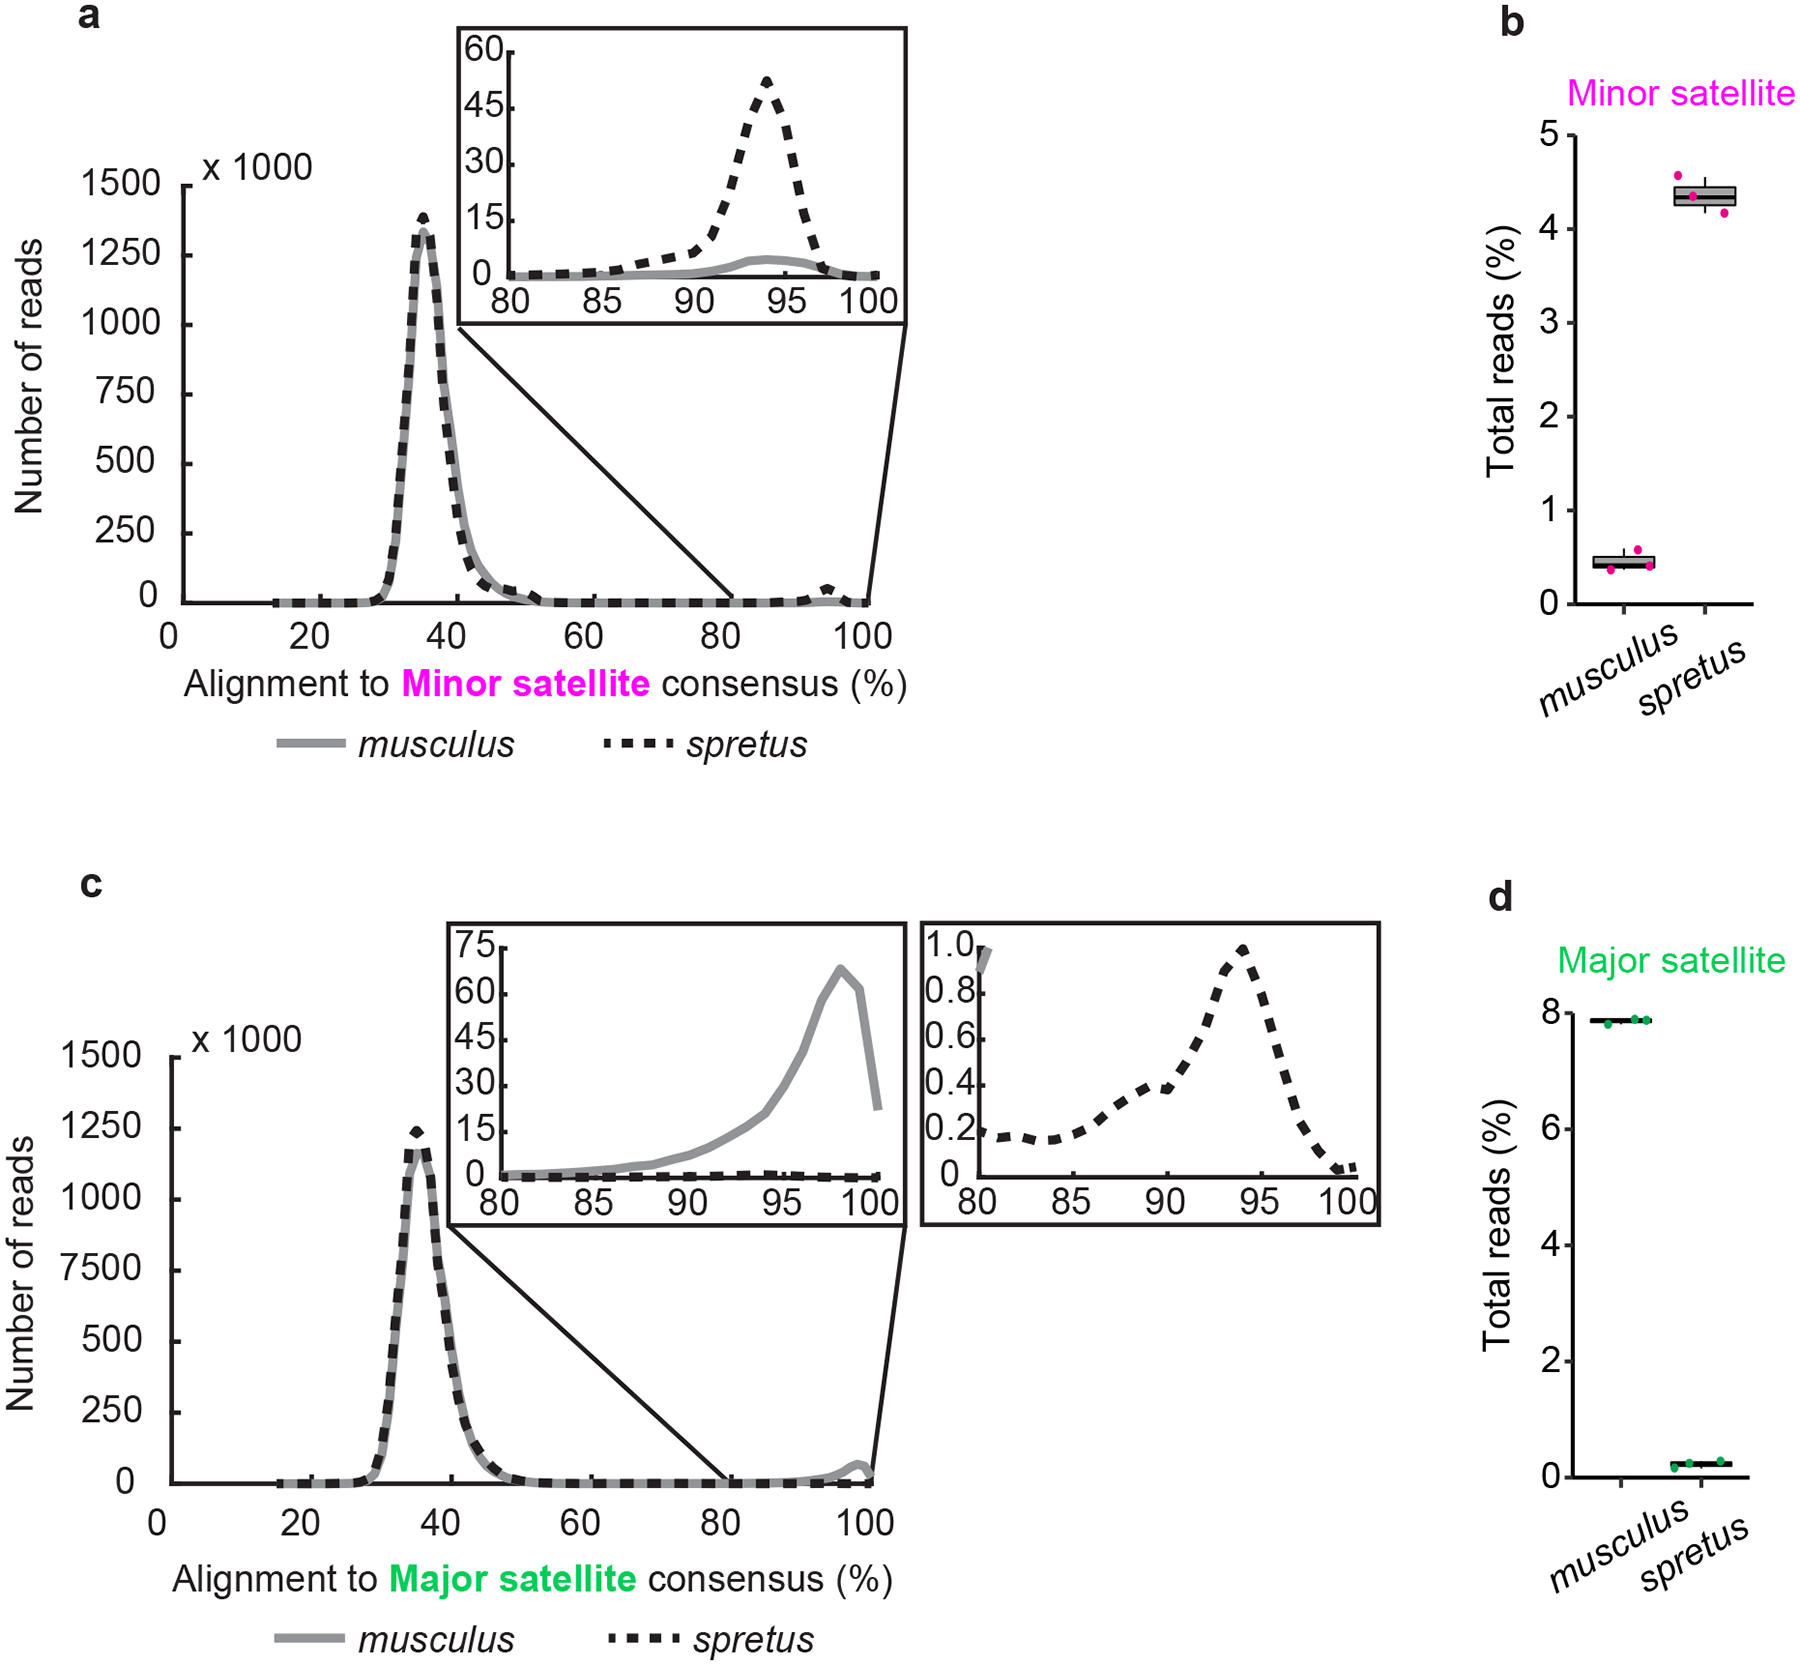
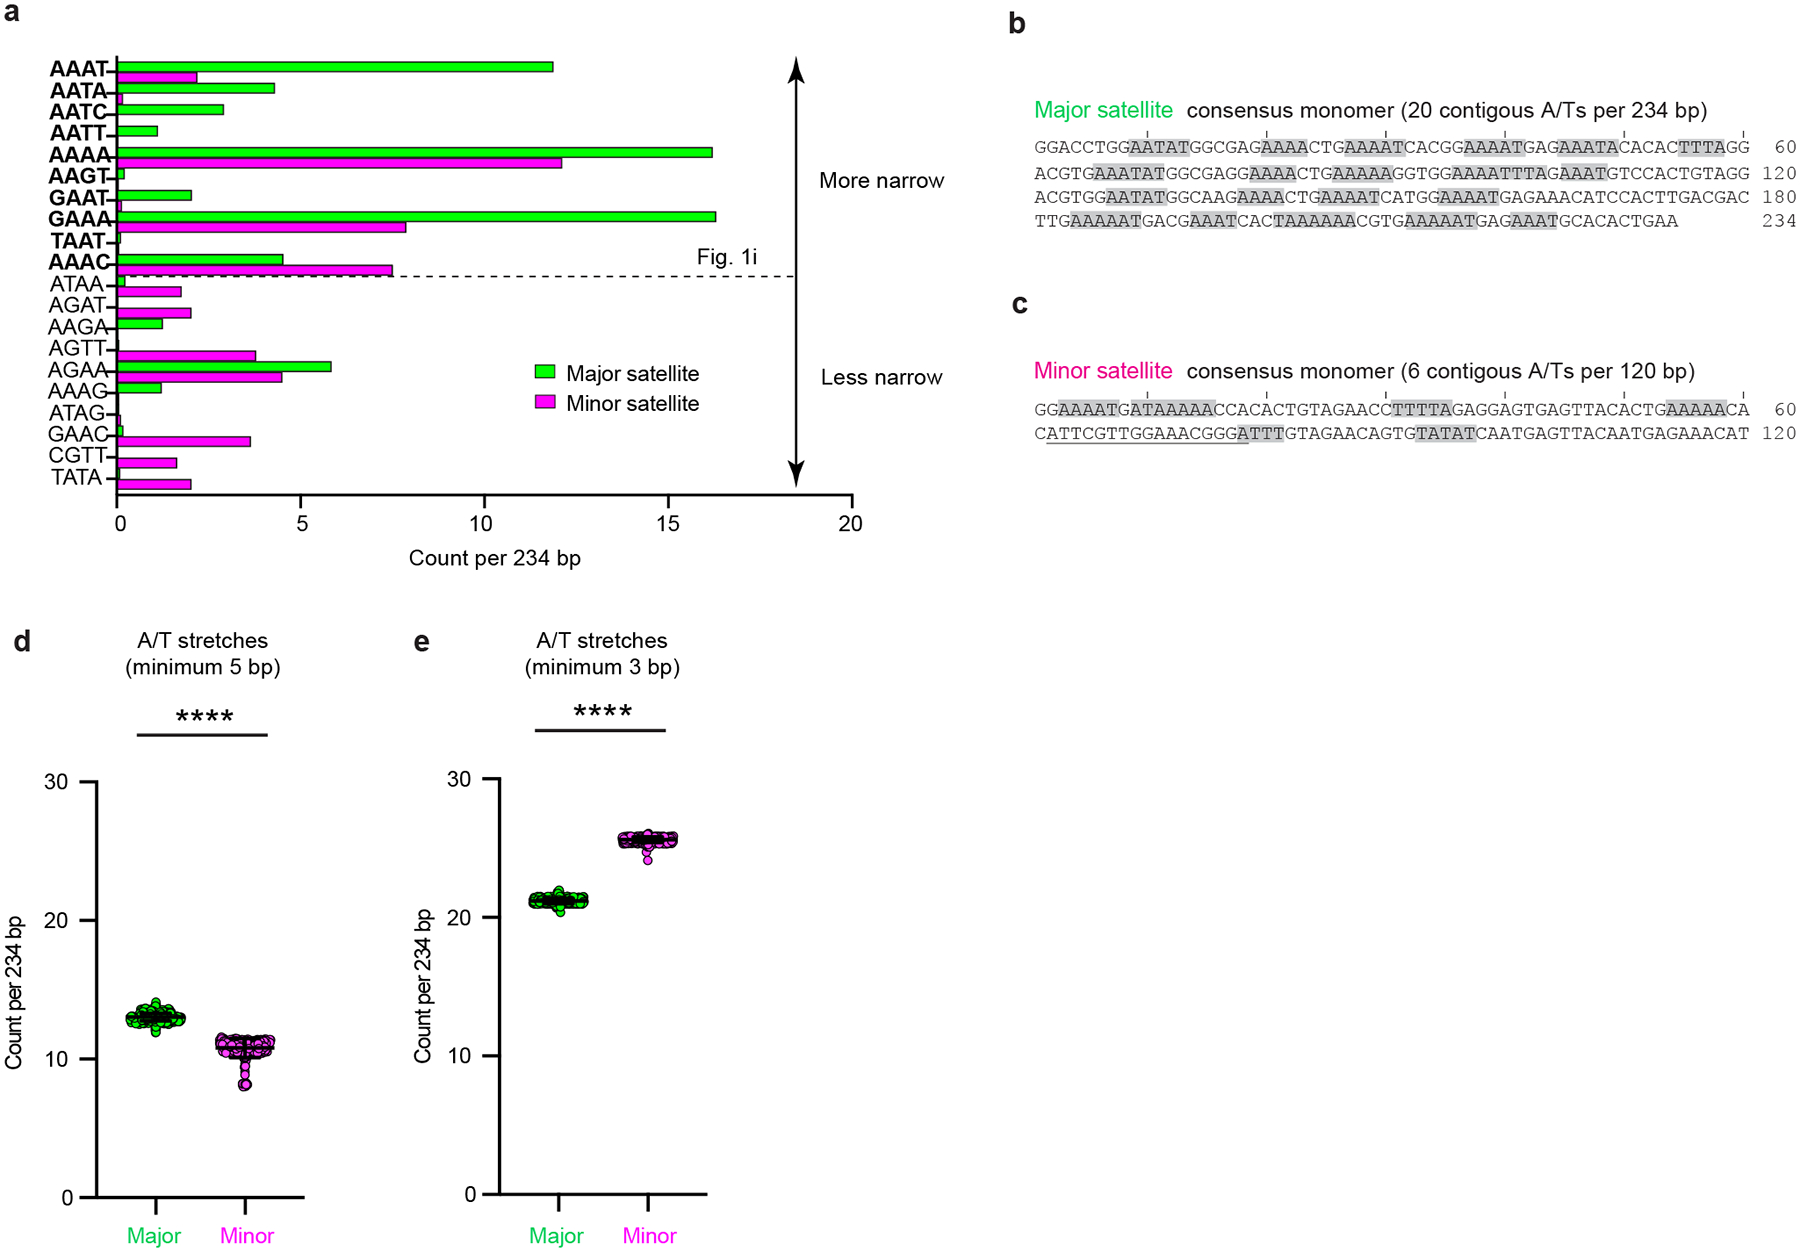
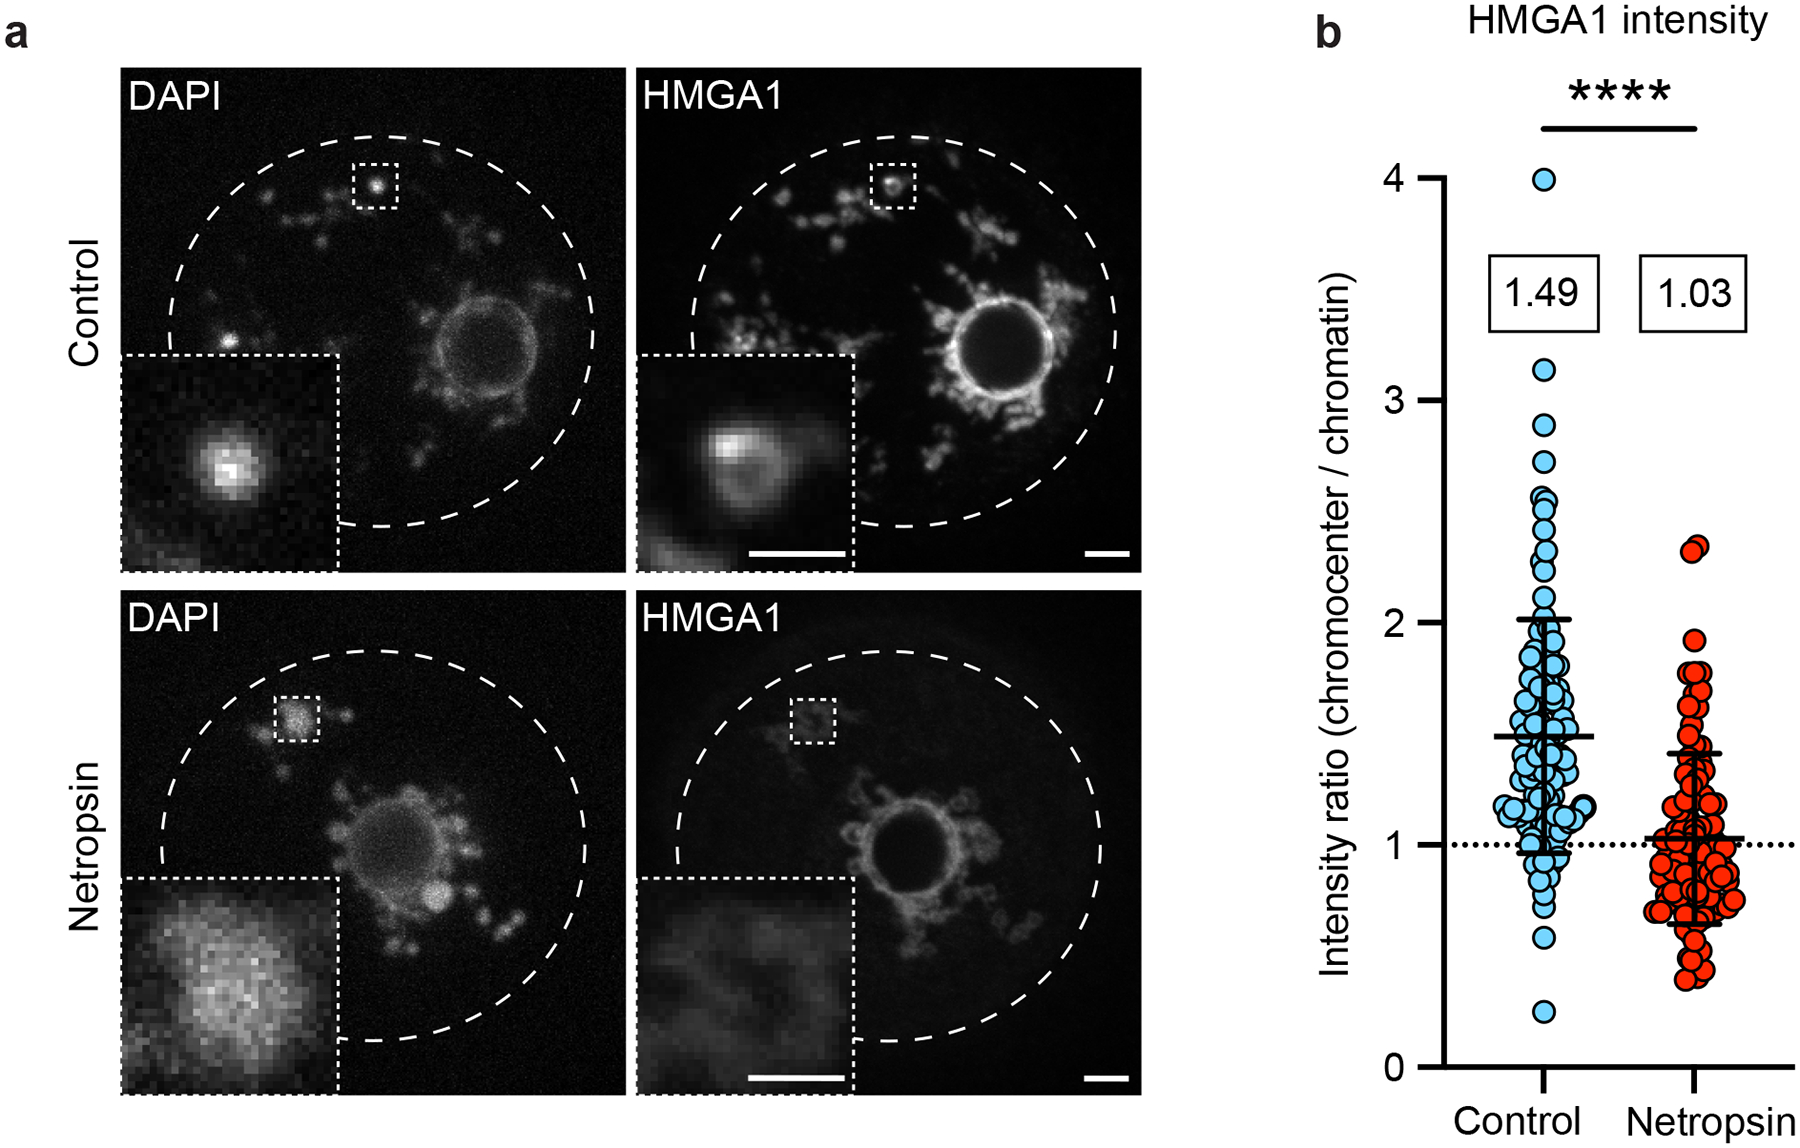
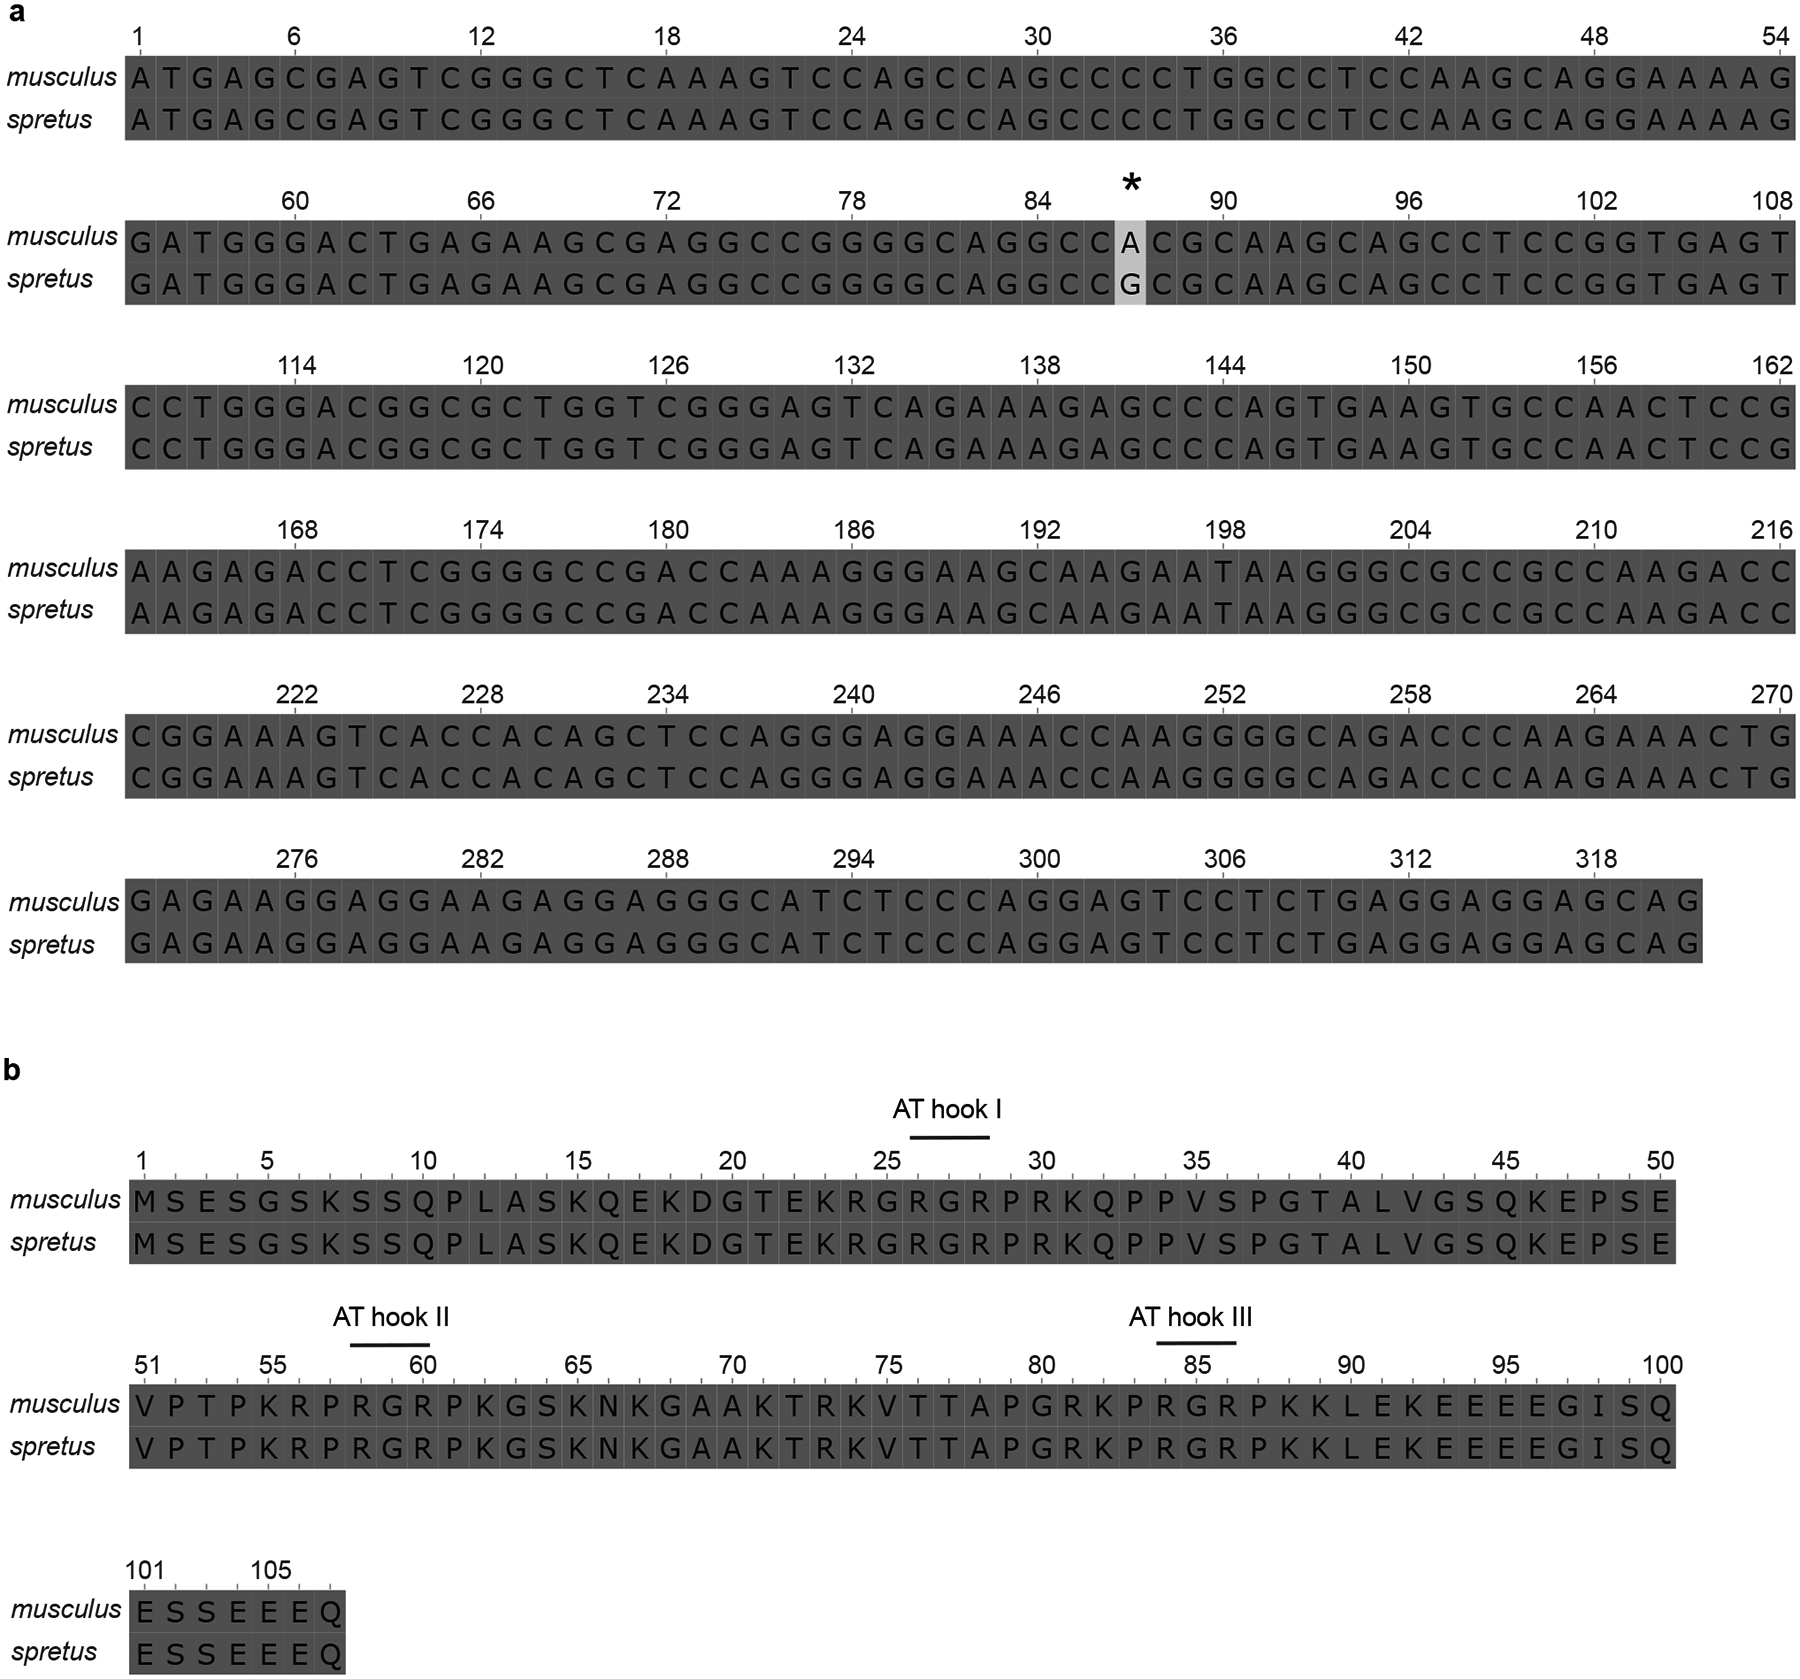
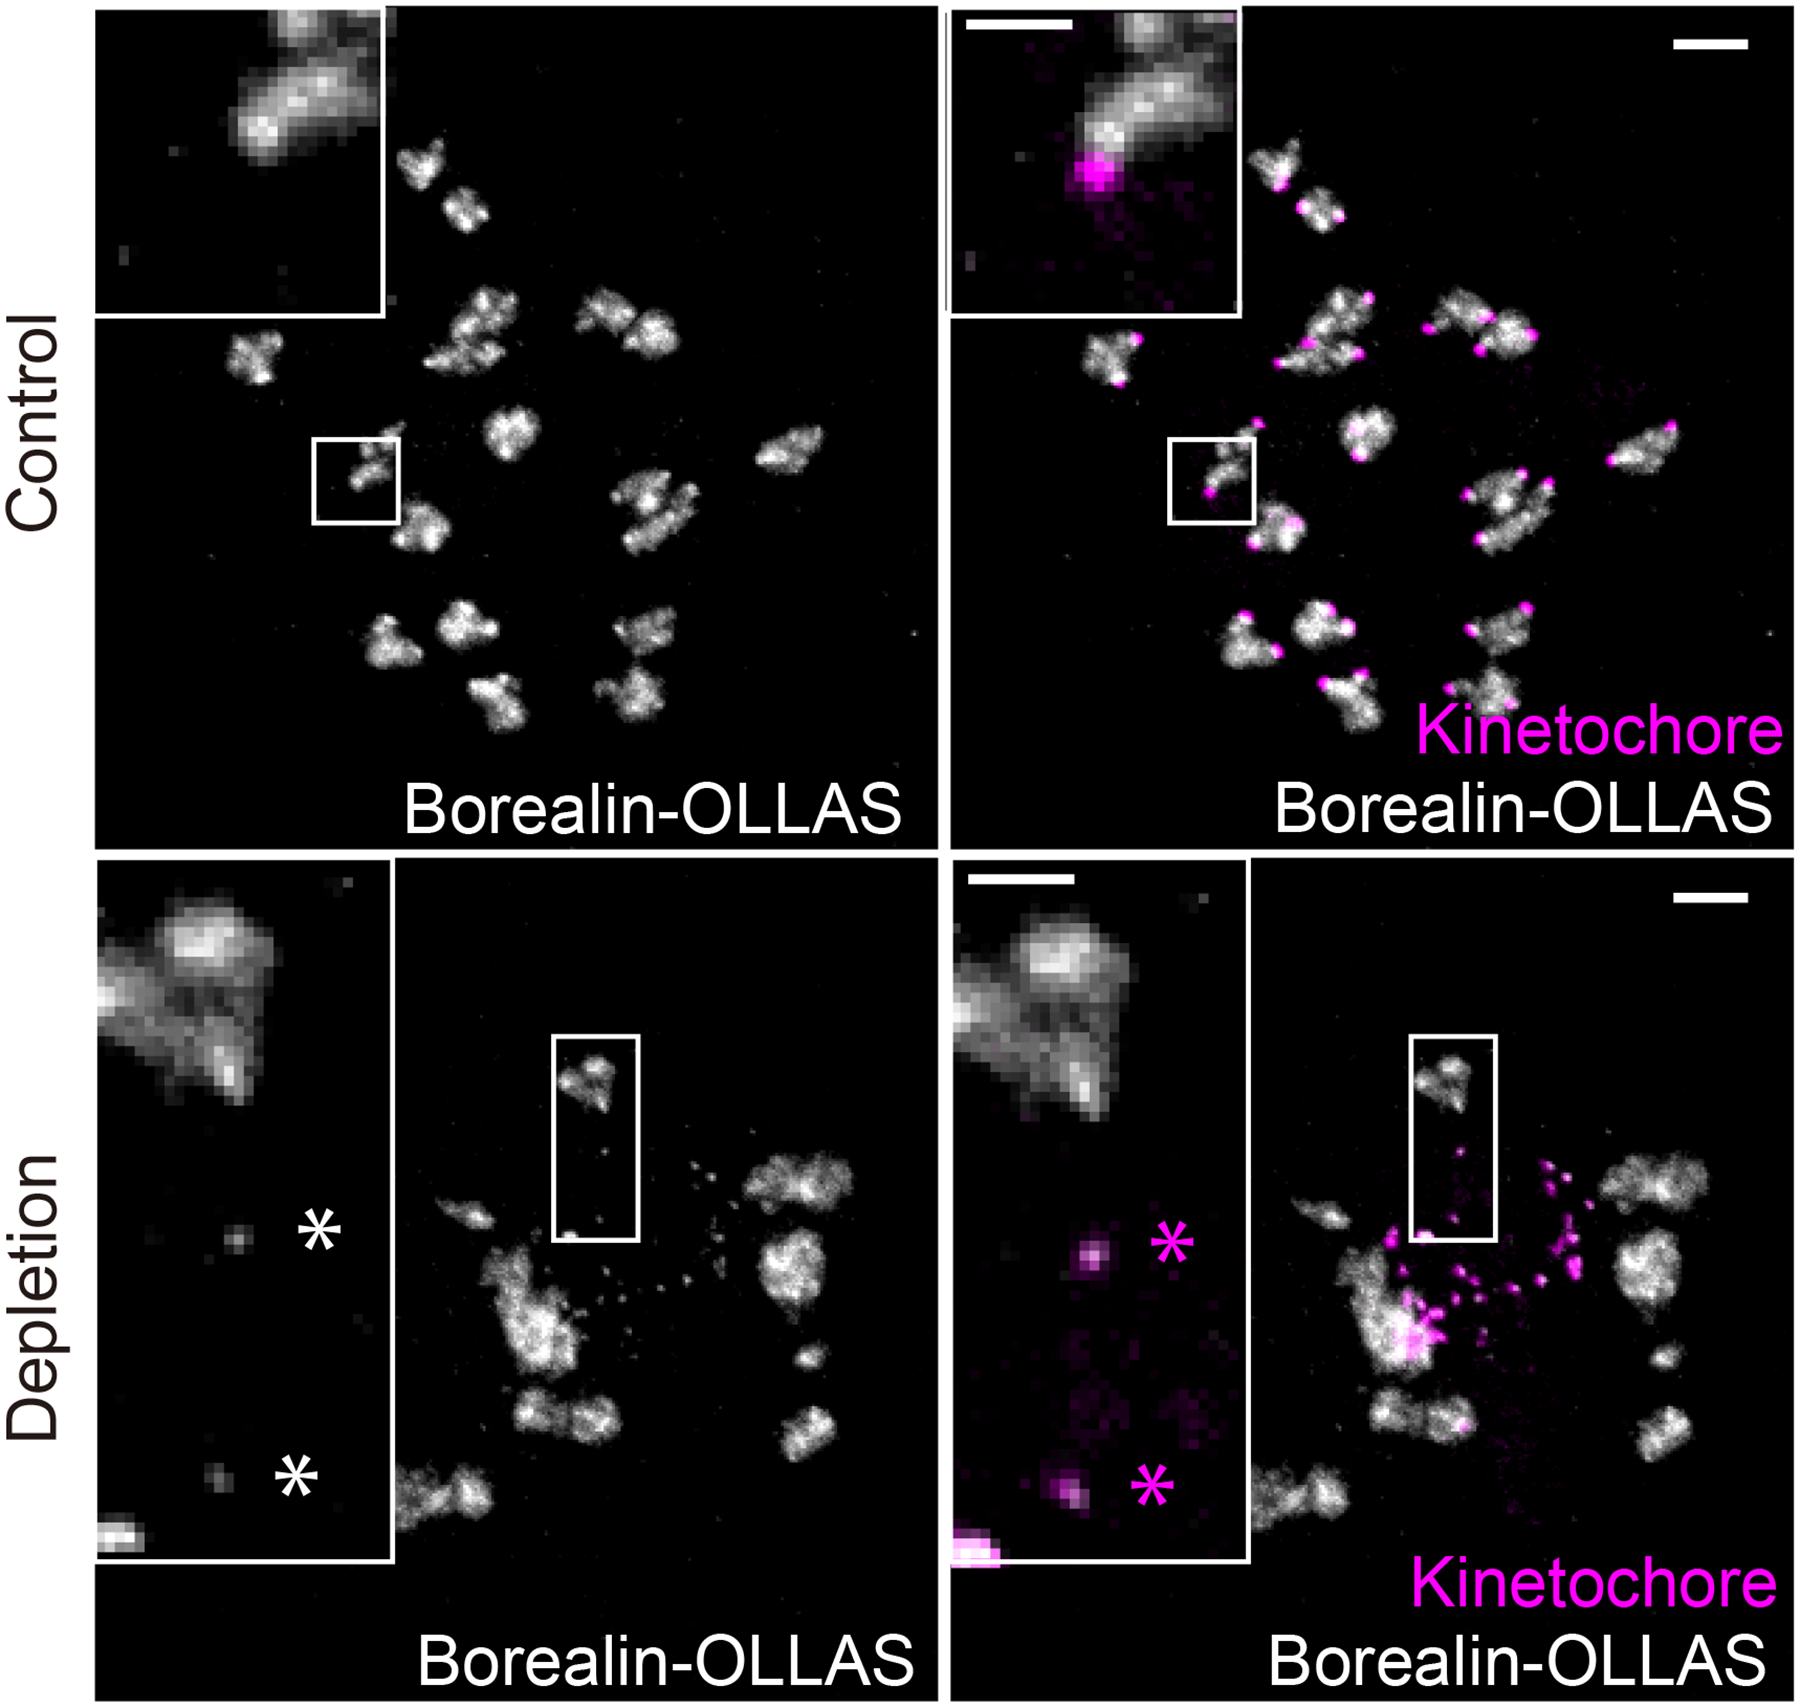
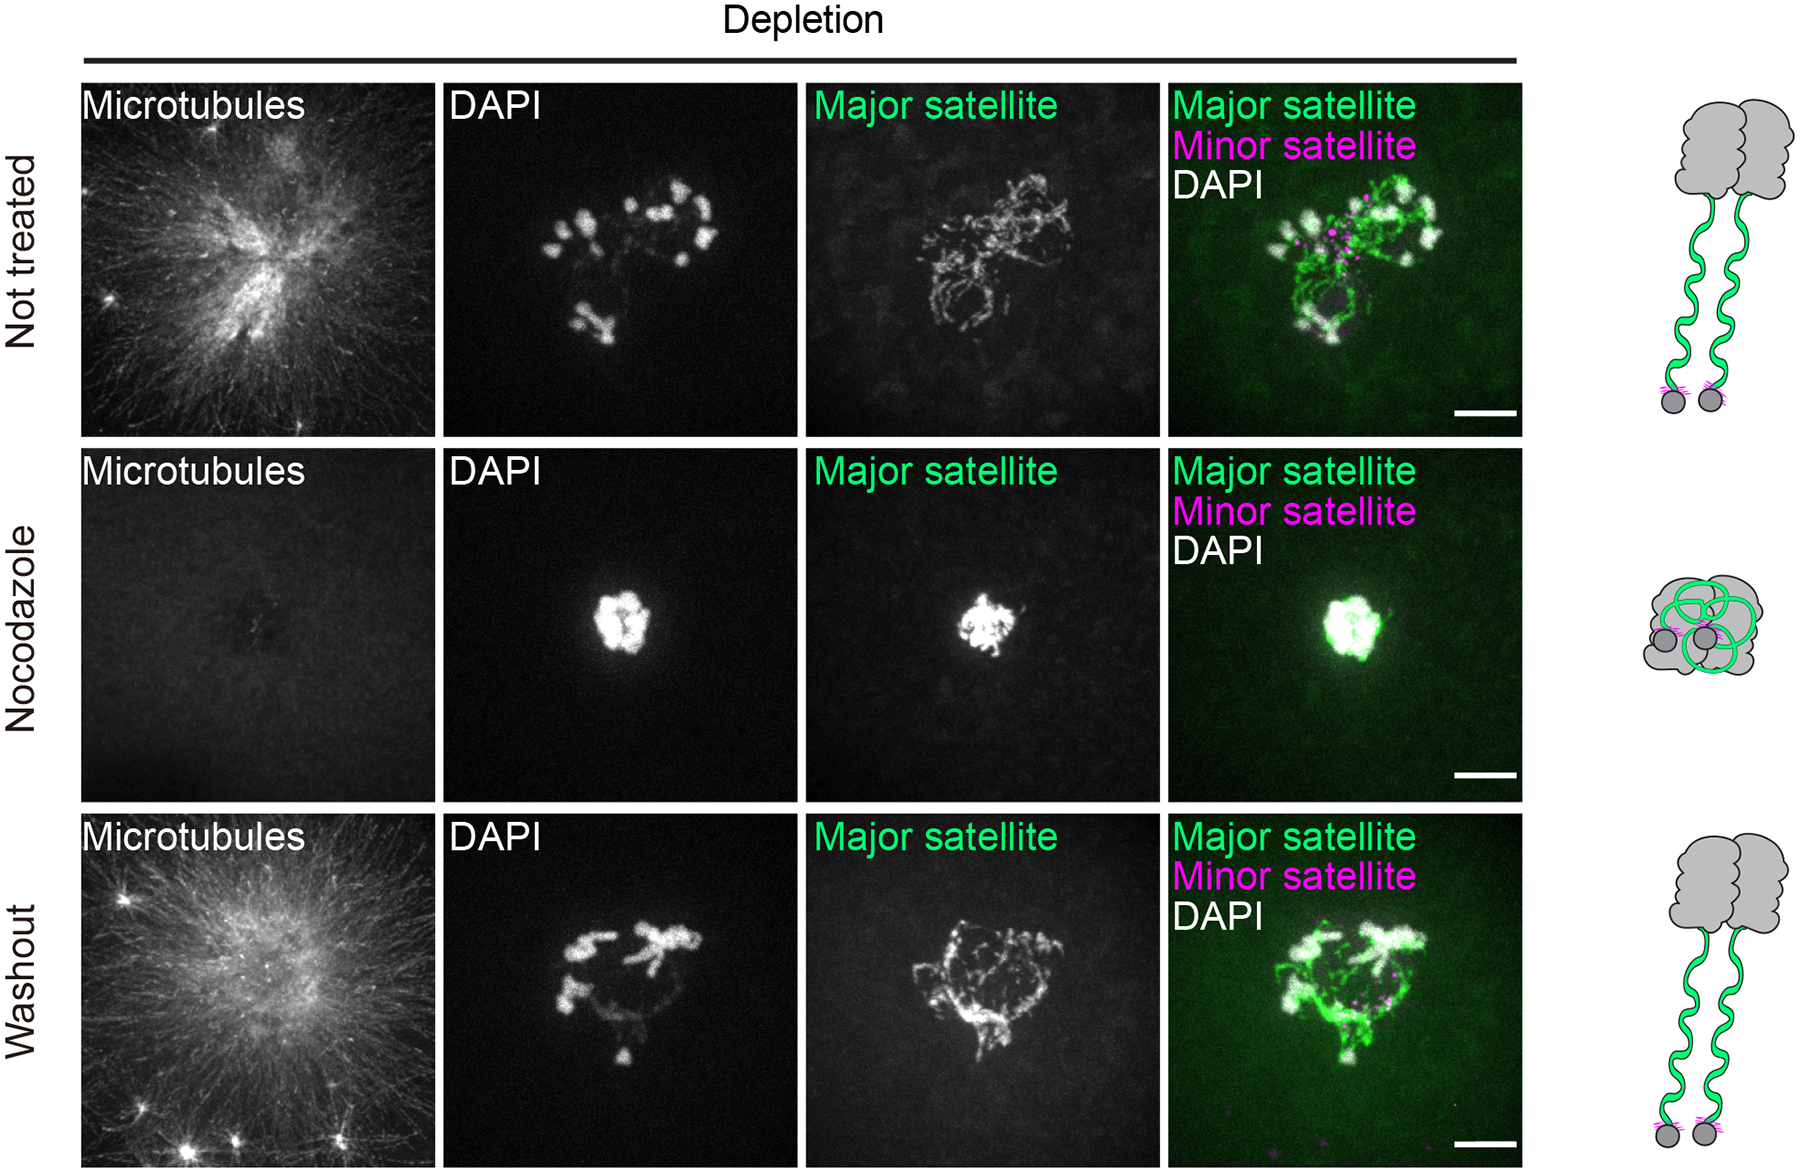
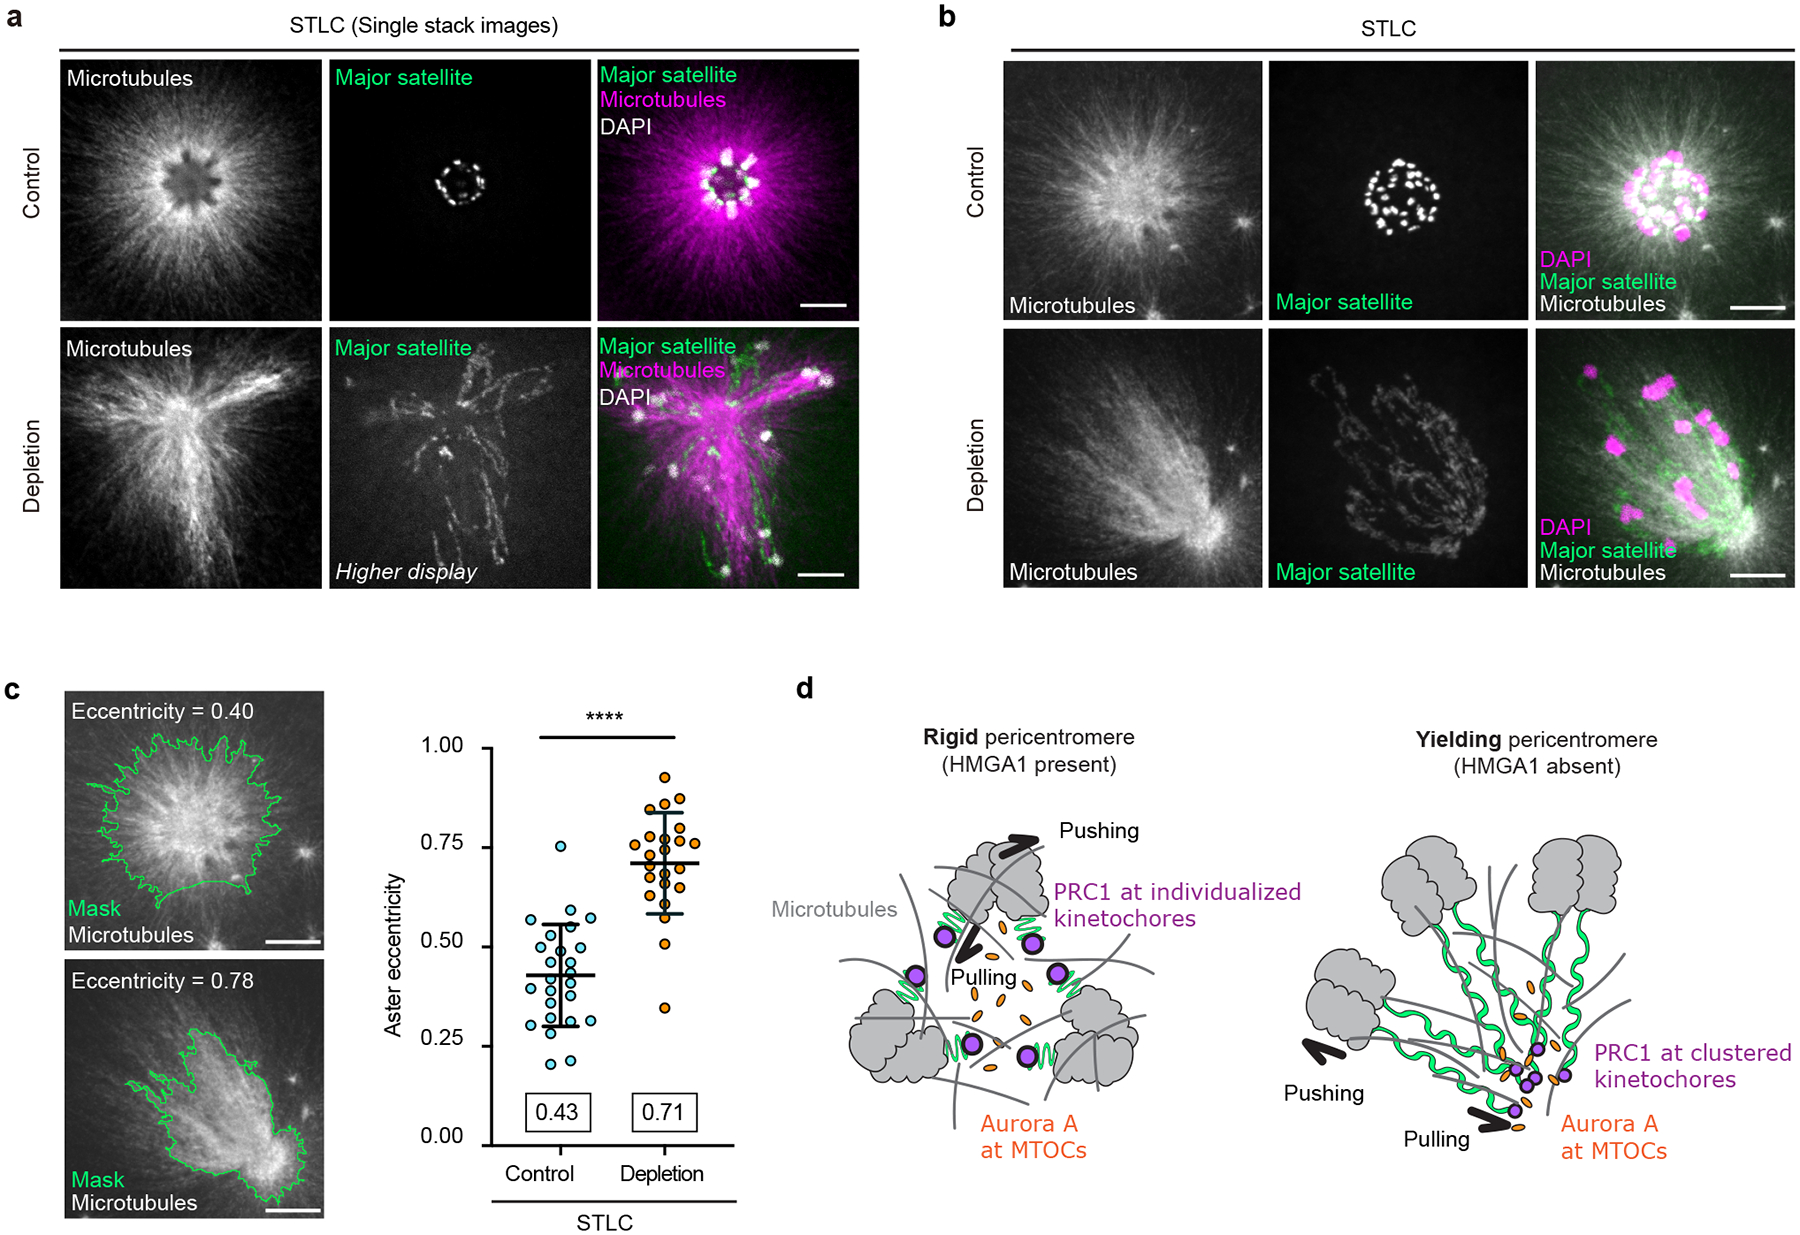
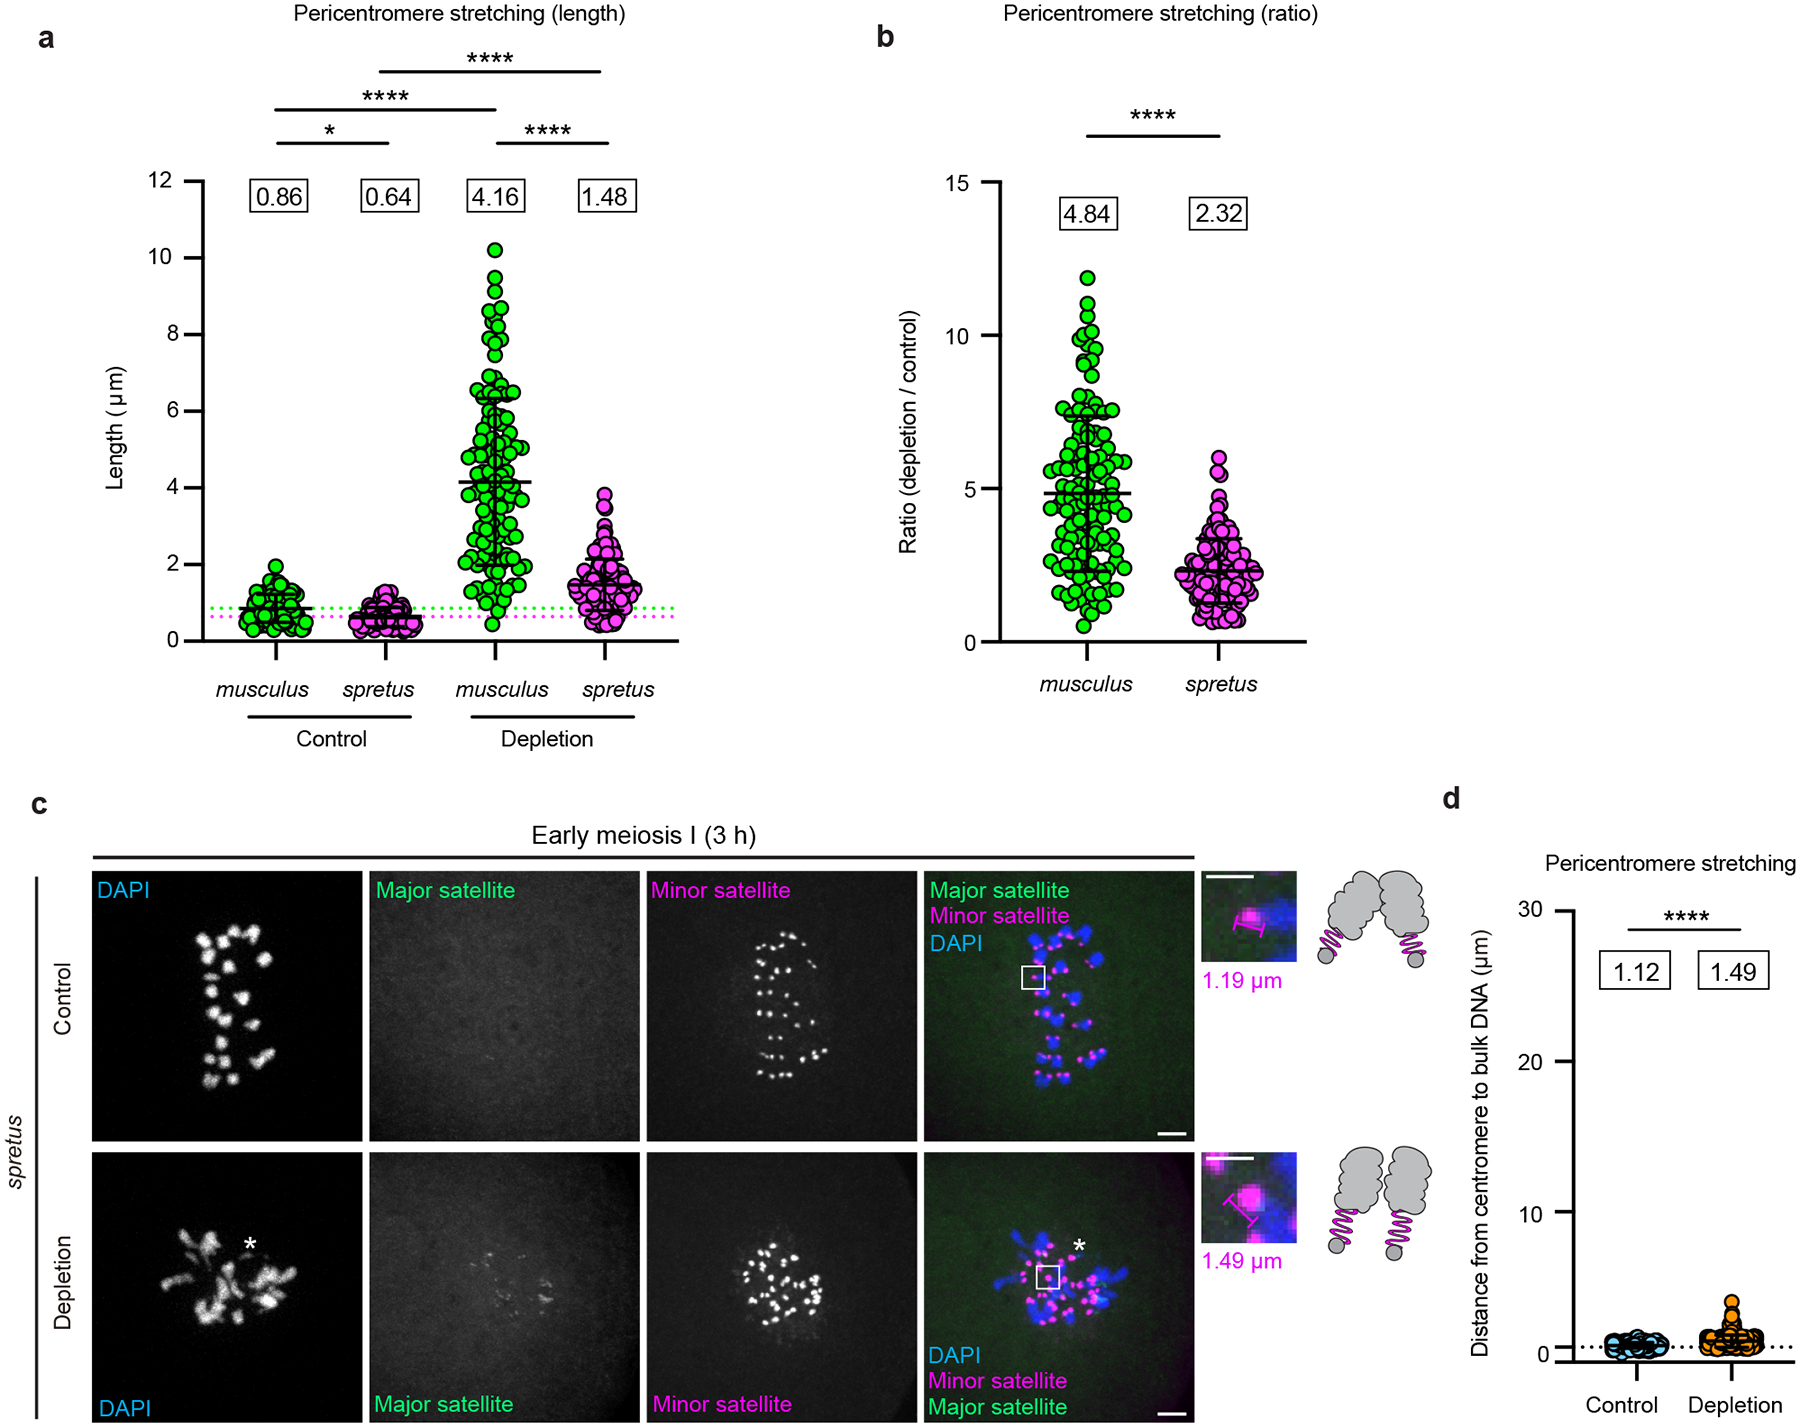
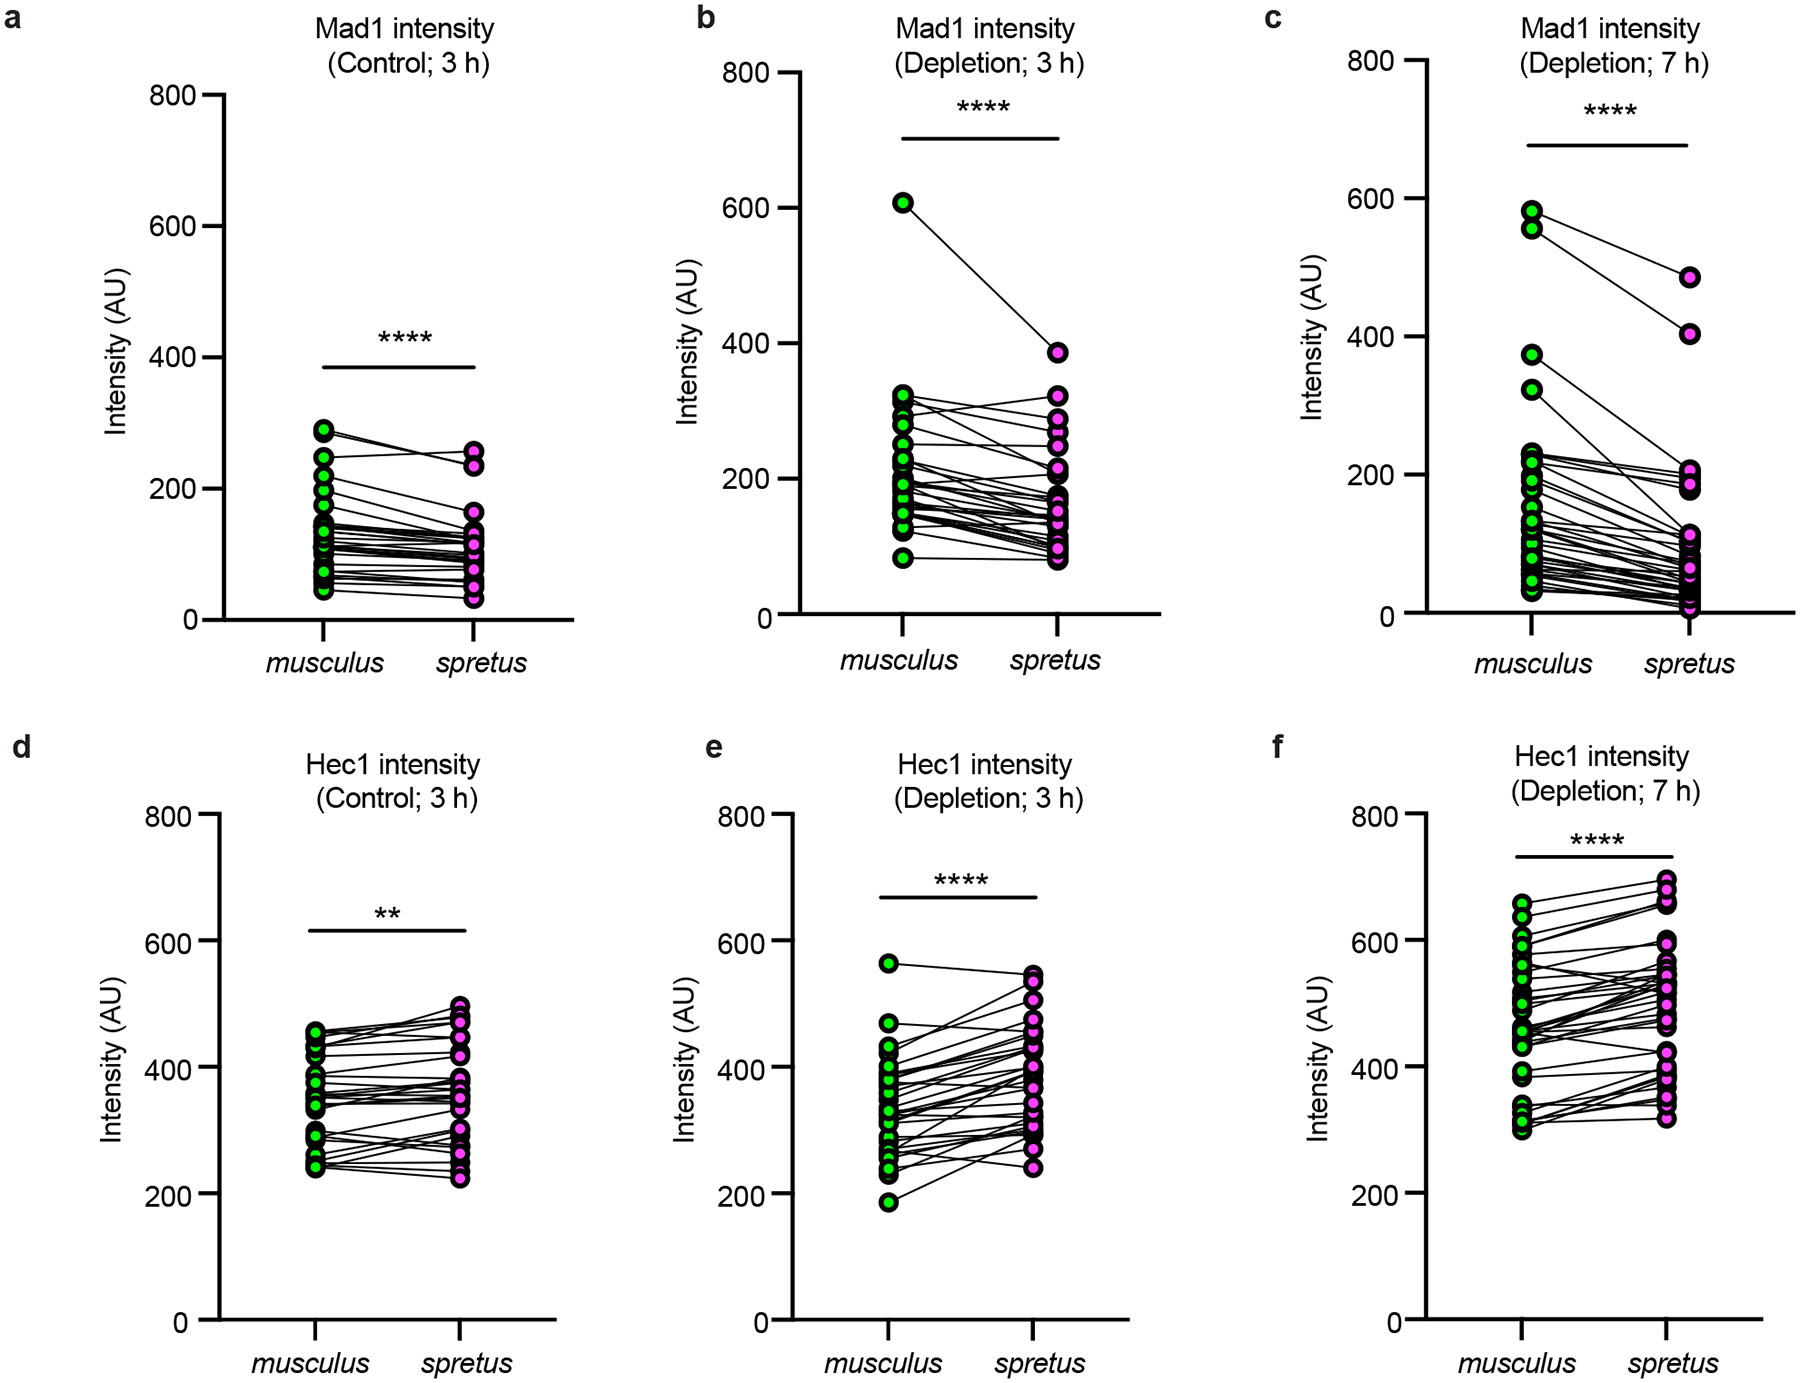
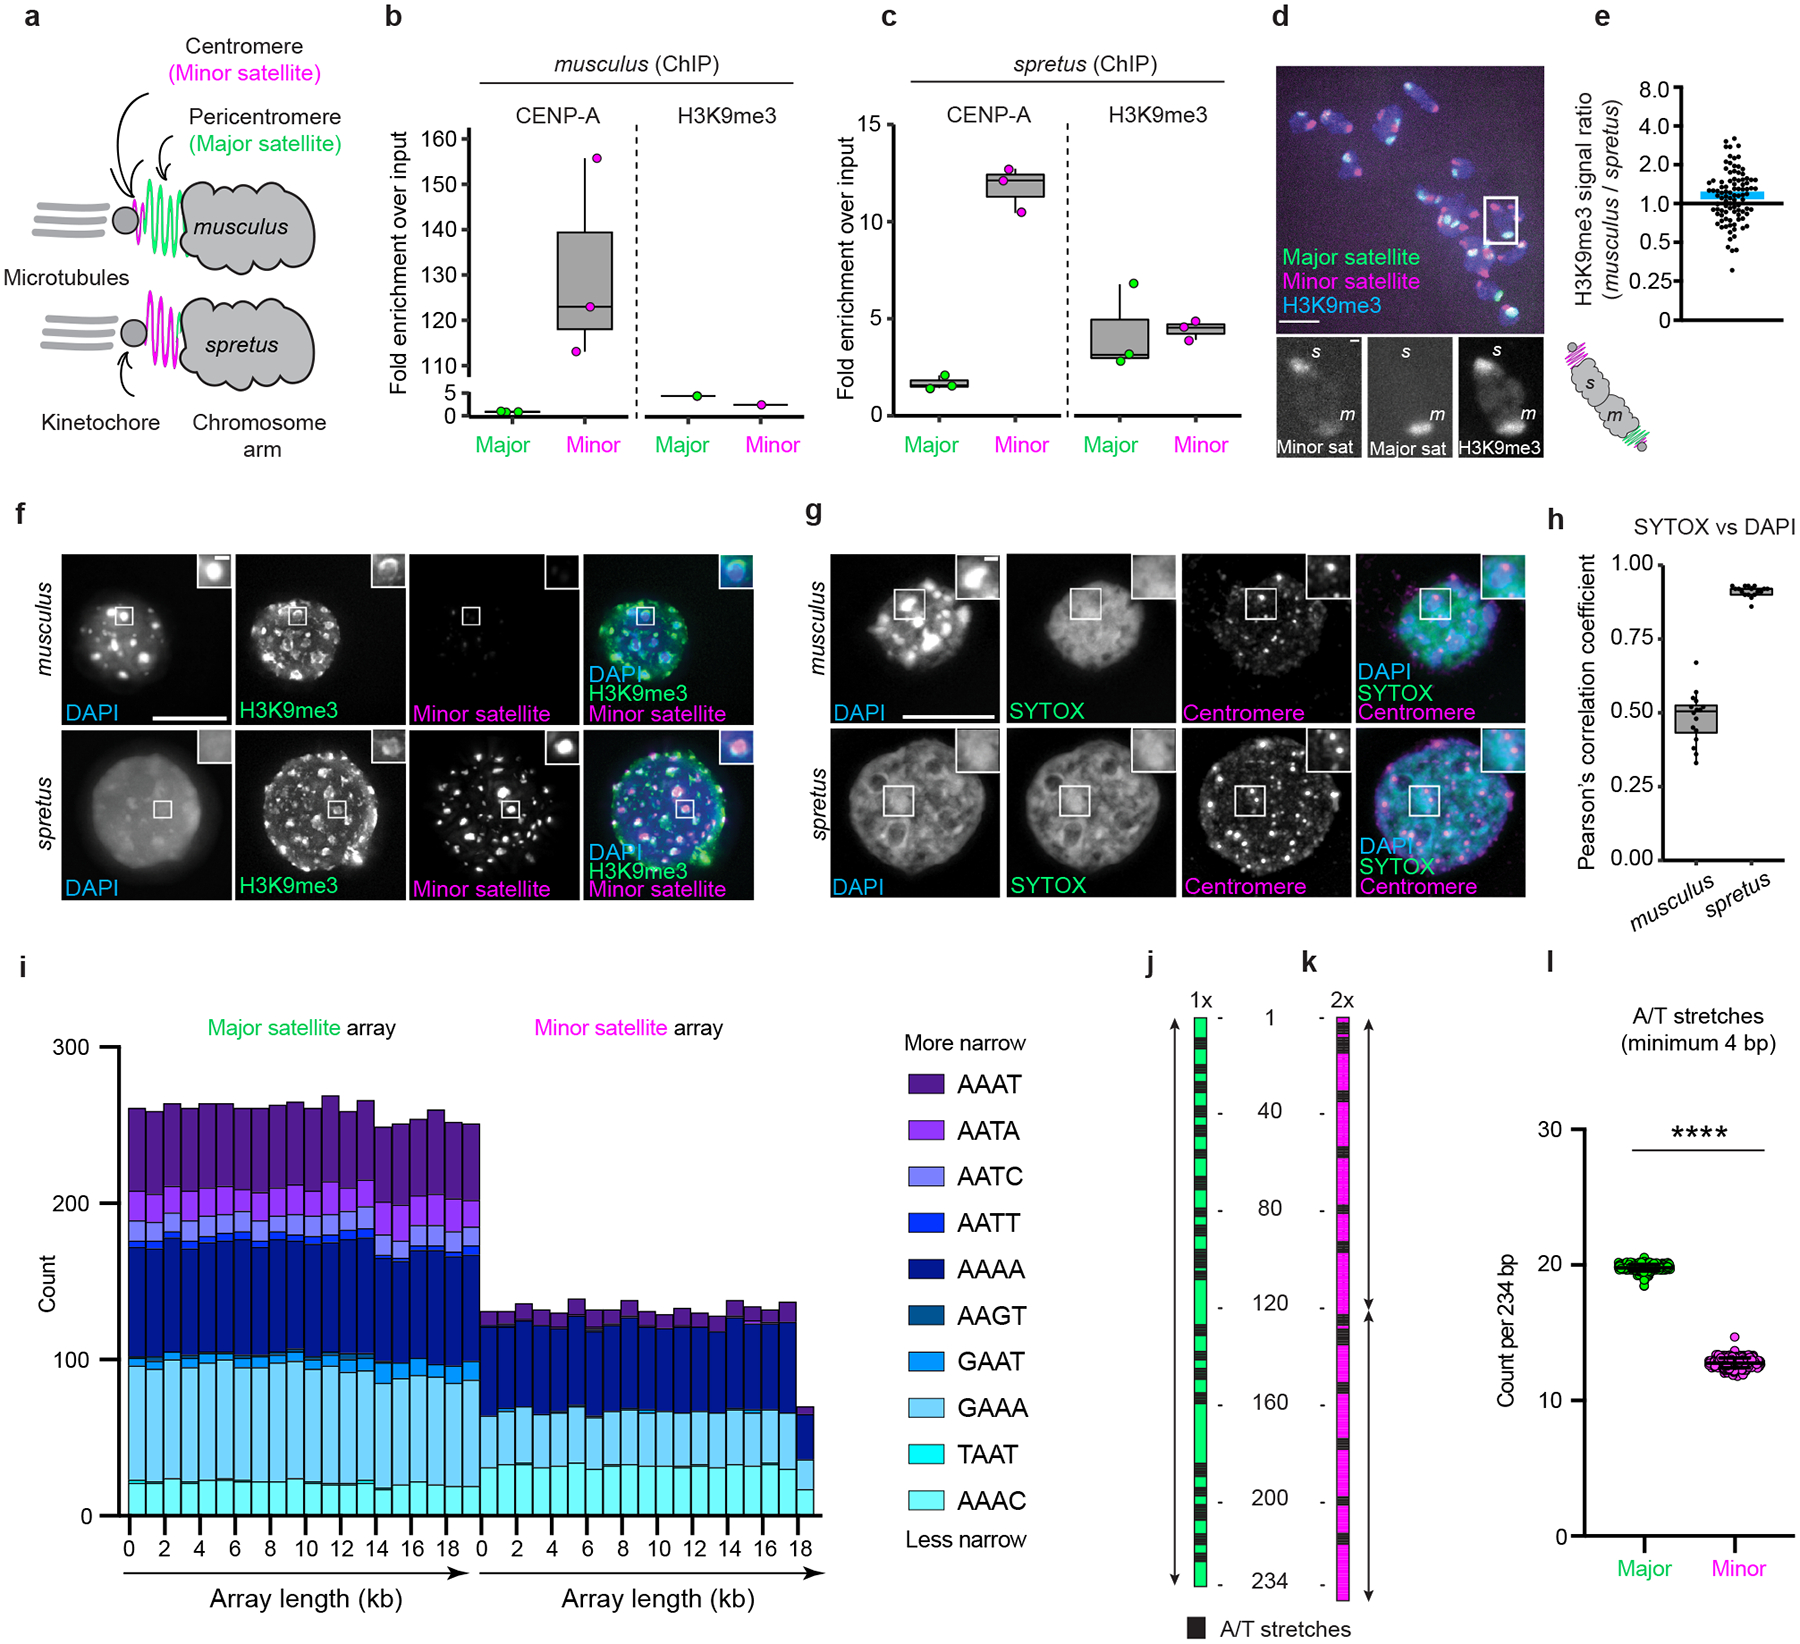
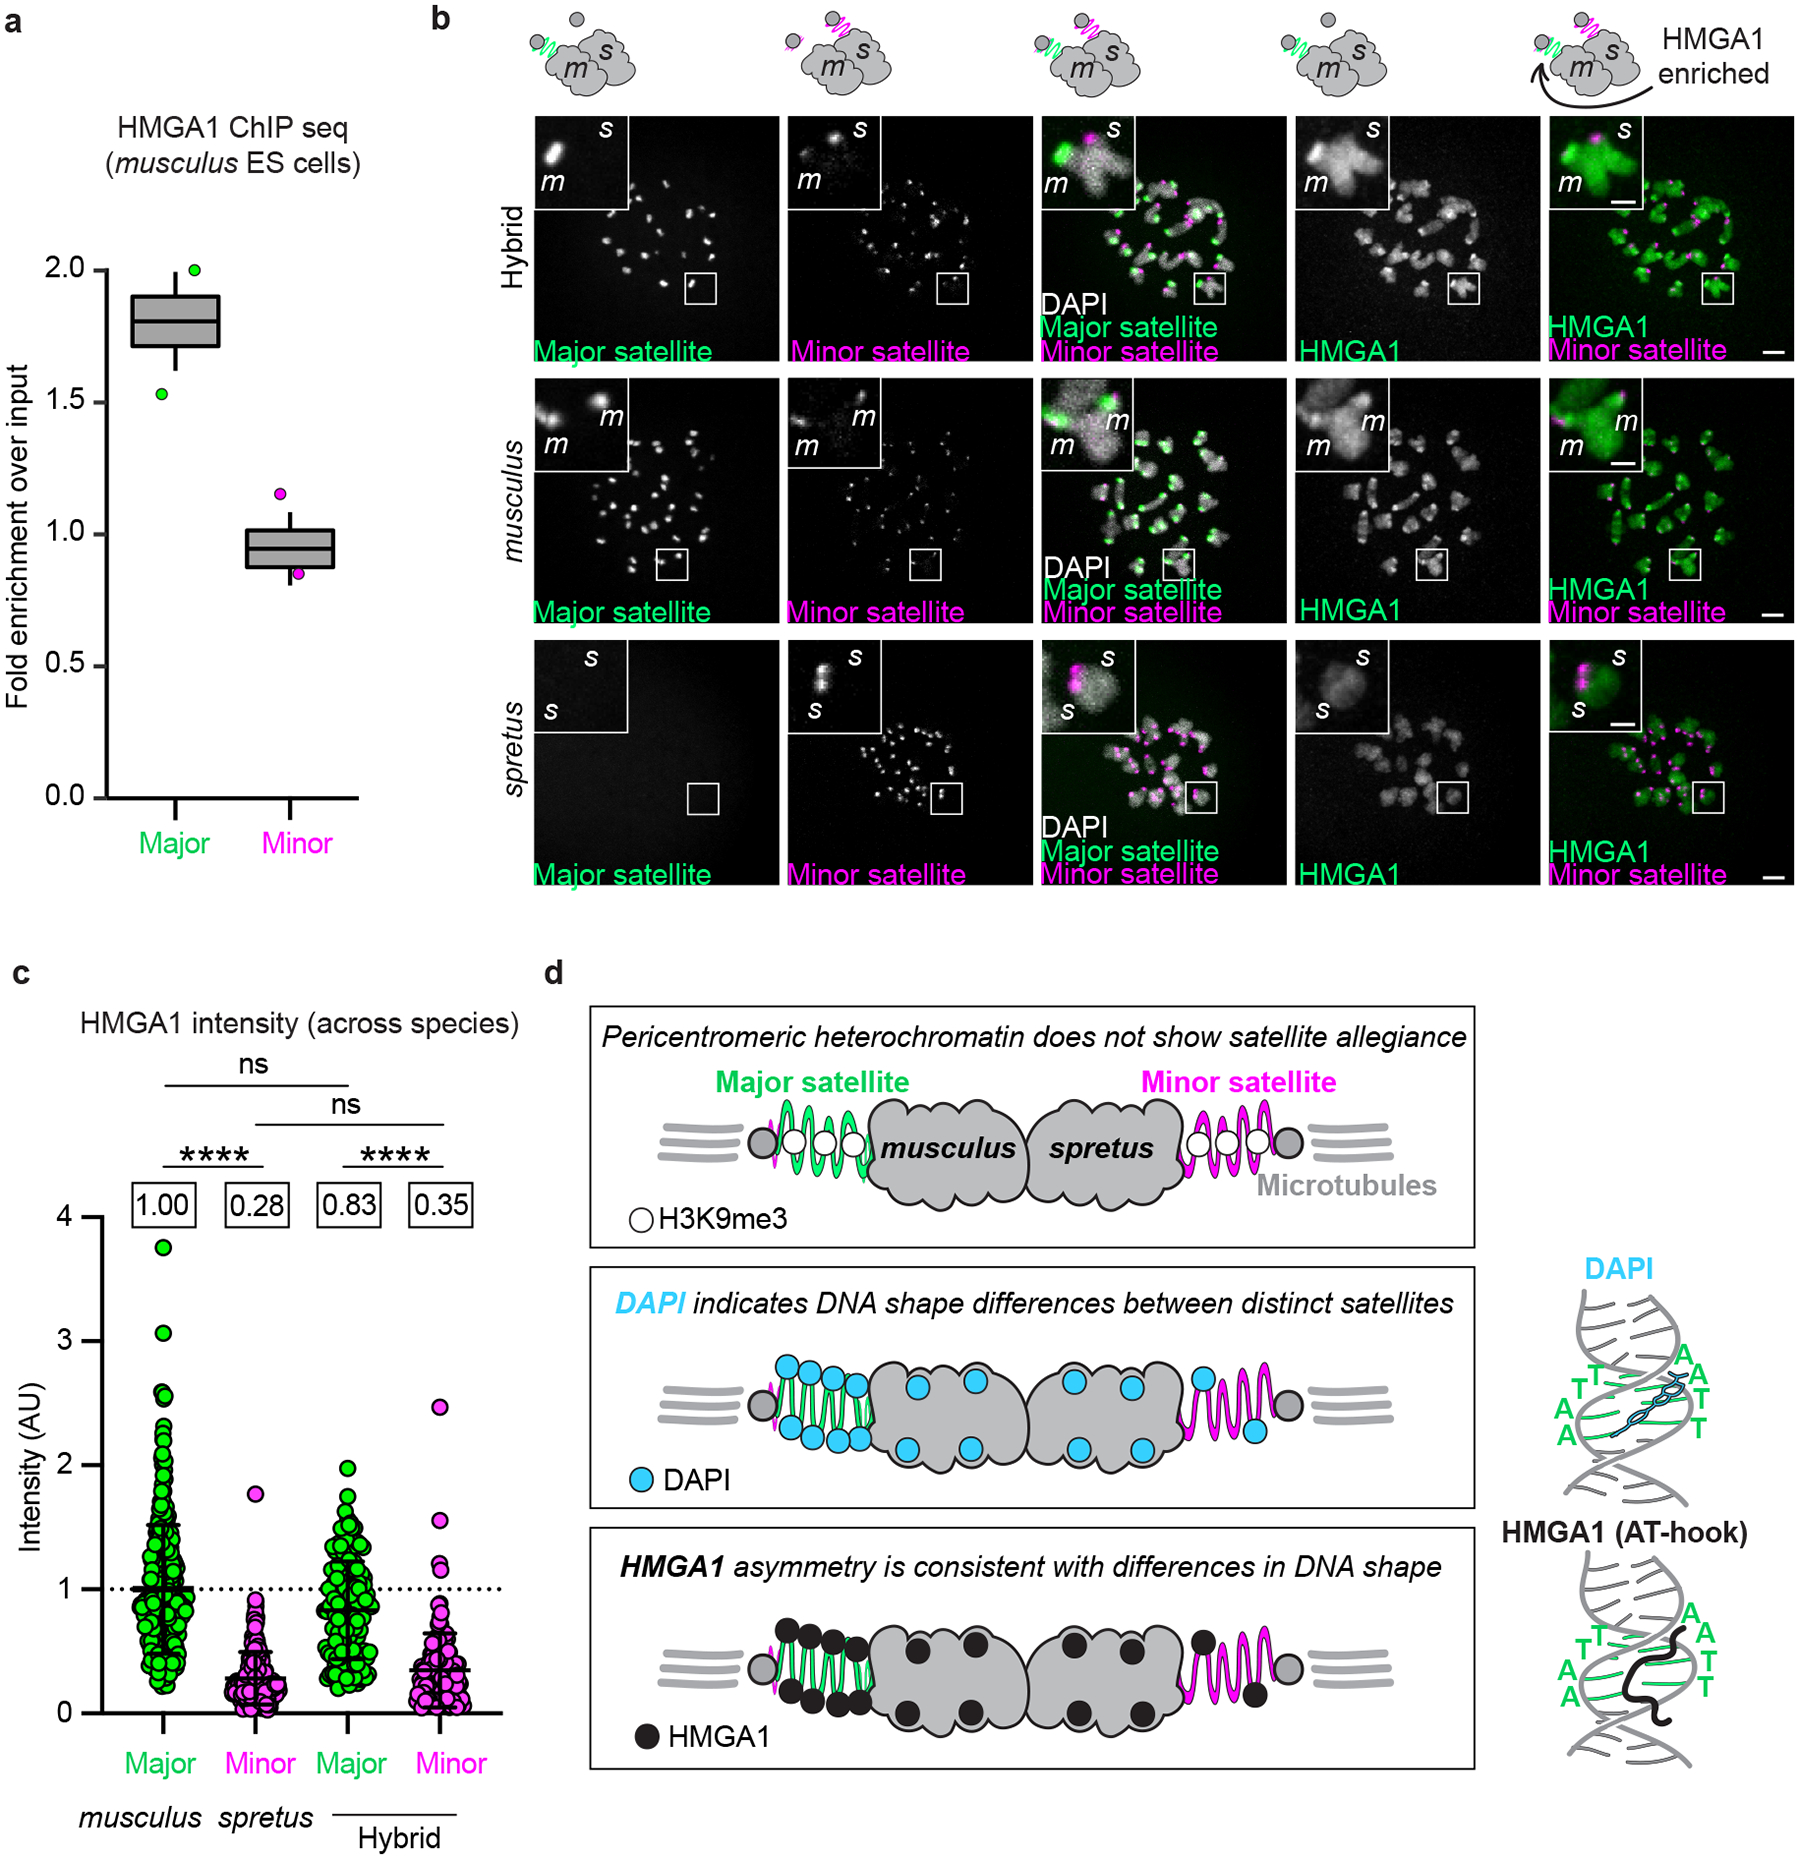
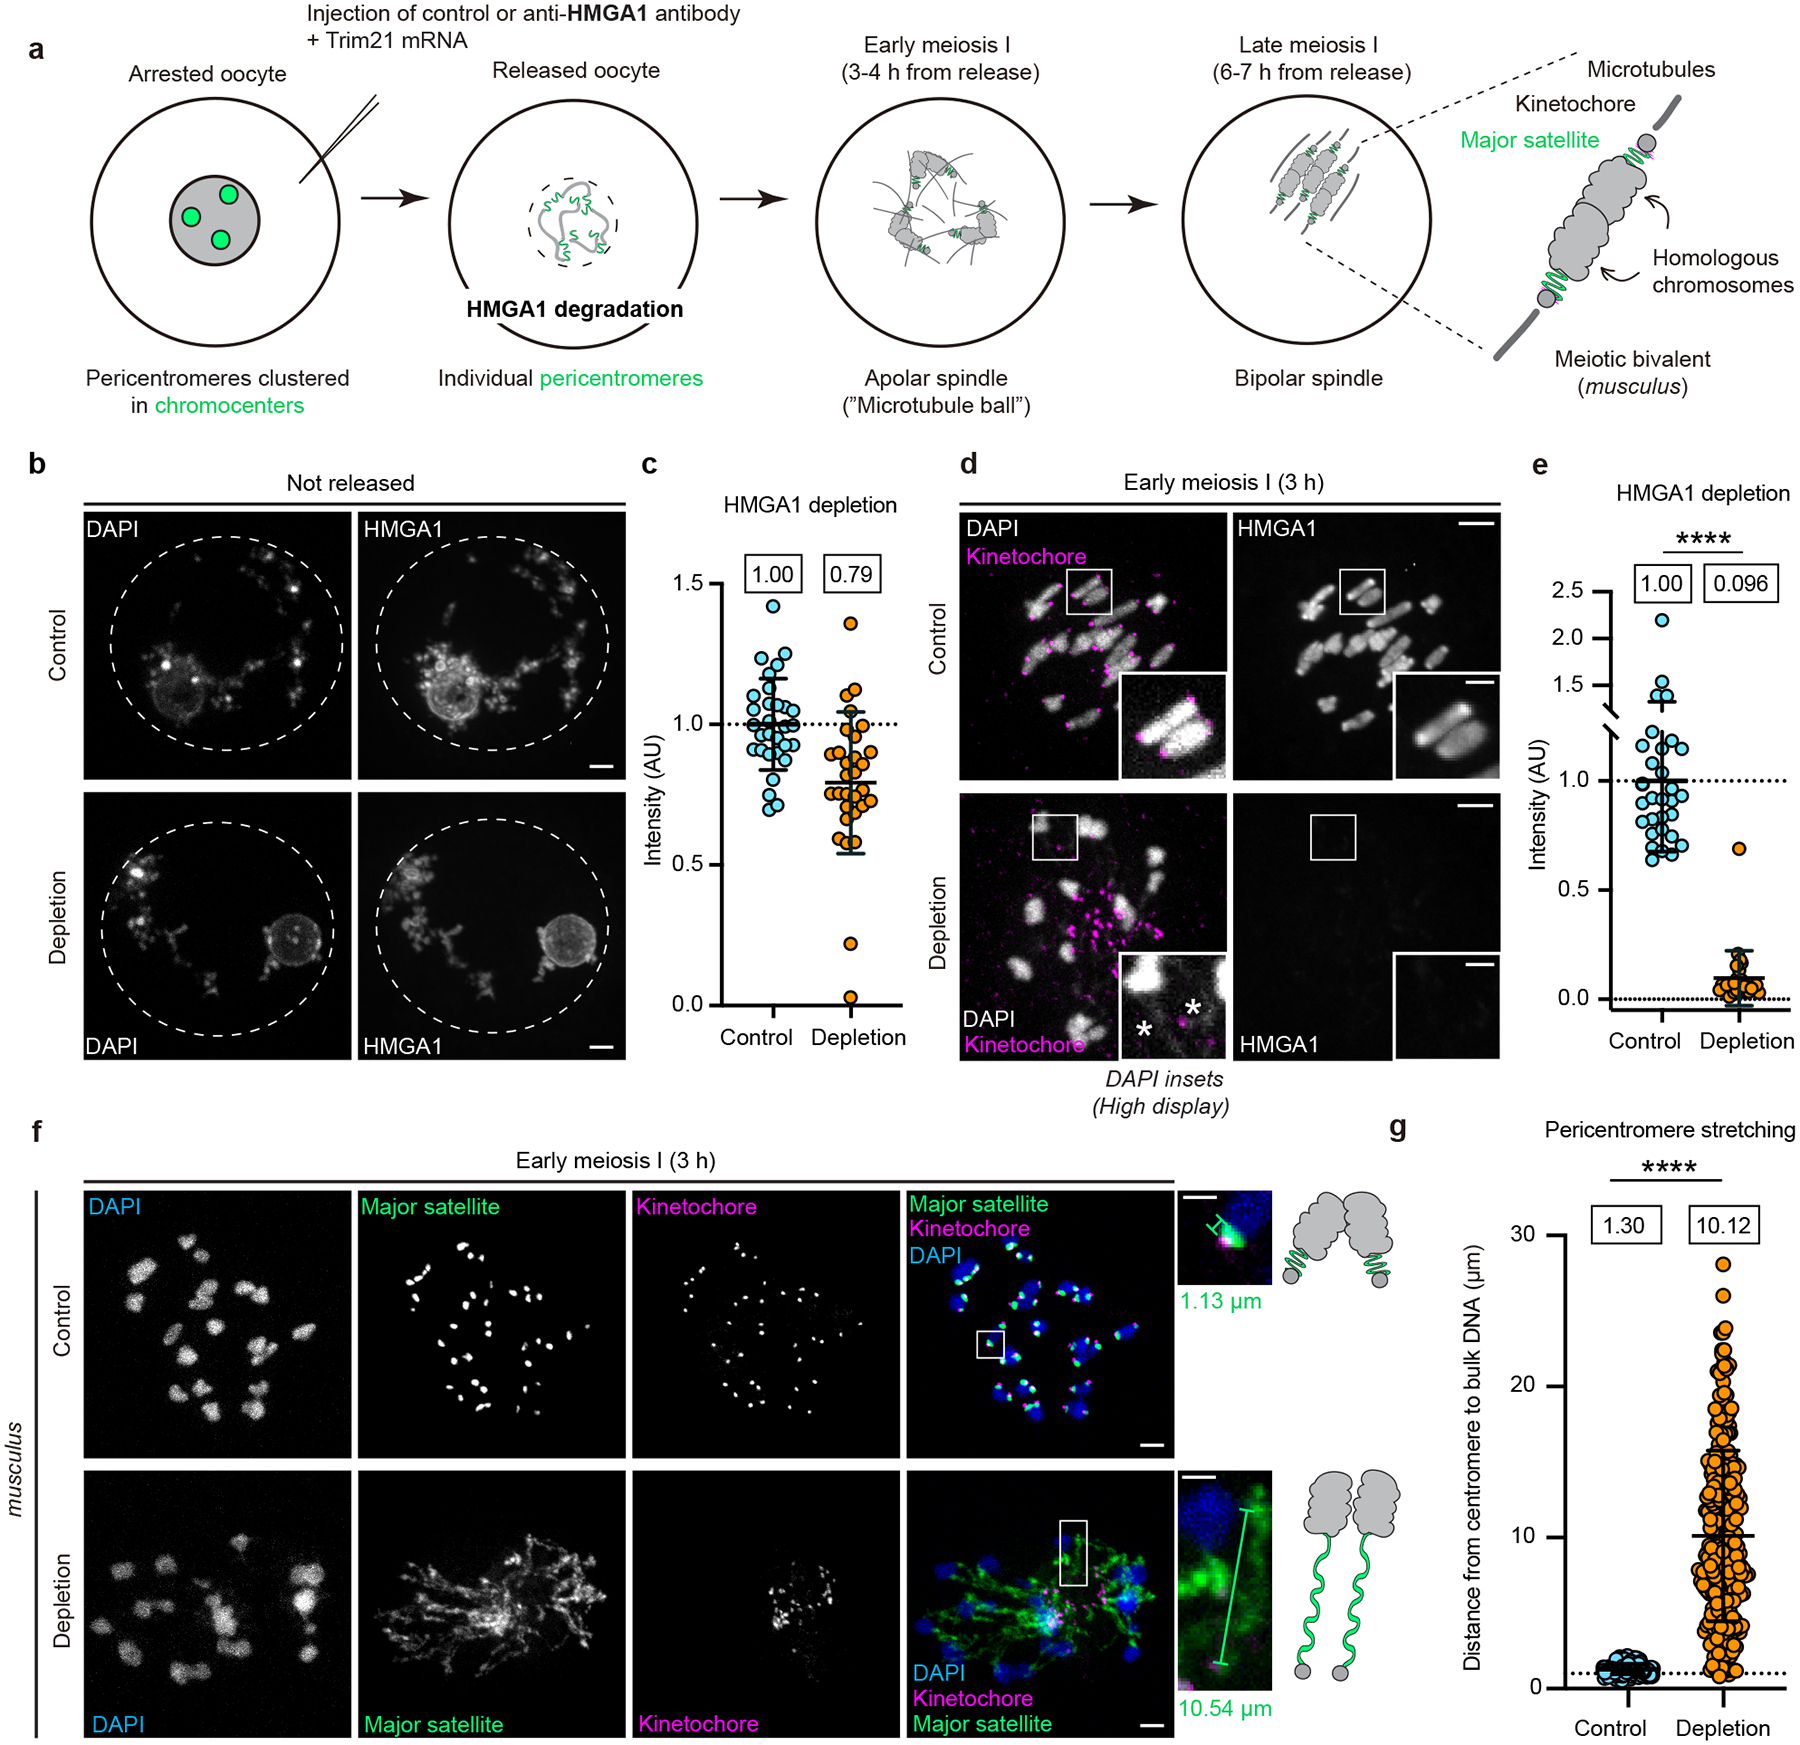
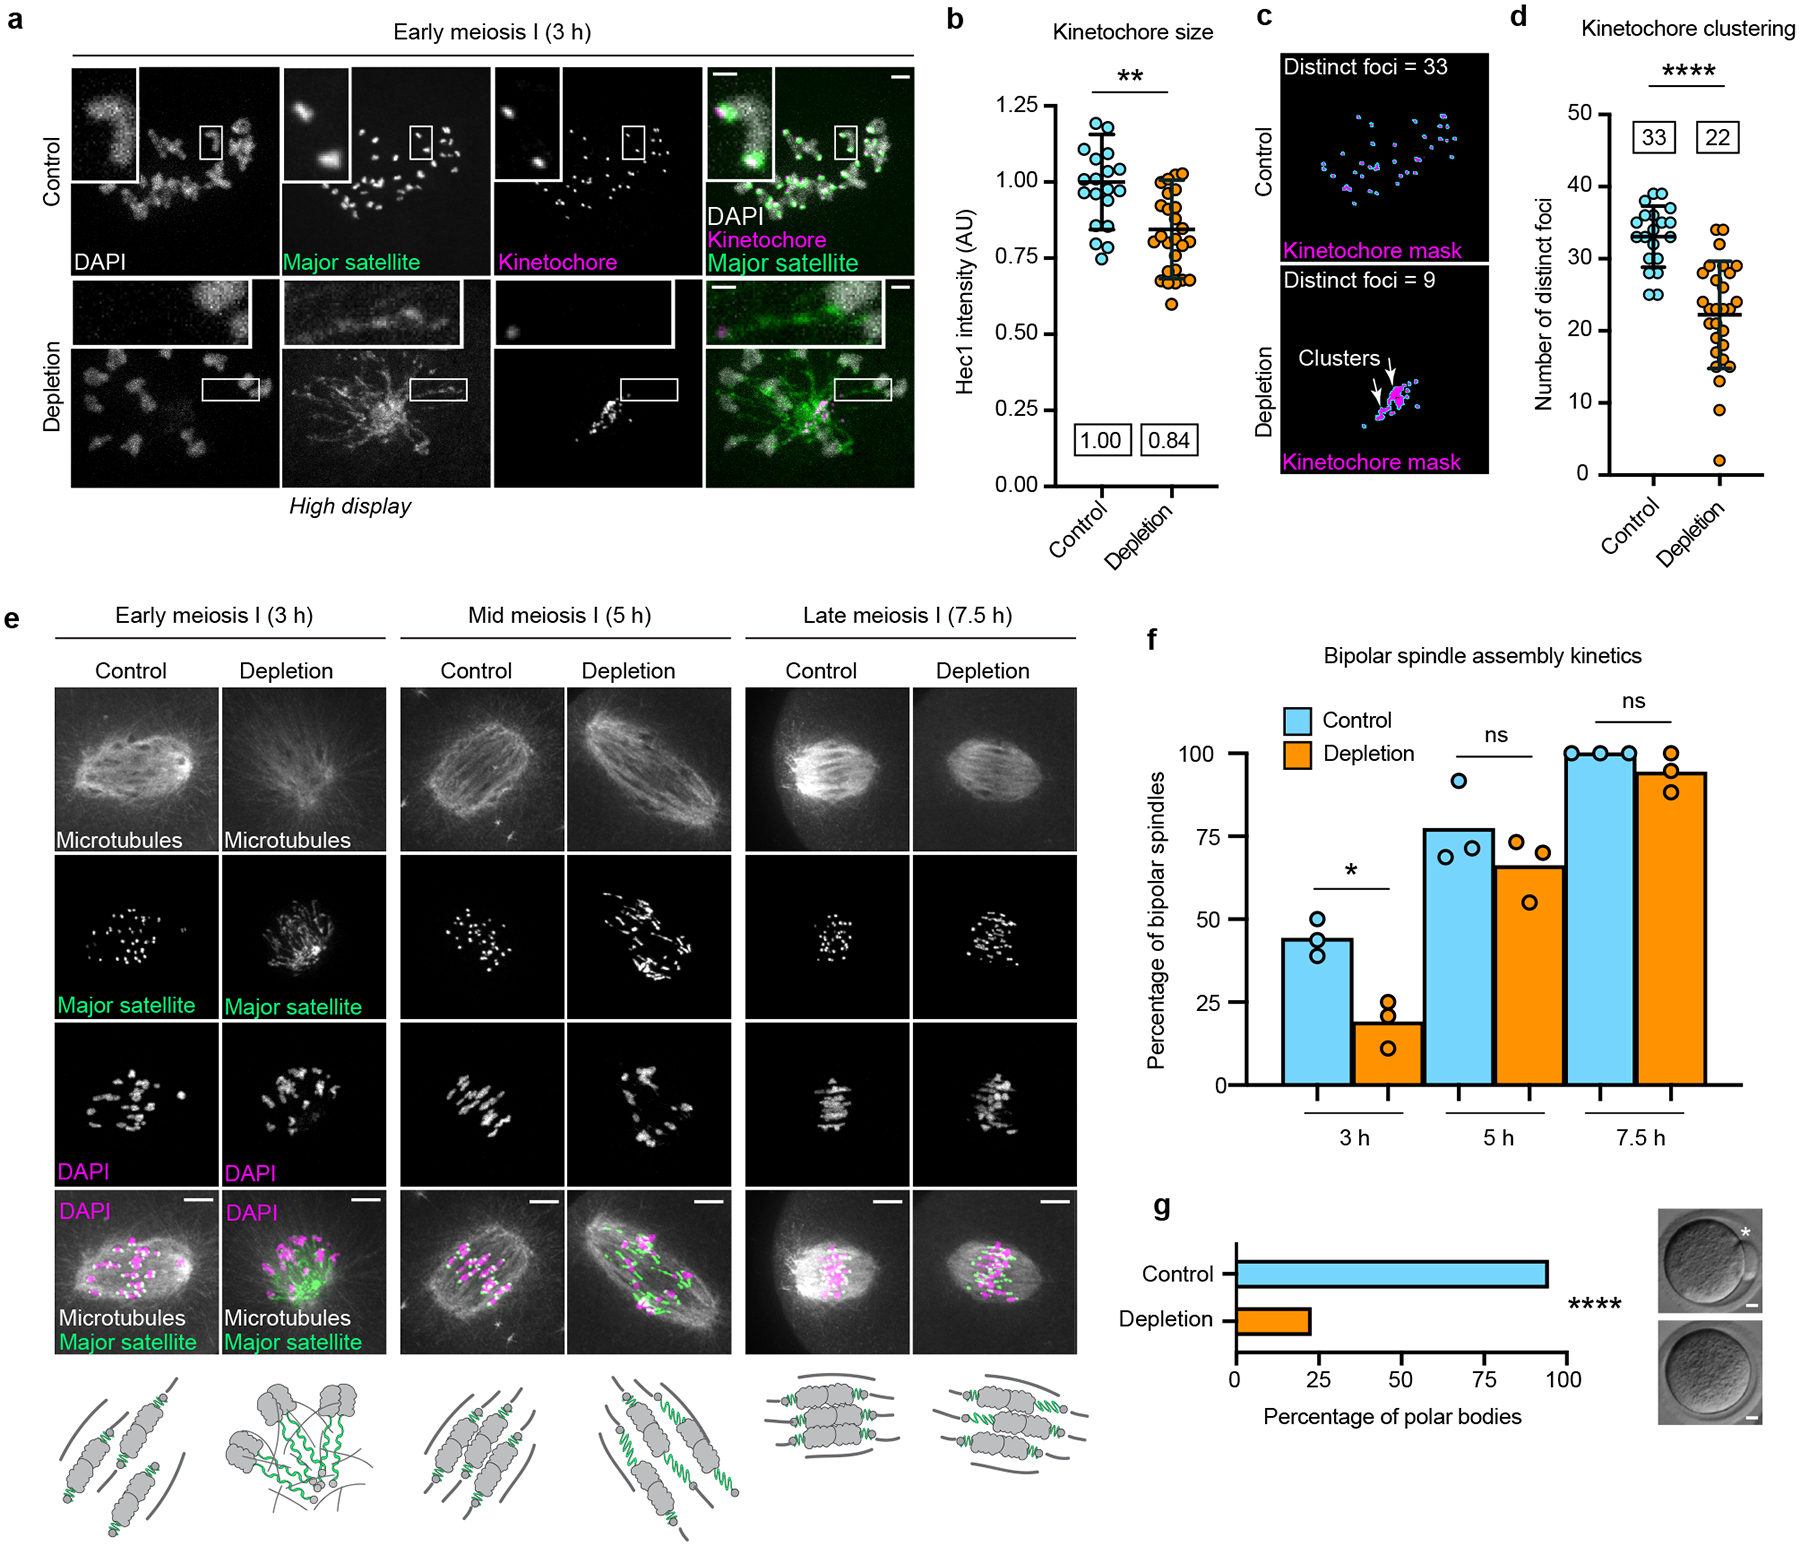
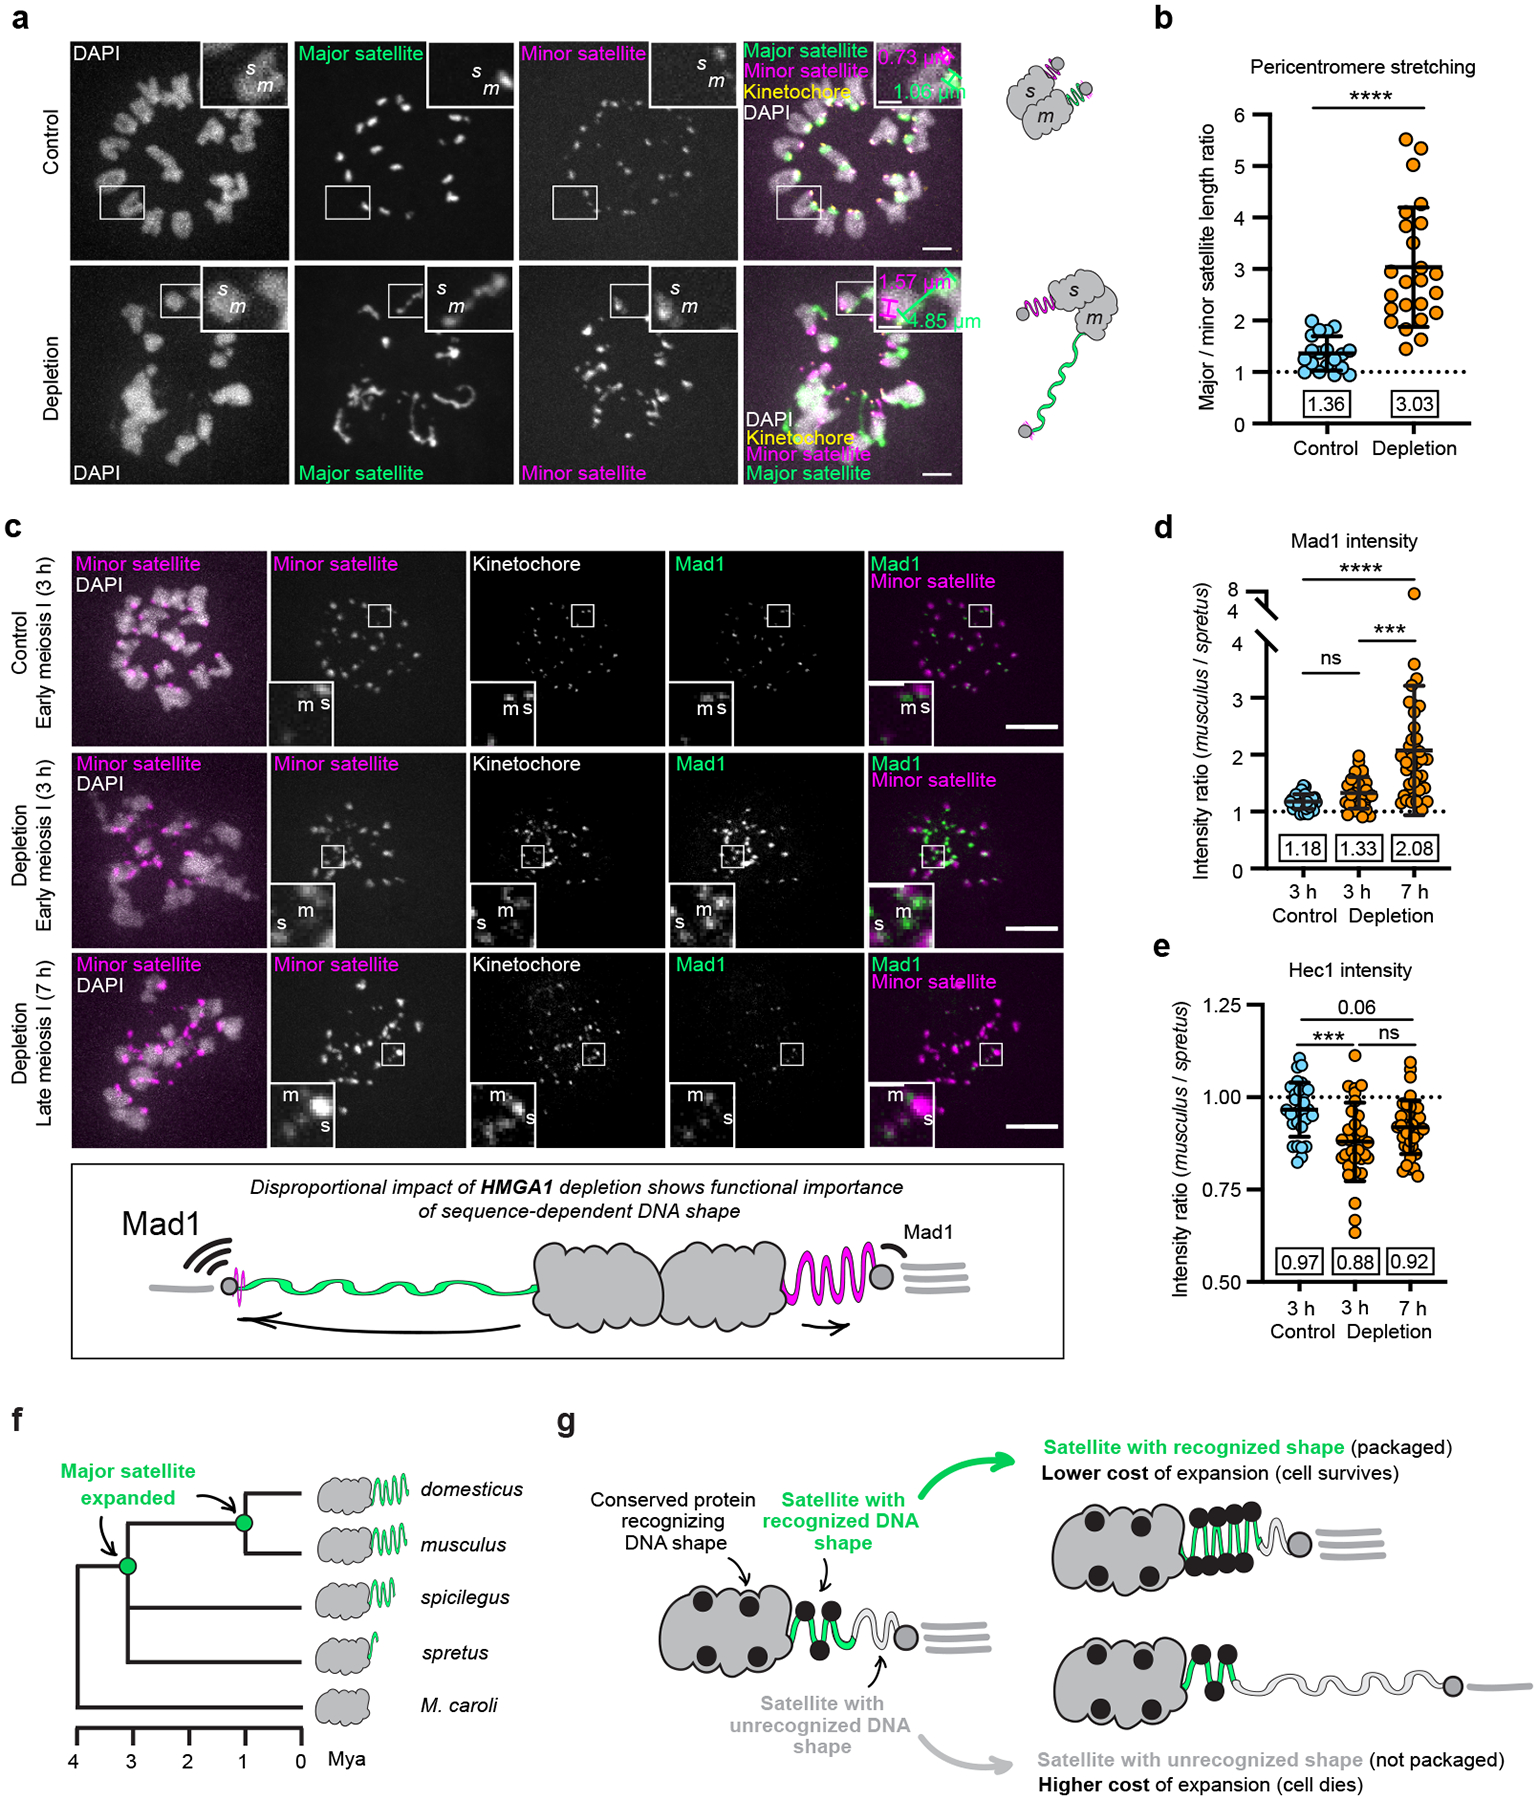
The abundance and sequence of satellite DNA at and around centromeres is evolving rapidly despite the highly conserved and essential process through which the centromere directs chromosome inheritance1-3. The impact of such rapid evolution is unclear. Here we find that sequence-dependent DNA shape dictates packaging of pericentromeric satellites in female meiosis through a conserved DNA-shape-recognizing chromatin architectural protein, high mobility group AT-hook 1 (HMGA1)4,5. Pericentromeric heterochromatin in two closely related mouse species, M. musculus and M. spretus, forms on divergent satellites that differ by both density of narrow DNA minor grooves and HMGA1 recruitment. HMGA1 binds preferentially to M. musculus satellites, and depletion in M. musculus oocytes causes massive stretching of pericentromeric satellites, disruption of kinetochore organization and delays in bipolar spindle assembly. In M. musculus × spretus hybrid oocytes, HMGA1 depletion disproportionately impairs M. musculus pericentromeres and microtubule attachment to their kinetochores. Thus, DNA shape affects both pericentromere packaging and the segregation machinery. We propose that rapid evolution of centromere and pericentromere DNA does not disrupt these essential processes when the satellites adopt DNA shapes recognized by conserved architectural proteins (such as HMGA1). By packaging these satellites, architectural proteins become part of the centromeric and pericentromeric chromatin, suggesting an evolutionary strategy that lowers the cost of megabase-scale satellite expansion.


Conflict of interest statement

Competing interests: The authors declare no competing interests.

Figures

Extended Data Fig. 1:
Extended Data Fig. 1:. Musculus and spretus harbor different amounts of major and minor satellites.
a-d, High-throughput sequencing of MNase-digested spretus or musculus chromatin. Reads were aligned to a trimer of minor satellite (a,b) or a dimer of major satellite (c,d) consensus sequences (see Methods). Histograms show distribution of reads aligning to minor (a) or major (c) satellite, with 80–100% range expanded in insets. The percent of reads that aligned with ≥ 80% identity to minor (b) or major (d) satellite is plotted as a Tukey box and whiskers plot (N=3 independent experiments). Boxplots indicate median, 25th and 75th percentiles (hinges), smallest and largest value at most 1.5 * interquartile range of the hinge (whiskers).
Extended Data Fig. 2:
Extended Data Fig. 2:. Musculus and spretus pericentromeric satellites differ in AT-rich tetranucleotides and frequencies of contiguous A/Ts.
a, Number of AT-rich tetranucleotides associated with narrow DNA minor groove per length of a single major satellite repeat (234 bp) averaged from 500 musculus major or minor satellite arrays. Note that the ten tetranucleotides with narrowest minor grooves (top, bold) are counted along representative arrays in Fig. 1i. b,c, Major (b) or minor (c) satellite consensus monomer sequences with stretches of 4 or more consecutive A/Ts shaded in grey; the 17-bp CENP-B box is underlined. d,e, Number of minimum 5 bp- (d) or 3 bp-long (e) contiguous A/T stretches in major or minor satellite arrays per 234 bp length of a single major satellite repeat). Mean and standard deviation indicated, n=500 arrays; two-tailed Mann-Whitney test, **** P<0.0001.
Extended Data Fig. 3:
Extended Data Fig. 3:. HMGA1 competes with netropsin for binding to major satellite.
a,b, Control or netropsin-treated musculus oocytes were fixed in GV stage and stained for DNA (DAPI) and HMGA1 (a). Scale bars 5 μm or 2 μm (insets). The ratio of HMGA1 signal at chromocenters to non-chromocenter chromatin was quantified (b). Mean and standard deviation indicated, means shown in boxes, n=40 (control) and 30 (netropsin) oocytes from 3 independent experiments, with an average of 3 chromocenters measured in each oocyte; two-tailed Mann-Whitney test, **** P<0.0001.
Extended Data Fig. 4:
Extended Data Fig. 4:. HMGA1 protein sequence is identical between musculus and spretus.
a,b, Alignment of musculus and spretus HMGA1 coding (a) and amino acid (b) sequences. Asterisk (a) marks a single synonymous substitution. AT hooks (RGR motifs) are shown (b) based on.
Extended Data Fig. 5:
Extended Data Fig. 5:. Kinetochores displaced from chromosome arms remain associated with centromeric chromatin.
Immunofluorescence images of control or HMGA1-depleted musculus oocytes represented in Fig. 3f. Cells were expressing Borealin tagged with the OLLAS epitope to visualize centromeric chromatin. Colocalization of Hec1 (kinetochore; magenta asterisks) and centromeric Borealin-OLLAS is shown (white asterisks). Note that Borealin also localizes to bulk chromatin. Scale bars 5 μm and 2 μm (insets). 3 independent experiments showed the same result.
Extended Data Fig. 6:
Extended Data Fig. 6:. Microtubules mediate major satellite stretching in HMGA1-depleted oocytes.
Immunofluorescence images of HMGA1-depleted musculus oocytes expressing major-satellite-targeting TALE-mClover and treated with nocodazole to depolymerize microtubules. Oocytes were fixed in early meiosis I before removing microtubules (“not treated”), during treatment (“nocodazole”), or after microtubules were allowed to regrow (“washout”). DAPI stained DNA and anti-α-tubulin antibody-stained microtubules. Scale bar 10 μm. 2 independent experiments showed the same result (17 control- and 15 nocodazole-treated oocytes). Nocodazole washout was done once in 10 oocytes, all showing the same result.
Extended Data Fig. 7:
Extended Data Fig. 7:. HMGA1 depletion disrupts microtubule organization.
a-c, Control and HMGA1-depleted musculus oocytes expressing major satellite-targeting TALE-mClover were treated with a kinesin-5 inhibitor (STLC) in early meiosis I to arrest cells before spindle bipolarization, fixed, and stained for DNA (DAPI) and microtubules (anti-α-tubulin). 2 independent experiments showed the same result. Single z-slices (a) from confocal stacks show the concentric ring formed by chromosomes and radial symmetry of the microtubule aster in control oocytes, but lack of symmetry in HMGA1-depleted oocytes. Note that major satellite signal is enhanced in HMGA1-depleted oocyte to visualize thin threads of DNA. Maximal intensity projections (b) show the entire microtubule aster and were used to automatically generate a mask around the aster ((c), green outline) using CellProfiler (see Methods). Scale bars 10 μm. Note that A and B show different cells. For control and HMGA1-depleted musculus oocytes treated with STLC, aster eccentricity was quantified on a scale of 0 (perfect circle) to 1 (straight line) ((c), mean and standard deviation indicated, means shown in boxes, n=25 (control) and 23 (depletion) oocytes from 2 independent experiments; unpaired two-tailed t-test, **** P<0.0001). d, HMGA1 packages major satellite in musculus oocytes to withstand forces exerted by microtubules and microtubule motors that pull kinetochores toward spindle poles while pushing chromosomes away from the poles. In the absence of HMGA1, major satellite-built pericentromeres lose rigidity and yield under spindle forces, resulting in stretching, kinetochore clustering, and reduction in kinetochore size. Kinetochore clustering may destabilize microtubule attachments because of proximity to Aurora A kinase at microtubule organizing centers (orange, MTOCs). Disrupted kinetochore organization may also interfere with the oocyte spindle assembly pathway dependent on PRC1 at kinetochores (purple).
Extended Data Fig. 8:
Extended Data Fig. 8:. Disproportionate impact of HMGA1 depletion on packaging of musculus and spretus pericentromeres.
a, Quantification of musculus and spretus pericentromere length in control or HMGA1-depleted hybrid musculus/spretus oocytes (means and standard deviations are indicated, means shown in boxes, n=95 (control) and 120 (depletion) pericentromeres from 2 independent experiments; Kruskal-Wallis test followed by Dunn’s multiple comparison test, **** P<0.0001, * P=0.0466). Dotted lines indicate mean musculus (green) or spretus (magenta) pericentromere length in control hybrid oocytes. These data were used to calculate major over minor satellite length ratios shown in Fig. 5b. b, Data in panel A were used to calculate the depleted over control satellite length ratios for musculus (major) or spretus (minor) pericentromeres in hybrid musculus/spretus oocytes (means and standard deviations are indicated, means shown in boxes; two-tailed Mann-Whitney test; **** P<0.0001). c,d, Control or HMGA1-depleted spretus oocytes were fixed in early meiosis I and stained for DNA (DAPI). Cells were expressing TALE-mClover (major satellite) and dCas9-mCherry/gRNA (minor satellite). Scale bars 5 μm or 2 μm (insets). Pericentromere stretching was quantified as the longest axis of minor satellite signal. Mean and standard deviation indicated, means shown in boxes, n=17 (control) and 16 (depletion) spretus oocytes from 2 independent experiments, up to 20 pericentromeres per satellite measured in each oocyte; two-tailed Mann-Whitney test, **** P<0.0001. Note that some pericentromeres were displaced from bulk chromatin without detectable minor satellite stretching (asterisk).
Extended Data Fig. 9:
Extended Data Fig. 9:. Disproportionate impact of HMGA1 depletion on musculus and spretus kinetochores.
a-f, Mad1 (a-c) or Hec1 (d-f) signal intensities from Fig. 5d,e plotted as paired measurements in hybrid musculus/spretus oocytes in early meiosis I ((a,d) – control; (b,e) – HMGA1 depleted) or in late meiosis I ((c,f) – HMGA1 depleted) (n=30 (3 h, control), 31 (3 h, depletion) and 38 (7 h, depletion) hybrid oocytes from 2 independent experiments; paired two-tailed t-test, ****P<0.0001; **P=0.0039). Each pair of measurements (connected by a line) represents a single cell. Control oocytes in late meiosis I were not quantified due to the lack of Mad1 signal. Note that musculus kinetochores harbor marginally more Mad1 than spretus in control early meiosis I, but musculus kinetochores are marginally smaller than spretus.
Fig. 1:
Fig. 1:. Pericentromeric satellites of two closely related mouse species adopt distinct DNA shapes.
a, Organization of minor and major satellite DNA in musculus and spretus. b,c, CENP-A or H3K9me3 ChIP results from MNase-digested spretus (b) or musculus (c) chromatin isolated from liver samples. Fold enrichment was calculated as the fraction of reads that align to major or minor satellite (>80% sequence identity) in the ChIP sample divided by the fraction in the input sample (Tukey box and whiskers plots, N=3 independent experiments except musculus H3K9me3 ChIP (N=1)). d,e, Musculus/spretus hybrid oocytes expressing TALE-mClover (major satellite) and dCas9-mCherry/gRNA (minor satellite) fixed at metaphase I and stained for H3K9me3. The H3K9me3 ratio at pericentromeres (musculus/spretus) for each bivalent ((e), n=95 bivalents from 2 independent experiments; blue line, median). f, Spretus and musculus liver nuclei stained for H3K9me3, and FISH was performed with probes against CENP-B boxes (minor satellite). 14 cells per condition from 2 independent experiments yielded similar result. g,h, Spretus and musculus liver nuclei stained for DNA (SYTOX Green and DAPI) and centromeres (anti-centromere antibody). The Pearson’s correlation coefficient was calculated for nuclear SYTOX Green and DAPI ((h) n=16 and 17 nuclei). i, AT-rich tetranucleotides associated with narrow DNA minor groove along representative musculus major or minor satellite arrays represented side-by-side. j,k, Consensus major satellite monomer (green, left) or minor satellite dimers (magenta, right) with stretches of minimum 4 contiguous A/Ts. Despite similar A/T content (63–66%) major and minor satellites differ in how clustered the A/T bases are. l, Number of contiguous A/T in major or minor satellite arrays per 234 bp (single major satellite repeat length). Mean and standard deviation indicated, n=500 arrays; two-tailed Mann-Whitney test, **** P<0.0001. All boxplots indicate: median, 25th and 75th percentiles (hinges), smallest and largest value at most 1.5 * interquartile range of the hinge (whiskers). All scale bars 10 μm and 1 μm (insets).
Fig. 2:
Fig. 2:. HMGA1 is enriched at pericentromeres built on major satellite.
a, Previously published HMGA1 ChIP-sequencing data was analyzed to calculate fold enrichment as the fraction of reads that align to major or minor satellite (>80% sequence identity) in the ChIP sample divided by the fraction in the input sample (Tukey box and whiskers plots, N=2 independent experiments for each). Boxplots indicate median, 25th and 75th percentiles (hinges), smallest and largest value at most 1.5 * interquartile range of the hinge (whiskers). b,c, Hybrid musculus/spretus and parental musculus and spretus oocytes expressing TALE-mClover targeting major satellite and dCas9-mCherry in complex with guide RNA targeting minor satellite were fixed and stained for HMGA1. Scale bars 5 μm or 2 μm (insets). HMGA1 signal was quantified at major and minor satellites representing musculus (m) or spretus (s) pericentromeres. Mean and standard deviation indicated, means shown in boxes, n=284 (major satellite in musculus), 194 (minor satellite in spretus), 144 (major satellite in hybrid), and 144 (minor satellite in hybrid) pericentromeres from 2–3 independent experiments; Kruskal-Wallis test followed by Dunn’s multiple comparison test, **** P<0.0001, ns=not significant (P=0.1059; major satellite in musculus vs hybrid, P=0.4159; minor satellite in spretus vs hybrid). d, While both major and minor satellites can form pericentromeric heterochromatin, major satellite has higher density of narrow DNA minor grooves as shown by asymmetric DAPI staining. HMGA1 preferentially binds to narrow DNA minor grooves via a mechanism similar to DAPI binding and is therefore enriched on major satellite. Drawings of DNA molecule with DAPI and HMGA1 AT-hook were based on PDB: 5T4W and 2EZF respectively.
Fig. 3:
Fig. 3:. HMGA1 packages pericentromeres in female meiosis.
a, Schematic of meiosis I in musculus oocytes from milrinone-induced G2/prophase arrest to bipolar spindle assembly. HMGA1 is depleted after release when the nuclear envelope breaks down and anti-HMGA1 antibody and Trim21 can access condensing chromosomes (see Methods for details). Major satellite is marked in green. b,c, Arrested musculus oocytes were injected with Trim21 mRNA and anti-HMGA1 (or control) antibodies, incubated for 6 h to allow Trim21 expression, then fixed and stained for DNA (DAPI) and HMGA1. Images (b) show nuclei outlined by dashed line. HMGA1 intensity was quantified ((c), mean and standard deviation indicated, means shown in boxes, n=30 oocytes per condition from 2 independent experiments). d,e, Musculus oocytes were injected with Trim21 mRNA and anti-HMGA1 (or control) antibodies, incubated for 3 h, released from arrest, fixed 3 h later (6 h post injection), and stained for DNA (DNA), HMGA1, and the kinetochore protein Hec1. Asterisks (d) show DNA threads connecting chromosome arms with kinetochores. DAPI signal is enhanced in the insets to visualize thin threads of DNA. HMGA1 intensity was quantified ((e), mean and standard deviation indicated, means shown in boxes, n=30 (control) and 28 (depletion) oocytes from 2 independent experiments; two-tailed Mann-Whitney test, **** P<0.0001). f,g, Control or HMGA1-depleted musculus oocytes expressing TALE-mClover targeting major satellite were fixed in early meiosis I and stained for DNA (DAPI) and Hec1. Insets (f) show differences in major satellite length (green bars). Pericentromere stretching was quantified as the length of major satellite connecting a kinetochore to bulk DNA ((g), mean and standard deviation indicated, means shown in boxes, n=240 (control) and 270 (depletion) pericentromeres from 48 (control) and 54 (depletion) oocytes from 3 independent experiments; two-tailed Mann-Whitney test, **** P<0.0001). Scale bars 5 μm or 2 μm (insets).
Fig. 4:
Fig. 4:. HMGA1 depletion disrupts kinetochore organization and delays bipolar spindle assembly.
a-d, Control or HMGA1-depleted musculus oocytes expressing TALE-mClover targeting major satellite were fixed in early meiosis I and stained for DNA (DAPI) and Hec1. Scale bars 5 μm or 2 μm (insets). Major satellite signal is enhanced in the HMGA1-depleted oocyte (a) to visualize thin threads of DNA. Hec1 was quantified at individual kinetochores ((b), mean and standard deviation indicated, means shown in boxes, n=20 (control) and 27 (depletion) oocytes from 2 independent experiments; unpaired two-tailed t-test, ** P=0.0018). Kinetochore clustering was measured using Hec1 as a mask (c) and counting the number of distinct foci per cell ((d), mean and standard deviation indicated, means shown in boxes, n=20 (control) and 28 (depletion) oocytes from 2 independent experiments; unpaired two-tailed t-test, **** P<0.0001). e,f, Control or HMGA1-depleted musculus oocytes expressing TALE-mClover targeting major satellite were fixed at the indicated timepoints and stained for DNA (DAPI) and microtubules (α-tubulin). Scale bars 10 μm. Bipolar spindles were counted to quantify spindle assembly kinetics ((f), bars show means of 3 independent experiments, n=50 (3 h, control), 62 (3 h, depletion), 42 (5 h, control), 55 (5 h, depletion), 36 (7.5 h, control) and 57 (7.5 h, depletion) oocytes; ordinary one-way ANOVA followed by Tukey’s multiple comparison test, * P=0.0187 (3 h), ns=not significant (P=0.5306 (5 h) and P=0.9428 (7.5 h)). g, Control or HMGA1-depleted musculus oocytes were cultured until metaphase of meiosis II. Representative images show a polar body (control; white asterisk) or lack thereof (HMGA1-depleted). Frequency of polar body extrusion was quantified (n=60 oocytes per condition from 2 independent experiments; Fisher’s exact two-sided test, **** P<0.0001). Scale bar 10 μm.
Fig. 5:
Fig. 5:. HMGA1 depletion disproportionately disrupts musculus pericentromeres.
a,b, Control or HMGA1-depleted musculus/spretus hybrid oocytes were fixed in early meiosis I and stained for DNA (DAPI) and kinetochore (Hec1). Cells were expressing TALE-mClover (major satellite) and dCas9-mCherry/gRNA (minor satellite). Scale bars 5 μm or 2 μm (insets). The ratio of musculus/spretus pericentromere stretching was quantified as major satellite length/minor satellite length ((b), mean and standard deviation indicated, means shown in boxes, n=19 (control) and 24 (depletion) hybrid oocytes from 2 independent experiments, 5 pericentromeres per species measured per oocyte; unpaired two-tailed t-test, **** P<0.0001). c-e, Control or HMGA1-depleted musculus/spretus hybrid oocytes were fixed in early or late meiosis I and stained for DNA (DAPI) and kinetochore (Hec1). Cells were expressing Mad1-2xGFP and dCas9-mCherry/gRNA (minor satellite). Scale bars 10 μm or 2 μm (insets). Unattached kinetochores (d) and kinetochore size (e) were quantified as a ratio between average Mad1 or Hec1 signal at musculus and spretus kinetochores (mean and standard deviation indicated, means shown in boxes, n=30 (3 h, control), 31 (3 h, depletion) and 38 (7 h, depletion) hybrid oocytes from 2 independent experiments, at least 17 kinetochores quantified per oocyte; ordinary one-way ANOVA test followed by Tukey’s multiple comparison test, **** P<0.0001, *** P=0.0001 (Mad1), *** P=0.0004 (Hec1), ns=not significant (P=0.6906 (Mad1) and P=0.1402 (Hec1 3 h vs 7 h depletion)). f, Expansion of major satellite (green) along the musculus lineage. g, Different satellite have distinct DNA shapes. A satellite recognized by existing packaging proteins can be efficiently packaged and expand within the genome without severe fitness costs. Conversely, a satellite that is not recognized is not packaged, leading to a fitness cost of expansion. Note that this model does not predict that DNA shape-mediated mechanisms evolved to promote satellite expansion but rather that satellites co-opt existing mechanisms that evolved to bind other parts of the genome.

Similar articles

Cited by

References

    1. Henikoff S, Ahmad K & Malik HS The centromere paradox: stable inheritance with rapidly evolving DNA. Science 293, 1098–1102 (2001). - PubMed
    1. Altemose N et al. Complete genomic and epigenetic maps of human centromeres. Science 376, eabl4178 (2022). - PMC - PubMed
    1. Logsdon GA et al. The variation and evolution of complete human centromeres. Nature 629, 136–145 (2024). - PMC - PubMed
    1. Strauss F & Varshavsky A A protein binds to a satellite DNA repeat at three specific sites that would be brought into mutual proximity by DNA folding in the nucleosome. Cell 37, 889–901 (1984). - PubMed
    1. Vogel B, Loschberger A, Sauer M & Hock R Cross-linking of DNA through HMGA1 suggests a DNA scaffold. Nucleic Acids Res. 39, 7124–7133 (2011). - PMC - PubMed

MeSH terms