. 2025 Feb;638(8049):197-205.
doi: 10.1038/s41586-024-08383-z. Epub 2025 Jan 8.

A rare PRIMER cell state in plant immunity

Affiliations

A rare PRIMER cell state in plant immunity

Tatsuya Nobori et al. Nature. 2025 Feb.

Abstract

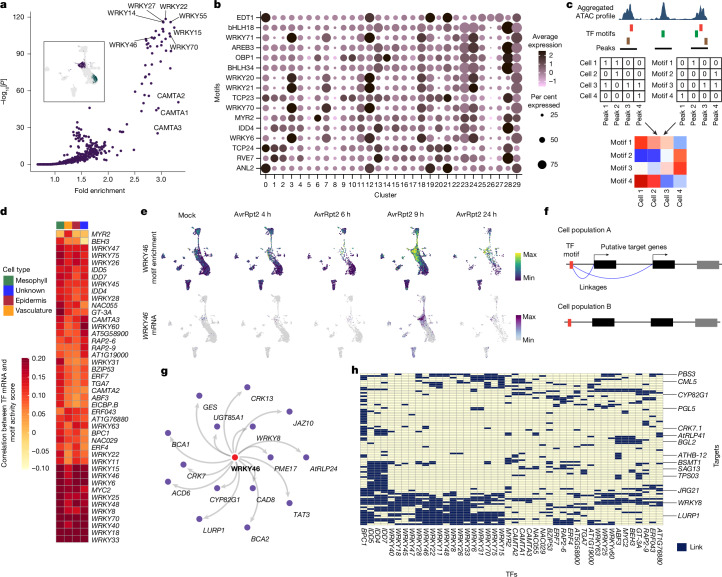
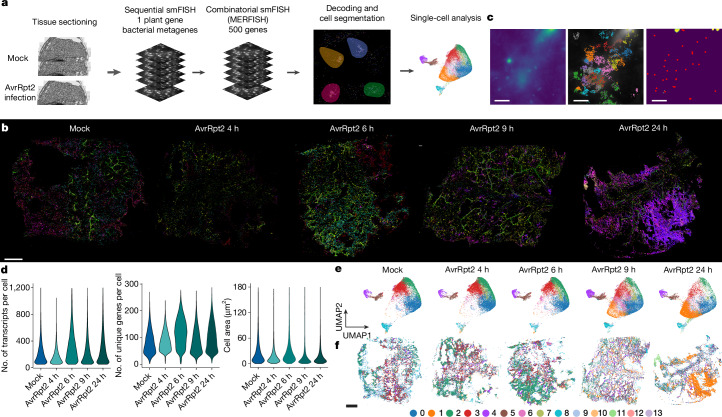
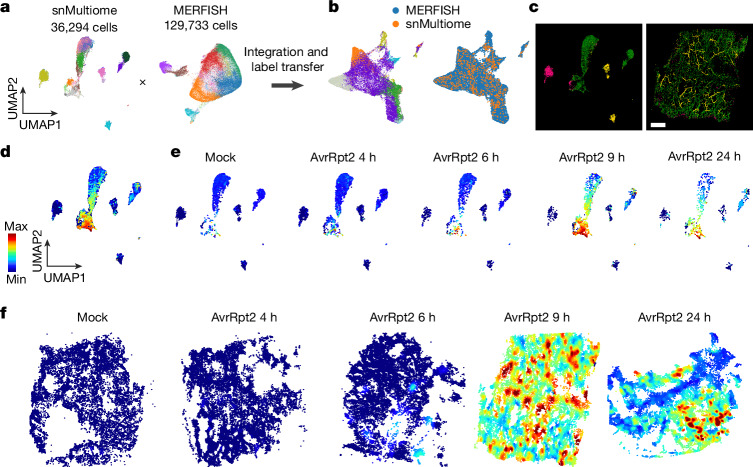
Plants lack specialized and mobile immune cells. Consequently, any cell type that encounters pathogens must mount immune responses and communicate with surrounding cells for successful defence. However, the diversity, spatial organization and function of cellular immune states in pathogen-infected plants are poorly understood1. Here we infect Arabidopsis thaliana leaves with bacterial pathogens that trigger or supress immune responses and integrate time-resolved single-cell transcriptomic, epigenomic and spatial transcriptomic data to identify cell states. We describe cell-state-specific gene-regulatory logic that involves transcription factors, putative cis-regulatory elements and target genes associated with disease and immunity. We show that a rare cell population emerges at the nexus of immune-active hotspots, which we designate as primary immune responder (PRIMER) cells. PRIMER cells have non-canonical immune signatures, exemplified by the expression and genome accessibility of a previously uncharacterized transcription factor, GT-3A, which contributes to plant immunity against bacterial pathogens. PRIMER cells are surrounded by another cell state (bystander) that activates genes for long-distance cell-to-cell immune signalling. Together, our findings suggest that interactions between these cell states propagate immune responses across the leaf. Our molecularly defined single-cell spatiotemporal atlas provides functional and regulatory insights into immune cell states in plants.


Conflict of interest statement

Competing interests: J.R.E. serves on the scientific advisory board of Zymo Research and of Cibus. The other authors declare no competing interests.

Figures

Fig. 1
Fig. 1. Identification of diverse cell states in A.thaliana leaves infected by bacterial pathogens.
a, Schematic of the time-course snMultiome analysis. b, Two-dimensional embedding of nuclei from all samples by uniform manifold approximation and projection (UMAP) based on the transcriptomic data. Nuclei are coloured according to Leiden clusters. Left, major clusters. Right, examples of subclustering of major clusters. Cell types were annotated on the basis of marker gene expression. c, GO enrichment analysis for marker genes of each major cluster (Extended Data Fig. 2a). GO terms related to defence responses are shown. Adjusted P values from a one-sided hypergeometric test followed by Benjamini–Hochberg correction are shown. See Extended Data Fig. 2d for a more comprehensive analysis. d, Heat map showing normalized pseudobulk expression of subclusters. Well-characterized defence-related genes are shown. See Extended Data Fig. 3c for a comprehensive analysis. The top bars indicate the cell type and major cluster from which each subcluster is derived from. The colour scheme for the major clusters matches with b. e, Subclustering of major cluster 6 (PCCs). Defence-related genes showing subcluster-specific expression are shown. f, Schematic of subclustering of clusters 3, 7 and 11 (immune-active mesophyll cells). g, Expression of genes involved in different steps of the biosynthesis and secretion of tryptophan-derived secondary metabolites shown in h. h, Simplified schematic of the biosynthesis and secretion of tryptophan-derived secondary metabolites. Source Data
Fig. 2
Fig. 2. Identification of TF–ACR–gene modules.
a, Scatter plot showing motif enrichment in cluster 3 (immune-active mesophyll) compared with cluster 1 (non-immune-active mesophyll). P values were calculated using a one-sided hypergeometric test. The inset shows cluster 3 (purple) and cluster 1 (green). b, Top marker motifs enriched in each cluster. c, Schematic of the motif enrichment score analysis. ChromVAR was used to generate the cell-by-motif matrix by combining the cell-by-peak (ACR) matrix and the peak-by-motif matrix. d, Heat map showing Pearson’s correlation coefficients between motif enrichment scores and mRNA expression of the corresponding TFs in each cell type (shown in the top bar). TFs with high correlation are shown. See Extended Data Fig. 6c for visualization of the full data. e, Motif enrichment scores (top) and mRNA expression (bottom) of WRKY46 in the entire snMultiome dataset. f, Schematic of target gene prediction of TF motifs. Genes that were significantly linked to any ACR containing a motif of interest were defined as putative targets. g, Predicted target genes of WRKY46. h, Putative target genes (columns) for TFs for which expression highly correlated with motif activity score (rows). Dark boxes indicate predicted regulatory links. Source Data
Fig. 3
Fig. 3. Time-resolved spatial transcriptomics in pathogen-infected leaves.
a, Schematic of the MERFISH experiments. n = 1 for each condition. See Methods for detailed procedures. b, Two-dimensional plots of transcripts for 16 selected genes (Supplementary Table 1) detected using MERFISH in each sample. Plots with transcripts for all 500 genes are provided in Extended Data Fig. 7b. c, Left, a representative field of view (FOV) that shows obscure signalling of DAPI-stained nuclei. Middle, transcript-based segmentation in the same FOV (Methods). Transcripts were coloured on the basis of assigned cells. Right, centroids of cells detected using the transcript-based segmentation method (red dots) and the result of failed DAPI-staining-based segmentation (yellow region). Similar patterns were observed across FOVs and samples. A systematic quantitative analysis is provided in Extended Data Fig. 7f. d, Violin plots showing the number of transcripts per cell (left) and unique genes per cell (middle) detected in each MERFISH sample and the area size per cell (right). e, UMAP embeddings of cells in each sample based on the expression of 500 genes detected using MERFISH. All MERFISH samples are integrated, and cells are coloured on the basis of de novo Leiden clusters. f, Spatial mapping of Leiden clusters in each sample using the same colour scheme as in e. Scale bar, 40 µm (c) or 1 mm (b,f).
Fig. 4
Fig. 4. Integration of snMultiome and spatial transcriptome data.
a, Integration of snMultiome data (mock infected and AvrRpt2 infected; five samples in total) and the MERFISH data shown in a UMAP. b, Integrated UMAP. Left, nuclei and cells are coloured on the basis of cluster labels, which were transferred from snRNA-seq to MERFISH (Methods). Right, the same integrated UMAP coloured by assay types. c, Left, UMAP of snMultiome data coloured on the basis of major cell types: epidermis (magenta), mesophyll (green) and vasculature (yellow). Right, spatial mapping of snMultiome cells coloured on the basis of major cell types. AvrRpt2 9 h.p.i. sample was used. Scale bar, 1 mm. d, Pseudotime values calculated for mesophyll cells in the snRNA-seq data. e, UMAP plots showing pseudotime values in cells from each time point. f, Spatial mapping of pseudotime values based on data integration and label transfer.
Fig. 5
Fig. 5. Identification and functional characterization of immune-cell populations.
a, MERFISH-analysed genes showing significant changes in expression across the pseudotime trajectory (Fig. 4f) in an AvrRpt2 9 h.p.i. sample. Positive fold change values indicate higher expression in cells with high pseudotime values. Top differentially expressed genes (DEGs; P < 1 × 10–8) are labelled in red. bd, Spatial expression of ALD1, FMO1 and BON3 at 9 h.p.i. (b) and cropped images of two different locations in b (c and d). e, Expression of ALD1, FMO1 and BON3 in immune-active subclusters from snRNA-seq data. fh, mRNA expression (f), MERFISH images (g) and motif activity (h) of GT-3A in immune-active mesophyll cells in the snMultiome data. BON3 expression is also shown in g. i, Enriched motifs linked to genes enriched in PRIMER or bystander cells. j, Venn diagram showing overlapping of genes highly expressed in PRIMER or bystander cells with genes previously shown to be suppressed by CAMTA3 (ref. ). k, Bulk RNA-seq of wild-type (WT) plants and GT-3A-ox plants treated with water (M) or DC3000 (DC) at 24 h.p.i. DEGs (adjusted P < 0.05, |log2-adjusted fold change | > 1) between WT and GT-3A-ox after infection are shown. GO terms enriched in specific gene sets are shown with adjusted P values. Three replicates per condition. l,m, Growth of DC3000 (l) or AvrRpt2 (m) in Col-0 (WT) plants compared with GT-3A-ox plants (l) and gt3a-KO plants (m) at indicated times. n = 24 (l) and n = 32 (m) leaves from 3 and 4 independent experiments, respectively. RLU, relative light unit. km, Pathogens were syringe-infiltrated at a suspension dose of OD600 = 0.001. Adjusted P values were calculated using two-tailed Student’s t-test with Benjamini–Hochberg correction. l,m, Results are shown as box plots, in which boxes represent the 25th–75th percentiles, the centre line indicates the median, and whiskers extend to minimum and maximum values within 1.5 times the interquartile range. n, Proposed model for the potential role and regulation of immune-cell states. Scale bar, 100 µm (c,d), 200 µm (g) or 1 mm (b). Source Data
Extended Data Fig. 1
Extended Data Fig. 1. Quality control of snMultiome data.
a, Violin plots showing transcripts per nucleus, genes per nucleus, ATAC reads per nucleus, and accessible chromatin regions (ACRs) per nucleus in each sample. b, The number of cells per sample. Two independent replicates were analyzed and combined for Mock and AvrRpt2 9 hpi conditions. c, Density scatterplots showing fraction reads in peaks (FRiP) score in each sample before cell filtering. x-axis: log10 transformed read depths. y-axis: fraction of Tn5 integration sites in ACRs. d, Density scatterplots of log10 transformed read depths (x-axis) by the fraction of Tn5 integration sites mapping to within 2 kb upstream and 1 kb downstream of transcription start sites (TSSs) (y-axis). Data in each sample before cell filtering is shown. c-d, Two replicates of Mock and AvrRpt2 9 h conditions were combined. e, Bar plot showing the number of ATAC-seq peaks identified in previous bulk ATAC-seq data and the present snATAC-seq data. Shared and assay unique peaks are shown in blue and red, respectively. f, Sample-aggregated chromatin accessibility around ACTIN2 (left) and ICS1 (right). g, Principle component analysis of pseudobulk transcriptome of each sample. Independent replicates of Mock and AvrRpt2 9 h were labeled. h, Scatter plots comparing pseudobulk transcriptomes of Mock and AvrRpt2 9 h samples. Pearson’s correlation coefficient values were shown. i, Stacked bar plots showing the representation of gene expression-based Leiden clusters in each sample. j, Two-dimensional embedding of chromatin accessibility similarity among nuclei from all samples with uniform manifold approximation and projection (UMAP). Nuclei are colored by Leiden clusters. k, UMAP embeddings based on a joint neighbor graph that represents both gene expression and chromatin accessibility measurements. Nuclei are colored by de novo Leiden clusters based on the joint analysis (left) and Leiden clusters defined by gene expression measurement alone (right; Fig. 1b). Source Data
Extended Data Fig. 2
Extended Data Fig. 2. Single-cell analysis of gene expression and chromatin accessibility.
a, Dot plot showing the top marker genes of individual clusters. b, Cluster-aggregated chromatin accessibility surrounding FDH, a known marker gene for leaf epidermis. c, UMAP plot showing the ATAC-seq count on a peak near FDH (chromosome 2, position 11172821-11173529) in each nucleus. d, GO enrichment analysis for marker genes of each cluster. e, Expression of ICS1 mRNA in each nucleus in each sample. Adjusted p-values from a one-sided hypergeometric test followed by Benjamini-Hochberg correction are shown. Source Data
Extended Data Fig. 3
Extended Data Fig. 3. Comprehensive characterization of distinct cell populations.
a, Heatmap showing pair-wise correlation of pseudobulk transcriptomes between sub-clusters of individual clusters. The top and side bars show major cluster labels. b, (Left) Schematic workflow for the selection of highly variable immune-related genes. First, genes that are significantly enriched in at least one of major or sub clusters were selected. Then, these genes were clustered based on pseudobulk expression of sub-clusters using k-mean clustering (k value was determined by the elbow method), followed by GO enrichment analysis of each k-mean cluster. Finally, gene clusters with enriched immunity-related GO terms were selected. (Right) Top GO terms enriched in 12 k-mean clusters. Clusters 1, 2, and 10 were selected as immune genes. c, Heatmap showing normalized expression of immune-related genes selected in (b) across all the sub clusters. The top bars indicate cell type and major cluster that each sub-cluster derived from. d, Expression of the phloem companion cell markers SUC2 and FTIP1. e, Expression of ALD1 and FMO1. f, Expression of ILL6 upon infection of AvrRpt2 in time course, showing specific induction in cluster 6. g, Expression of genes specifically expressed in sub-cluster 6-8. h, Heatmap showing expression of immune-related genes shown in Fig. 1d in a previous time-course bulk RNA-seq study, where A. thaliana leaves were infected by DC3000, AvrRpt2, or AvrRpm1 or treated with mock control (water). These data do not capture the presence of various cell populations identified in Fig. 1d. i, Scatter plots showing the correlation between CRK12 and CRK41 in the time course bulk RNA-seq (top) and single-nucleus RNA-seq (snRNA-seq; bottom). For snRNA-seq analysis, pseudobulk gene expression data of the subclusters (shown in c) were used. j, Expression of CRK12 and CRK41 upon infection with AvrRpm1 as shown in the UMAP. These apparently correlated genes in bulk RNA-seq showed a highly different expression pattern at the single-cell level. Source Data
Extended Data Fig. 4
Extended Data Fig. 4. Linking gene expression and chromatin accessibility at the single-cell level.
a, Schematic diagram of linked accessible chromatin regions (ACRs) and a gene. An ACR and a gene are “linked” when there is a significant correlation between chromatin accessibility and mRNA expression across individual cells. b, Density plot showing the frequency of linkages at different distances from the transcription start sites (TSSs). c, Heatmap showing the linkage score (Pearson correlation coefficient between ACR count and mRNA expression) for genes that showed at least one significant link in at least one of the infection conditions or Mock. When a gene had multiple links, the maximum linkage score was shown. The sidebar shows the k-mean cluster annotation (the k value was determined by the elbow method). d, Expression of mRNA encoding VSP2, UGT85A1, and MAM1. e,f, Cluster-aggregated chromatin accessibility surrounding CBP60g (e) and AT1G56660 (f). Violin plots on the side show aggregated mRNA expression of each gene. Both genes were highly expressed in a cell-specific manner, but only CPB60g showed correlated (linked) chromatin accessibility patterns. g,h, Top motifs enriched in the promoter regions (2 kb upstream from the TSS) of defense genes (markers of immune-active mesophyll and epidermis clusters 3, 4, 7, 11, and 12) that are linked (g) and not linked (h). Source Data
Extended Data Fig. 5
Extended Data Fig. 5. Links between transcriptome and chromatin accessibility.
a, Scatter plot showing the distribution of the linkage score (Pearson correlation coefficient between ACR count and mRNA expression) at different distances from TSSs. b, GO enrichment analysis of genes in each k-mean cluster shown in (Extended Data Fig. 4c). Adjusted p-values from a one-sided hypergeometric test followed by Benjamini-Hochberg correction are shown. c, Density plot showing the frequency of linkages at different distances from TSS for cluster marker genes and non-marker genes. d, Density plot showing the frequency of the size of ACRs for linked or non-linked genes. e, Density plot showing the frequency of genes with different numbers of linked ACRs. f, Schematic diagram of the ATAC activity analysis. For each gene, ATAC reads mapped on the gene body or the 400 bp upstream region were aggregated to calculate the score. g, Scatter plot showing the relationship between the number of linkages (x-axis) and RNA-ATAC activity correlation score (y-axis). h, Scatter plot showing the relationship between the maximum correlation coefficient between each gene and linked ACRs (x-axis) and RNA-ATAC activity correlation score (y-axis). Source Data
Extended Data Fig. 6
Extended Data Fig. 6. Identification of TF-gene modules.
a,b Heatmaps showing (a) enrichment scores of 465 motifs and (b) expression of corresponding transcription factors (TF) in each nucleus. The top bars show cluster annotation defined in Fig. 1b. c, Heatmap showing Pearson correlation coefficient between motif enrichment scores and mRNA expression of the corresponding TFs in each cell type (shown in the top bar). All TFs are shown. d, GO enrichment analysis of genes predicted to be targeted by TFs shown in Fig. 2h. Source Data
Extended Data Fig. 7
Extended Data Fig. 7. MERFISH data analysis.
a, Example raw images of MERFISH that capture the same region of tissue across three imaging rounds. White spots are signals derived from single mRNA molecules. We observed similar results in all independent samples. b, Two-dimensional plots of all the transcripts detected by MERFISH in each sample. The number of transcripts is shown. c, Spatial expression pattern of ALD1 detected by MERFISH in each sample. d, (Left) A field of view (FOV) that shows obscure DAPI nuclei staining signal. (Middle) Transcript-based segmentation in the same FOV (see Method). Transcripts were colored by assigned cells. (Right) Centroids of cells detected by the transcript-based segmentation (red dots) and the result of failed DAPI-staining-based segmentation (yellow region). Similar patterns were observed across FOVs and samples. A systematic quantitative analysis is provided in (f). (a,d) Scale bars = 40 µm. e, f, The fraction of transcripts in Cellpose-segmented cells fell within Baysor-segmented cells. (e) Cells detected in the field of view (FOV) shown in (d) were used. (f) Cells detected in 100 FOVs were used. g, Integrated UMAP of all MERFISH data. h, Spatial mapping of de novo MERFISH clusters annotated as vasculature. b,c,h Scale bars = 1 mm.
Extended Data Fig. 8
Extended Data Fig. 8. Spatial mapping of whole transcriptome and epigenome.
a, Imputed mRNA expression of ALD1 (Top) predicted its mRNA expression pattern measured with MERFISH (Bottom). Magnified images are shown on the right. b, Imputed mRNA expression of ICS1 (Top) predicted its mRNA expression pattern measured with smFISH (Bottom). Magnified images are shown on the right. c, Imputed ATAC activity (Extended Data Fig. 5f) of ICS1 (top) and ALD1 (bottom), which showed consistent patterns with mRNA expression (a,b). d, Imputed motif enrichment scores of HsfB2b (Top) was consistent with mRNA expression of HsfB2b confirmed by MERFISH (Bottom). e, Spatial mapping of pseudotime values based on data integration and label transfer between snRNA-seq and MERFISH data of DC3000-infected plants. f, smFISH of ICS1 in leaves infected by AvrRpt2 or DC3000 at 24 hpi. g, Spatial mapping of bacterial transcripts detected with smFISH in plants infected by AvrRpt2 (left) and DC3000 (right) at 24 h post-infection (hpi). Pseudotime values are also visualized in the background. Dot size reflects the number of bacterial transcripts detected. a-g, Scale bars = 1 mm. h, Scatter plot showing the number of bacterial transcripts (x-axis) and averaged pseudotime values of five nearest neighbor plant cells (y-axis) for each bacterial colony in plants infected by AvrRpt2 (blue) and DC3000 (red) at 24 hpi. i, Averaged pseudotime scores of cells surrounding each bacterial colony. The x-axis shows the number of nearest plant cells analyzed for each bacterial colony. Shaded error bands indicate standard error of the mean. Source Data
Extended Data Fig. 9
Extended Data Fig. 9. Characterization of PRIMER and bystander cells.
a, Heatmaps showing expression of ALD1, FMO1, and BON3 in each cell at 9 hpi. b, Expression of BON3 shown in the UMAP in Figs. 4a and 5d. BON3 expression is enriched in cells with the highest Pseudotime scores. c, Expression of WRKY8 and LSD1 in the sub-clusters of clusters 3, 7, and 11 in the snRNA-seq data (Fig. 1f). d, Violin plot showing expression PUB36 in the PRIMER cell cluster of WT and GT-3A knockout (gt3a-KO) plants. The gene model of PUB36, ATAC-seq peaks, and a GT-3A binding motif are shown below. e, GO enrichment analysis of genes downregulated in a bystander cell cluster of gt3a-KO compared to WT. Adjusted p-values from a one-sided hypergeometric test followed by Benjamini-Hochberg correction are shown. f, Violin plot showing expression of ALD1 in a bystander cluster. d-f, Two independent replicates of each sample were analyzed with single-nucleus RNA-seq. g, Expression of BON3 and GT-3A in cells in mock (top) or DC3000-infection (bottom) condition. h, Expression of ICS1 in cells infected by AvrRpt2. c,g,h, All time points were combined. i, Motif activity of GT-3A in immune-active mesophyll cells. j, Lesion area created by Colletotrichum higginsianum infection in Col-0 and two independent GT-3A overexpression lines and pad3 mutant at 6 days post inoculation. Different letters indicate statistical significance (adjusted P < 0.01). Adjusted p-values were calculated with two-tailed Student’s t-test followed by Benjamini–Hochberg method. n = 45, 35, 30, and 51 leaves for WT, GT-3A-ox1, GT-3A-ox2, and pad3, respectively, from three independent replicates. Results are shown as box plots with boxes displaying the 25th–75th percentiles, the centerline indicating the median, whiskers extending to the minimum, and maximum values no further than 1.5 interquartile range. k, The gene models of CBP60g and SARD1 with ATAC-seq peaks and GT-3A binding motifs. Source Data

References

    1. Nobori, T. & Ecker, J. R. Yet uninfected? Resolving cell states of plants under pathogen attack. Cell Rep. Methods3, 100538 (2023). - PMC - PubMed
    1. Ngou, B. P. M., Ding, P. & Jones, J. D. G. Thirty years of resistance: zig-zag through the plant immune system. Plant Cell34, 1447–1478 (2022). - PMC - PubMed
    1. Zhu, J. et al. Single-cell profiling of Arabidopsis leaves to Pseudomonas syringae infection. Cell Rep.42, 112676 (2023). - PMC - PubMed
    1. Tang, B., Feng, L., Hulin, M. T., Ding, P. & Ma, W. Cell-type-specific responses to fungal infection in plants revealed by single-cell transcriptomics. Cell Host Microbe10.1016/j.chom.2023.08.019 (2023). - PubMed
    1. Zhu, J., Moreno-Pérez, A. & Coaker, G. Understanding plant pathogen interactions using spatial and single-cell technologies. Commun. Biol.6, 814 (2023). - PMC - PubMed

MeSH terms