. 2025 Jan;637(8046):615-621.
doi: 10.1038/s41586-024-08316-w. Epub 2025 Jan 8.

Sulfide-rich continental roots at cratonic margins formed by carbonated melts

Affiliations

Sulfide-rich continental roots at cratonic margins formed by carbonated melts

Chunfei Chen et al. Nature. 2025 Jan.

Erratum in

Abstract

The cratonic crust contains abundant mineral deposits of metals such as gold, copper and rare earths1-5 and is underlain by a thick mantle lithosphere rich in the volatiles carbon, sulfur and water6-8. Although volatiles are known to be key components in metallogenesis9, how and where they are distributed in the cratonic lithosphere mantle and their role in the initial enrichment of metals have not been sufficiently explored. Here we compile sulfur and copper contents of global cratonic peridotites, identifying sulfide-rich and copper-rich continental roots at depths of 160-190 km at cratonic margins. Our new high-pressure experiments show that carbonated silicate melts originating from the asthenosphere lose silicate components during reaction with lithospheric peridotite, evolving to carbonatite melts that become concentrated at cratonic margins. Sulfur solubility in melts substantially decreases as the SiO2 content of melts decreases during this process, forcing sulfide precipitation and the formation of sulfide-rich continental roots at the base of the mantle lithosphere. The migration of carbonated melts towards cratonic margins replenishes the continental roots there with sulfur, explaining the co-location of magmatic metal deposits with carbonatites close to cratonic margins. These findings highlight the notable role of carbonated melts in metallogenesis and provide a potential platform for metal ore exploration.


Conflict of interest statement

Competing interests: The authors declare no competing interests.

Figures

Fig. 1
Fig. 1. Spatial relationships among carbonatite, sulfide deposits and cratonic margins.
a, Distribution of carbonatites, ≤2.5-billion-year-old magmatic sulfide deposits (Methods and Supplementary Data 3), cratonic peridotites (Supplementary Data 1), as well as cratons and their margins (data from ref. ). Map was generated using ArcGIS Pro v.3.0 (https://www.esri.com/). b,c, Cumulative frequency (CDF) of the distance of carbonatites and magmatic sulfide deposits to cratonic margins (boundaries). d, CDF of the distance of magmatic sulfide deposits to carbonatites. CDF of the distance of random locations to cratonic margins (b,c) and carbonatites (d) are shown for comparison. Source Data
Fig. 2
Fig. 2. Sulfur distribution in global peridotites.
a, Whole-rock sulfur concentrations against Al2O3 in cratonic (cratonic margins of Kaapvaal, Zimbabwe, Rae and North China cratons; Extended Data Fig. 1) and off-cratonic (xenoliths and massifs) peridotites (for data sources, see Supplementary Data 1). Sulfur contents of the unmetasomatized and refractory cratonic mantle are represented by melting contours for melt extraction at 3, 5 and 7 GPa (ref. ). b, Welch’s t-test quantifies the difference in sulfur contents between cratonic and off-cratonic peridotites and their density distribution. c, Variation in sulfur distribution with depth in the lithospheric mantle along cratonic margins. Average off-cratonic peridotites (error bar is s.d.) and asthenospheric mantle, are shown for comparison. Most of the compiled off-cratonic peridotites are spinel facies from the shallow lithospheric mantle (Methods), thus their average equilibrated pressure is assumed to be 2 GPa in c. Source Data
Fig. 3
Fig. 3. Evolution of phase proportions and compositions in experimental products.
a, Variation of phase abundances with temperature in reaction experiments between ST225 and harzburgite at 6 GPa. Ol, olivine; Cpx, clinopyroxene; Grt, garnet; Ilm, ilmenite; Phl, phlogopite; Mag, magnesite; Opx, orthopyroxene; Ap, apatite. b, Evolution of SiO2 contents in experimental melts at 4 and 6 GPa. Mix: mixture reaction experiments between aillikites (ST250, ST250S, ST225) and harzburgite; layer: layered reaction experiments. Experimental melts of CO2-bearing peridotite,, and CO2–H2O-bearing peridotite at 6–7 GPa are shown for comparison (grey symbols). c, Variation of SCSS of experimental melts with SiO2 content. Natural aillikite ST225 (starting material for experiments) and melts from previous experiments are shown for comparison. Symbols as in b. d, Calculated sulfur content in metasomatic peridotites resulting from the interaction of carbonated silicate melts with the lower lithosphere mantle (assuming initial S content = 0 wt%) at pressures of 6 GPa and melt/rock ratios of 2.0, 1.0 and 0.5 (blue lines). SCSS of silicate melt with mid-ocean ridge basalt (MORB)-like compositions are lower than those of carbonate-rich melts along asthenospheric geotherms (about 1,500 °C at 6 GPa). Source Data
Fig. 4
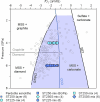
Fig. 4. Melt compositional evolution and formation of sulfide-rich continental roots.
a, Blue lines represent SiO2 isopleths in the experimental melts of this study. Grey lines are experimental melts in peridotite–CO2–H2O systems,. The grey shaded region is the zone in which partial melts of peridotite with CO2 and H2O have carbonatite composition (CbM). Solid grey line indicates the melting curve for peridotite with CO2–H2O, in which melts have 40 wt% CO2 (ref. ). The green shaded field represents the estimated PT conditions beneath cratons based on xenolith thermobarometry,. Adiabatic gradient for a mantle potential temperature of 1,380 °C (Tp) is shown. Melts are initially carbonated silicate melts with approximately 20 wt% SiO2 (red arrows) and evolve by the reaction to carbonatite (orange arrows) as infiltration proceeds. b, Illustration of melt compositional evolution. Asthenospheric material and low-degree carbonate-rich melts flow along inverted valleys that follow the negative topography of the underside of the lithosphere, leading preferentially towards craton margins at intermediate depths. Sulfur-carrying capacity decreases as the melt composition evolves from carbonated silicate to carbonatite, depositing sulfides beneath the craton margins.
Fig. 5
Fig. 5. Temporal relationships between tectonics and carbonatites.
(Modified after fig. 1 of ref. ). a, Frequency distribution of carbonatites (n = 387; data from ref. ) and kimberlites (n = 1,133; data from ref. ) through geological time, showing that carbonatite peaks correspond to the breakup of supercontinents (as recognised for kimberlites by refs. ,). b, Cross-correlations between ΔF and global carbonatites spanning 1,000–0 million years ago (n = 304; Methods). As noted by ref. , “ccf (ΔF, C) gives correlations between ΔF(t + l) and C(t) at lags l”. Here negative lags indicate breakup after eruption and positive lags indicate breakup before eruption (as in ref. ). Positive correlations show that carbonatites are associated with continental breakup. The peak correlation at lag −6 Myr shows that carbonatite magmatism most commonly occurs about 6 Myr before continental breakup. Source Data
Extended Data Fig. 1
Extended Data Fig. 1. Compiled cratonic and off-cratonic peridotites.
The location of the compiled cratonic and off-cratonic peridotites. Data are compiled in Supplementary Data 1. Cratons and their boundaries are the same as in Fig. 1 (data from ref. ). Map was generated using ArcGIS Pro v.3.0 (https://www.esri.com/).
Extended Data Fig. 2
Extended Data Fig. 2. Chemical compositions of cratonic and off-cratonic peridotites.
a, Whole-rock sulfur concentrations versus Ti/Eu. b, Cu concentrations versus pressure. Primitive mantle (PM) is shown for comparison. Low Ti/Eu ratios in the peridotites (yellow arrows) are the result of interaction with carbonate-rich melts,. c, Whole-rock sulfur versus copper contents. d, Whole-rock Al2O3 versus Os contents. Source Data
Extended Data Fig. 3
Extended Data Fig. 3. Compositions of starting materials.
Major-element compositions of starting materials from this study (two aillikites) compared with experimental melts from melting of CO2-bearing peridotite,, and CO2–H2O-bearing peridotite. The compositions of the two aillikites are similar to those of melts of CO2–peridotites at asthenospheric geotherms. The starting materials from previous reaction experiments between carbonate-rich melts and peridotite–,, are also shown for comparison. Source Data
Extended Data Fig. 4
Extended Data Fig. 4. Oxygen fugacity in the experiments.
Oxygen fugacity in the experiments in this study estimated using the method of ref.  compared with the field in which carbonated melts may coexist with sulfide (MSS, monosulfide solid solution) or would have sulfur dissolved chiefly as S2−. Graphite–CO buffer (CCO), sulfide to sulfate transition (SST) and the lowest fO2 for a peridotitic assemblage in which a carbonated melt is stable (CMG/D) are shown for comparison. The peridotite data source is the same as in ref. . Source Data
Extended Data Fig. 5
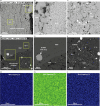
Extended Data Fig. 5. Representative backscattered electron images of experimental charges.
af, Representative backscattered electron images of run products: 6 GPa and 1,250 °C on ST225-mix (ac) and 4 GPa and 1,400 °C on ST250S-mix (df). gi, Maps of chemical compositions of melts (S, Fe and Ni). The homogeneous compositions suggest no contamination of sulfide melt drops during analysis.
Extended Data Fig. 6
Extended Data Fig. 6. Variation in modal abundances of experimental phases.
ad, Variation of the modal abundances of experimental phases at 4 GPa for ST225-mix (a), ST250-mix (b) and ST250S-mix (d) and 6 GPa for ST250-mix (c). The phases of the starting materials are shown for comparison. Ol, olivine; Cpx, clinopyroxene; Grt, garnet; Ilm, ilmenite; Phl, phlogopite; Mag, magnesite; Sul, sulfide; Opx, orthopyroxene; Ap, apatite. Source Data
Extended Data Fig. 7
Extended Data Fig. 7. Chemical compositions of experimental melts.
a,b, Ca/(Ca + Mg) and FeO contents of experimental melts. Experimental melts from melting of CO2-bearing peridotite,, and CO2–H2O-bearing peridotite at 6–7 GPa are shown for comparison (grey symbols). c,d, Variation in the SCSS of experimental melts with temperature and FeO content. Melts from previous experiments are shown for comparison. Source Data
Extended Data Fig. 8
Extended Data Fig. 8. Carbonatite distribution and lithospheric thickness.
a, Global map of carbonatites plotted on a map of lithospheric thickness interpolated using data from ref. . Map was generated using ArcGIS Pro v.3.0 (https://www.esri.com/). b, Lithospheric thickness for carbonatites (carbonatites predominantly occur on lithosphere with thickness in the range 120–200 km). Source Data
Extended Data Fig. 9
Extended Data Fig. 9. Phase relations of experimental sulfides.
Phase relations of the sulfides in this study compared with the solidus and liquidus of the monosulfide from previous experiments,. Only two high-temperature experiments have both MSS and sulfide melt drops, the others have only monosulfide (MSS).
Extended Data Fig. 10
Extended Data Fig. 10. Osmium isotope compositions of sulfides in Kaapvaal peridotites.
In situ osmium isotope compositions of sulfides from the Kaapvaal peridotites versus pressure. Osmium isotope composition of the primitive mantle is shown for comparison. Source Data
Extended Data Fig. 11
Extended Data Fig. 11. Comparison of EDS and EPMA measurements.
a, Data comparison of measurements acquired by EDS and by EPMA (or recommended value of reference materials). a, Comparison of major-element compositions of experimental melts from this study and reference materials by the two analytical methods. b, Comparison of sulfur content between measurements by the two analytical methods. Source Data
Extended Data Fig. 12
Extended Data Fig. 12. Compositions of experimental minerals.
ad, Major-element chemistry of olivine (Ol, a), clinopyroxene (Cpx, b), garnet (Grt, c) and magnesite (d) in the experiments showing systematic changes with temperature. Source Data
Extended Data Fig. 13
Extended Data Fig. 13. Compositions of experimental sulfides.
a,b, Fe (a) and Ni (b) contents of sulfides in the experiments. Source Data

References

    1. Griffin, W. L., Begg, G. C. & O’Reilly, S. Y. Continental-root control on the genesis of magmatic ore deposits. Nat. Geosci.6, 905–910 (2013).
    1. Hoggard, M. J. et al. Global distribution of sediment-hosted metals controlled by craton edge stability. Nat. Geosci.13, 504–510 (2020).
    1. Begg, G. C. et al. Lithospheric, cratonic, and geodynamic setting of Ni-Cu-PGE sulfide deposits. Econ. Geol.105, 1057–1070 (2010).
    1. Holwell, D. A. et al. A metasomatized lithospheric mantle control on the metallogenic signature of post-subduction magmatism. Nat. Commun.10, 3511 (2019). - PMC - PubMed
    1. Maier, W. D. & Groves, D. I. Temporal and spatial controls on the formation of magmatic PGE and Ni–Cu deposits. Miner. Depos.46, 841–857 (2011).

LinkOut - more resources