. 2025 Feb;638(8052):1130-1138.
doi: 10.1038/s41586-024-08400-1. Epub 2025 Jan 8.

The sequence-structure-function relationship of intrinsic ERα disorder

Affiliations

The sequence-structure-function relationship of intrinsic ERα disorder

Zhanwen Du et al. Nature. 2025 Feb.

Abstract

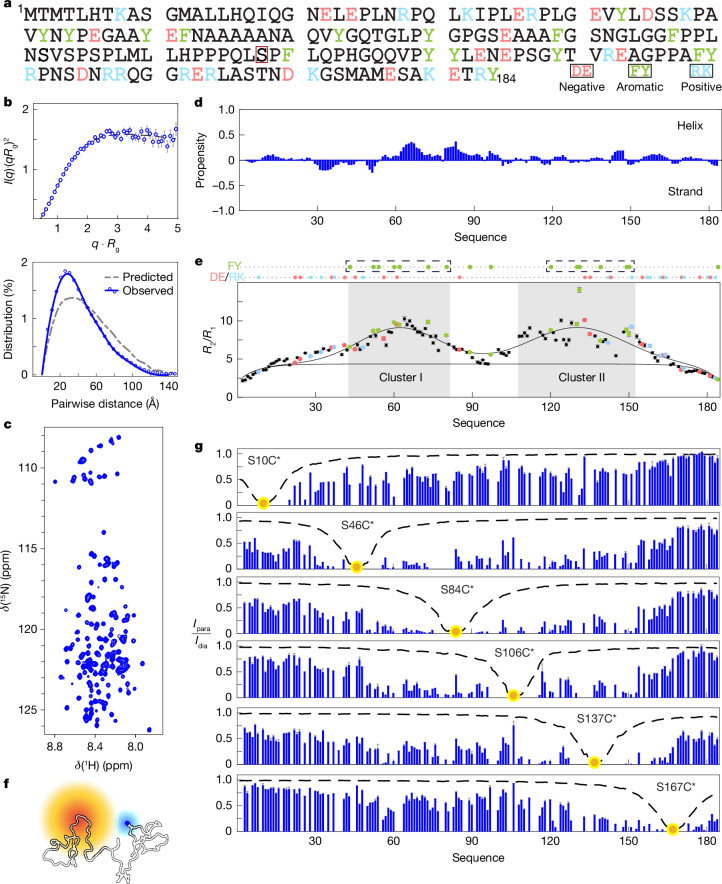
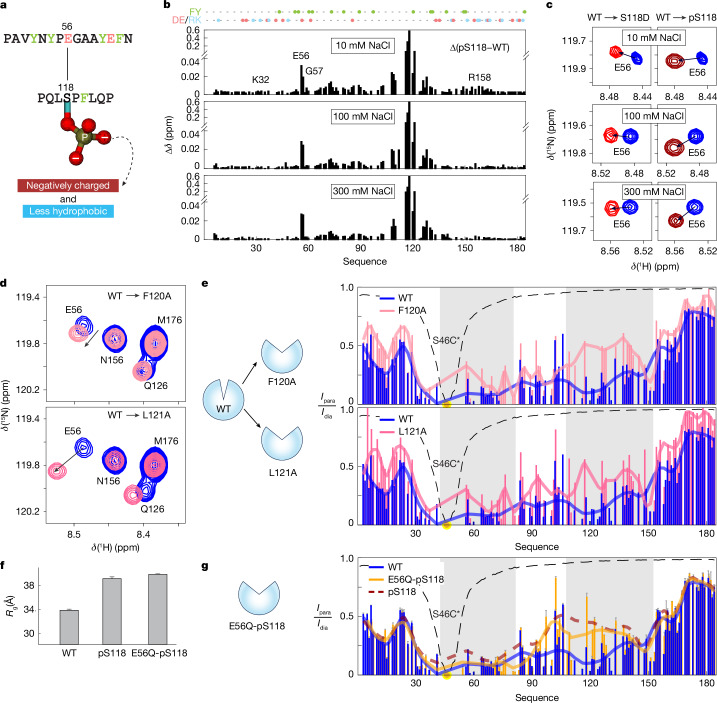
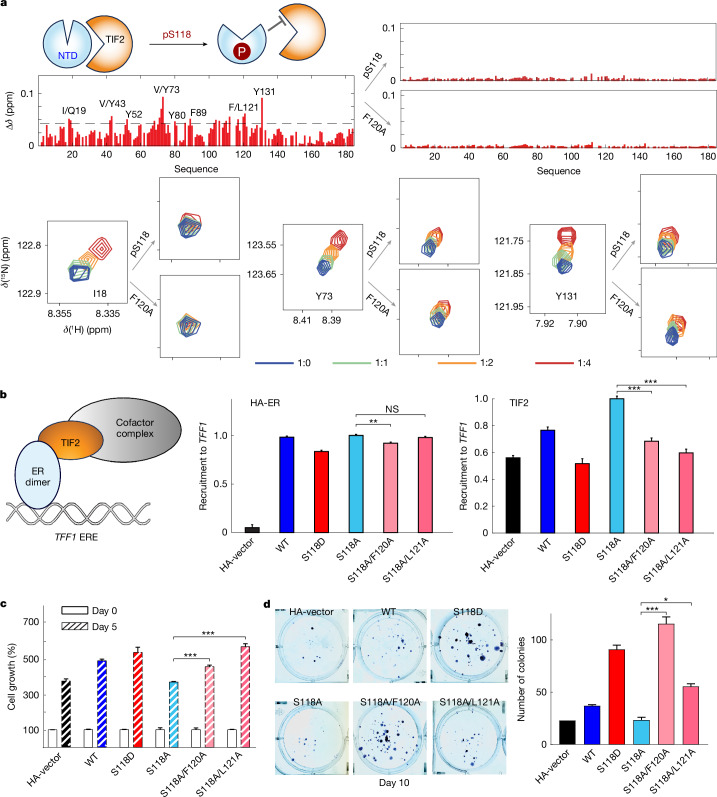
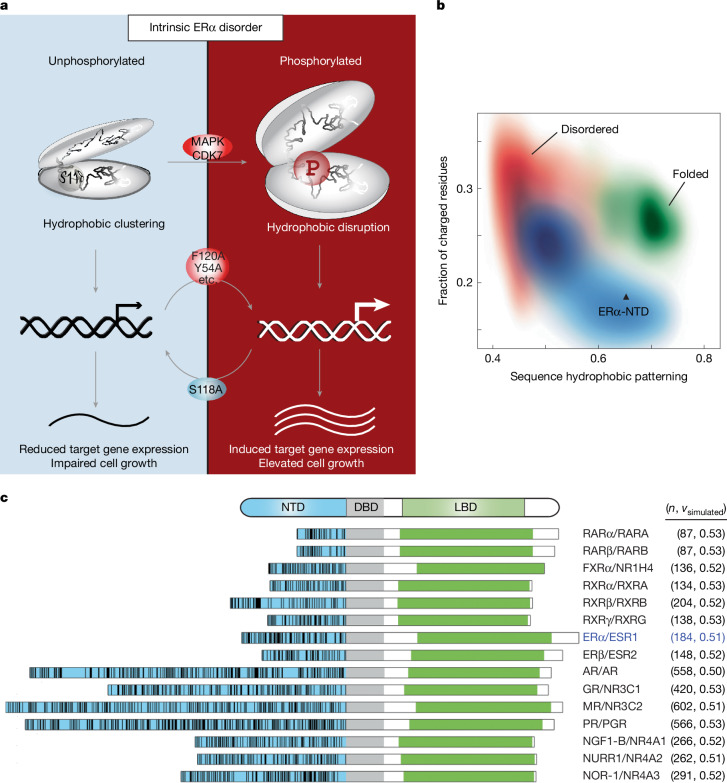
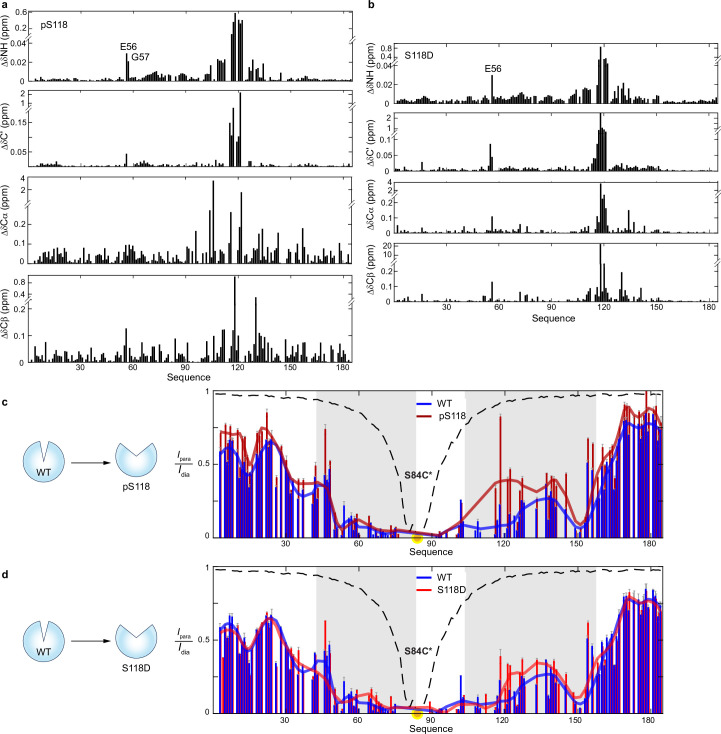
The oestrogen receptor (ER or ERα), a nuclear hormone receptor that drives most breast cancer1, is commonly activated by phosphorylation at serine 118 within its intrinsically disordered N-terminal transactivation domain2,3. Although this modification enables oestrogen-independent ER function, its mechanism has remained unclear despite ongoing clinical trials of kinase inhibitors targeting this region4-6. By integration of small-angle X-ray scattering and nuclear magnetic resonance spectroscopy with functional studies, we show that serine 118 phosphorylation triggers an unexpected expansion of the disordered domain and disrupts specific hydrophobic clustering between two aromatic-rich regions. Mutations mimicking this disruption rescue ER transcriptional activity, target-gene expression and cell growth impaired by a phosphorylation-deficient S118A mutation. These findings, driven by hydrophobic interactions, extend beyond electrostatic models and provide mechanistic insights into intrinsically disordered proteins7, with implications for other nuclear receptors8. This fundamental sequence-structure-function relationship advances our understanding of intrinsic ER disorder, crucial for developing targeted breast cancer therapeutics.


Conflict of interest statement

Competing interests: The authors declare no competing interests.

Figures

Fig. 1
Fig. 1. Hydrophobic clustering in ER-NTD.
a, ER-NTD sequence highlighting charged (negative, light red; positive, light blue) and aromatic residues (light green), with Ser118 in red box. b, Top, Kratky plot of SEC-SAXS data (4 °C). Error bars, I(q) propagated uncertainties. Bottom, pairwise distance distribution (solid line, SAXS-EOM; circles, GNOM; dashed line, flexible-meccano). c, 1H-15N HSQC spectrum (850 MHz) (see Extended Data Fig. 2a for assignments). d, Secondary structure propensity from 1H, 15N and 13C (Cα, Cβ and C’) chemical shifts using disordered protein algorithm. Low scores indicate minimal structure. e, 15N amide R2/R1 ratios showing two clusters—cluster I (residues 43–81) and cluster II (108–152)—identified by two-cluster Gaussian fitting (Supplementary Methods). Shaded regions, higher R2/R1 ratios; top, aromatic residues. Error bar, standard deviation propagated from R1 and R2 uncertainties. f, Schematic of paramagnetic effect between nitroxide-spin (yellow) and NMR-active nucleus (blue). g, PRE profiles following MTSL spin labelling at six cysteine mutants. Peak intensity ratio (Ipara/Idia) indicates spin label–amide proton distances. Yellow circles, spin label position; dashed lines, predicted random coil effect. I(q), normalized scattering intensity; q, scattering vector amplitude.
Fig. 2
Fig. 2. pSer118 induces conformational changes.
a, 1H-15N HSQC spectra overlay: WT (blue), S118D (red), and pS118 (dark red), with notable chemical shift changes annotated. Circled peaks magnified in c. b, WT versus pS118 comparison: secondary structure propensity (top) and 15N amide R2/R1 ratios (bottom). c, Top, E56 and G57 backbone amide chemical shift changes following pSer118. Δδ=(ΔδH2+(ΔδN×0.154)2, where ΔδH and ΔδN are proton and nitrogen changes, respectively, relative to unbound protein. Bottom, WT and S118D/pS118 spectral overlap. 13C chemical shift changes are given in Extended Data Fig. 6a,b. d, Long-range propagation of pSer118 effects to E56/G57. e, PRE profiles from S46C and S84C spin labelling showing increased separation between clusters I and II following phosphorylation (Extended Data Fig. 6c). Yellow circle denotes spin-labelling position, shaded lines are a visual aid. f, pSer118 increases Rg by 5.2 ± 0.4 Å (Extended Data Fig. 1e). g, Phosphorylation-induced ER-NTD expansion.
Fig. 3
Fig. 3. Hydrophobic disruption drives ER-NTD conformational changes.
a, Structural context of pS118 and E56/G57 interactions. Ball-and-stick, phosphoryl group of pS118; light green, aromatic residues; red, charged residues. b, Chemical shift changes (∆δ) following pSer118 at varying salt concentrations (Methods). c, E56 chemical shift changes in HSQC spectra for S118D (left) and pS118 (right) under three salt conditions. d, E56 chemical shift changes induced by mutations in F120A (top) and L121A (bottom). e, PRE measurements with S46C spin labelling showing F120A and L121A mutations mimicking phosphorylation effects. Yellow circles, spin label position; solid lines, visual aid (WT blue, mutants pink). HSQC, 850 MHz, 4 °C. f,g, Charge-neutralizing E56Q mutation showing minimal impact on Rg (f; Extended Data Fig. 1e) and cluster separation (g; S46C spin-labelling PRE) compared with pS118.
Fig. 4
Fig. 4. Hydrophobic mutations rescue S118A-induced transcriptional deficits.
a,b, F120A and L121A restore S118A-impaired reporter activity in ER-NTD (HEK293T (a) and MCF7 cells (b)). Immunoblots confirmed protein expression. Mean ± s.e.m. from four technical repeats performed across three biological replicates. For gel source data, see Supplementary Fig. 4. c, F120A and L121A restore S118A-impaired reporter activity in full-length ER (MCF7 cells). Immunoblots confirmed protein expression. d, Schematic showing F120A and L121A compensation for S118A deficiency. e, F120A and L121A restore S118A-reduced ER target gene expression (TFF1, CCND1 and MYC) in MCF7 cells. Immunoblots confirmed protein expression. Mean ± s.e.m. from three technical repeats across three biological replicates. One-way analysis of variation with Dunnett’s test, *P < 0.05, **P < 0.01, ***P < 0.005. mRNA, messenger RNA.
Fig. 5
Fig. 5. Hydrophobic mutations modulate cofactor interactions and cell growth.
a, Top, F120A alters ER-NTD–TIF2-QRD interactions similarly to pSer118. Chemical shift changes (∆δ) shown for ER-NTD variants (WT, pS118 and F120A) following TIF2-QRD binding (1/4 ratio). Annotated residues, above-average changes. Additional data are provided in Extended Data Fig. 9d and Supplementary Fig. 6. Bottom, HSQC spectra at various NTD/TIF2 ratios. b, Effects of F120A and L121A on ER-S118A and TIF2 recruitment to TFF1 promoter (MCF7 cells). Left, ER–TIF2 interaction schematic. Middle, ER variant association unchanged versus WT. Right, F120A and L121A reverse S118A-induced TIF2 recruitment increase, mimicking S118D. TFF1 ERE was quantified by CUT&RUN/qPCR. Mean ± s.e.m. from four technical repeats. c,d, F120A and L121A restore S118A-impaired MCF7 cell growth (c; mean ± s.e.m. from three technical repeats across three biological replicates) and colony formation (d; mean ± s.e.m. from two technical repeats across two biological replicates; DMEM medium, crystal violet quantification at 450 nm). Additional data on 4-hydroxytamoxifen are provided in Extended Data Fig. 7d. One-way analysis of variation with Dunnett’s test, *P < 0.05, **P < 0.01, ***P < 0.005. NS, not significant.
Fig. 6
Fig. 6. Hydrophobic patterning in nuclear receptor NTDs.
a, pSer118 alters ER-NTD hydrophobic clustering, inducing long-range conformational changes. This clamshell-like motion modulates ER-mediated gene expression and cellular phenotypes. b, Nuclear receptor NTDs showing higher hydrophobic content than typical IDPs. Contour plot comparing fraction of charged residues versus sequence hydrophobic patterning for 28,058 IDPs (red), 2,360 folded proteins (green) and 48 nuclear receptor NTDs (blue). One-third of nuclear receptors and 9.4% of IDPs share ERα-NTD-like characteristics (fraction of charged residues below 0.22, sequence hydrophobic patterning above 0.6). c, Left, nuclear receptors with similar NTD characteristics (blue) showing DNA-binding domain (DBD, grey), LBD (green) and hydrophobic residue positions (black lines: A, V, I, L, M, F, Y, W). Right, receptors with NTD residue count (n) and Flory exponent (νsimulated) from coarse-grained simulations (Extended Data Fig. 10; values provided in Supplementary Table 1); ER is highlighted in light blue.
Extended Data Fig. 1
Extended Data Fig. 1. SEC-SAXS analysis of ER-NTD disorder.
(a) ER modular domains: NTD, DBD (C domain), hinge region (D domain), and LBD (E domain). (b) SEC-SAXS data acquisition schematic: ER-NTD sample flows through a chromatography column coupled to SAXS measurements. (c) SEC-SAXS data of ER-NTD at 4 °C using pre-cooled buffer. I(q): scattering intensity with error bars, normalized by zero-angle scattering; q: scattering vector amplitude. (d) Kratky plot comparing ER-NTD SEC-SAXS data (blue) to folded DBD-hinge-LBD fragment (CDE, gray; ref. ). ν: Flory exponent; Rg: radius of gyration. (e) Rg values for ER-NTD variants (WT, S118D, S118A, pS118, E56Q-pS118) from SEC-SAXS at 4 °C. Dashed line: empirical molecular form factor method fitting.
Extended Data Fig. 2
Extended Data Fig. 2. ER-NTD resonance assignments and PRE analysis.
(a) 1H-15N HSQC spectrum (850 MHz) showing backbone amide NH chemical shift assignments (BMRB: 51972). (b,c) PRE intensity ratios (Ipara/Idia) comparing at two protein concentrations: S46C (32 µM vs 64 µM) and S137C (30 µM vs 60 µM) sites. High Pearson correlation coefficients (ρ) indicate consistent ratios across concentrations, demonstrating negligible intermolecular interactions. (d) Non-ionic detergent DDM (120 µM) effects on long-range interactions probed by S46C spin labeling. Protein concentration: 30 µM; yellow circle: spin label position.
Extended Data Fig. 3
Extended Data Fig. 3. Backbone dynamics analysis by 15N relaxation.
(a) Longitudinal (R1) and transverse (R2) relaxation rates of wildtype ER-NTD as a function of residue number (850 MHz). (b) 15N relaxation profiles (R1, R2) of pS118-MTD (850 MHz).
Extended Data Fig. 4
Extended Data Fig. 4. Analysis of ER-NTD Ser118 phosphorylation and phosphomimetic mutation.
(a) Western blot analysis of purified ER-NTD (WT or S118D) incubated with activated MAPK1/ERK2 kinase, using phospho-Ser118-specific antibody. Total proteins visualized by Ponceau S staining. For gel source data, see Supplementary Fig. 1. (b) GST-Pin1 pulldown assays with purified WT, S118A, or S118D proteins. Pin1, which selectively binds phosphorylated Ser118, shows robust binding to S118D but not to unphosphorylated or S118A proteins, validating S118D as a phosphomimetic mutation. For gel source data, see Supplementary Fig. 1.
Extended Data Fig. 5
Extended Data Fig. 5. NMR analysis of WT, S118D, and pS118 ER-NTD.
(a) 1H-15N HSQC spectra of 15N-labeled WT, S118D, and pS118 proteins. BMRB accession codes: 51972 (WT), 51976 (S118D), 51977 (pS118). (b) Secondary structure propensity (SSP) calculated from 1H, 15N, and 13C (Cα, Cβ, and C’) chemical shifts. Low SSP scores indicate absence of persistent secondary structure.
Extended Data Fig. 6
Extended Data Fig. 6. S118 modification effects on ER-NTD long-range interactions.
(a,b) Chemical shift changes induced by pS118 and S118D relative to WT, calculated using 1H, 15N, 13C (Cα, Cβ, and C’) chemical shifts. ΔH/N=ΔδH2+(ΔδN×0.154)2, where ∆δH and ∆δN represent backbone amide 1H and 15N chemical shift changes. (c,d) Long-range interaction changes probed by S84C spin labeling: PRE profiles of pS118 (dark red) and S118D (red) compared to WT (blue). Protein concentration: 30 µM; yellow circle: spin label position.
Extended Data Fig. 7
Extended Data Fig. 7. Functional analysis of S118D and hydrophobic mutations.
(a, b) Transcription activity of Gal4-NTD variants (WT, S118D, or S118A) in HEK293T cells and MCF7 cells with western blot validation. Mean ± SEM from four technical repeats performed across three biological replicates. For gel source data, see Supplementary Fig. 2. (c) Full-length ER variant (WT, S118D, S118A) transcriptional activity in MCF7 cells treated with vehicle, 100 nM E2, or 1 μM 4OH-tamoxifen (12 h). Western blot confirms protein expression. For gel source data, see Supplementary Fig. 2. (d) Growth rescue by F120A and L121A mutations in S118A MCF7 cells treated with 1 μM 4OH-tamoxifen (5 days). Cell numbers quantified by CCK-8 assay (450 nm absorbance). Mean ± SEM from four technical repeats performed across three biological replicates. One-way ANOVA with Dunnett’s test: *p < 0.05; **p < 0.01; ***p < 0.005.
Extended Data Fig. 8
Extended Data Fig. 8. Hydrophobic aromatic residue mutations modulate ER-NTD function.
(a) Structural proximity of hydrophobic aromatic residues (Y52, Y54, Y60, F62; green) to E56 (red) and serine 118. (b,c) PRE analysis (S46C spin labeling) shows Y52A/Y54A and Y60A/F62A double mutations induce greater conformational changes than single mutations in non-phosphorylated NTD. Yellow circle: spin label position; solid lines: visual aid. HSQC: 850 MHz, 4 °C. (d,e) Y52A/Y54A and Y60A/F62A rescue S118A-impaired reporter activity in ER-NTD (HEK293T cells) and full-length ER (MCF7 cells). Western blots confirm protein expression. Mean ± SEM from four technical repeats performed across three biological replicates. For gel source data, see Supplementary Fig. 3. (f) Schematic: Y52A/Y54A or Y60A/F62A rescue transcription activity of phosphorylation-deficient S118A mutant. (g,h) Y52A/Y54A and Y60A/F62A restore S118A-impaired cell growth (Mean ± SEM from three technical repeats across three biological replicates) and colony formation in MCF7 cells (Mean ± SEM from two technical repeats across two biological replicates; DMEM media, crystal violet quantification at 450 nm). One-way ANOVA with Dunnett’s test: *p < 0.05; **p < 0.01; ***p < 0.005.
Extended Data Fig. 9
Extended Data Fig. 9. Analysis of TIF2 interactions and NTD chemical shifts.
(a) TIF2 domains showing NRID (via LxxLL motifs) and Q-rich domain (QRD),. (b) Model of TIF2 binding to ER-NTD (via QRD) and ER-LBD (via NRID). (c) GST-LBD pulldowns with His-tagged NTD proteins (WT, S118D, S118A), analyzed by western blot with GST-Pin1 controls. For gel source data, see Supplementary Fig. 5. ER-LBD purified per Nettles protocol. (d) Chemical shift changes in ER-NTD variants (WT, F120A, pS118) upon TIF2-QRD titration (1:0 to 1:4 molar ratios). Δδ=(ΔδH2+(ΔδN×0.154)2, where ΔδH and ΔδN are proton and nitrogen changes relative to unbound protein. Full spectra in Supplementary Fig. 6.
Extended Data Fig. 10
Extended Data Fig. 10. Analysis of nuclear receptor NTD diversity.
(a) Domain organizations of 48 human nuclear receptors showing NTD (blue), DBD (gray), and LBD (green), with marked hydrophobic residue positions in NTDs. (b) CALVADOS2, model optimization for ER-NTD using SEC-SAXS data. χ2 (root-mean-square deviation between simulated and experimental SAXS intensities) vs. ε (pairwise interaction potential depth). Optimal ε=0.23 kcal/mol at 310 K, 150 mM ionic strength, pH 7.4, 1 μs total (Supplementary Methods). (c) Comparison of simulated and experimental SAXS intensities for ER-NTD (CALVADOS2, ε=0.23 kcal/mol). (d) Analysis of NTDs (excluding two DBD-lacking sequences): residue count (N) vs. simulated Flory exponent (νsimulated) from adjusted CALVADOS2 model (ε=0.23 kcal/mol) using Rg-N power-law relation. Red: NTDs with FCR < 0.22 and SHP > 0.6 (ER-NTD-like); gray: others. FCR and SHP values in Supplementary Table 1.

Similar articles

Cited by

References

    1. Ali, S. & Coombes, R. C. Endocrine-responsive breast cancer and strategies for combating resistance. Nat. Rev. Cancer2, 101–112 (2002). - PubMed
    1. Kato, S. et al. Activation of the estrogen receptor through phosphorylation by mitogen-activated protein kinase. Science270, 1491–1494 (1995). - PubMed
    1. Chen, D. et al. Activation of estrogen receptor alpha by S118 phosphorylation involves a ligand-dependent interaction with TFIIH and participation of CDK7. Mol. Cell6, 127–137 (2000). - PubMed
    1. Patel, H. et al. ICEC0942, an orally bioavailable selective inhibitor of CDK7 for cancer treatment. Mol. Cancer Ther.17, 1156–1166 (2018). - PMC - PubMed
    1. Sava, G. P., Fan, H., Coombes, R. C., Buluwela, L. & Ali, S. CDK7 inhibitors as anticancer drugs. Cancer Metastasis Rev.39, 805–823 (2020). - PMC - PubMed

MeSH terms