. 2025 Feb;638(8049):138-145.
doi: 10.1038/s41586-024-08375-z. Epub 2025 Jan 8.

One-quarter of freshwater fauna threatened with extinction

Catherine A Sayer  1 Eresha Fernando  2 Randall R Jimenez  3 Nicholas B W Macfarlane  4 Giovanni Rapacciuolo  5 Monika Böhm  6 Thomas M Brooks  7 Topiltzin Contreras-MacBeath  8 Neil A Cox  4   9 Ian Harrison  10 Michael Hoffmann  11 Richard Jenkins  2 Kevin G Smith  2 Jean-Christophe Vié  12 John C Abbott  13 David J Allen  2 Gerald R Allen  14 Violeta Barrios  15 Jean-Pierre Boudot  16 Savrina F Carrizo  17 Patricia Charvet  18 Viola Clausnitzer  19 Leonardo Congiu  20 Keith A Crandall  21 Neil Cumberlidge  22 Annabelle Cuttelod  23 James Dalton  7 Adam G Daniels  24 Sammy De Grave  25 Geert De Knijf  26 Klaas-Douwe B Dijkstra  27 Rory A Dow  27   28 Jörg Freyhof  29 Nieves García  30 Joern Gessner  31 Abebe Getahun  32 Claudine Gibson  33 Matthew J Gollock  11 Michael I Grant  34   35 Alice E R Groom  36 Michael P Hammer  37 Geoffrey A Hammerson  38 Craig Hilton-Taylor  2 Laurel Hodgkinson  39 Robert A Holland  40 Rima W Jabado  34   41 Diego Juffe Bignoli  42 Vincent J Kalkman  27 Bakhtiyor K Karimov  43 Jens Kipping  44 Maurice Kottelat  45 Philippe A Lalèyè  46 Helen K Larson  37 Mark Lintermans  47   48 Federico Lozano  49 Arne Ludwig  50 Timothy J Lyons  51 Laura Máiz-Tomé  52 Sanjay Molur  53 Heok Hee Ng  54 Catherine Numa  55 Amy F Palmer-Newton  56 Charlotte Pike  11 Helen E Pippard  57 Carla N M Polaz  58 Caroline M Pollock  2 Rajeev Raghavan  59 Peter S Rand  60 Tsilavina Ravelomanana  61 Roberto E Reis  62 Cassandra L Rigby  34 Janet A Scott  2 Paul H Skelton  63 Matthew R Sloat  64 Jos Snoeks  65 Melanie L J Stiassny  66 Heok Hui Tan  54 Yoshinori Taniguchi  67 Eva B Thorstad  68 Marcelo F Tognelli  69 Armi G Torres  70 Yan Torres  18 Denis Tweddle  63 Katsutoshi Watanabe  71 James R S Westrip  2 Emma G E Wright  72 E Zhang  73 William R T Darwall  74
Affiliations

One-quarter of freshwater fauna threatened with extinction

Catherine A Sayer et al. Nature. 2025 Feb.

Abstract

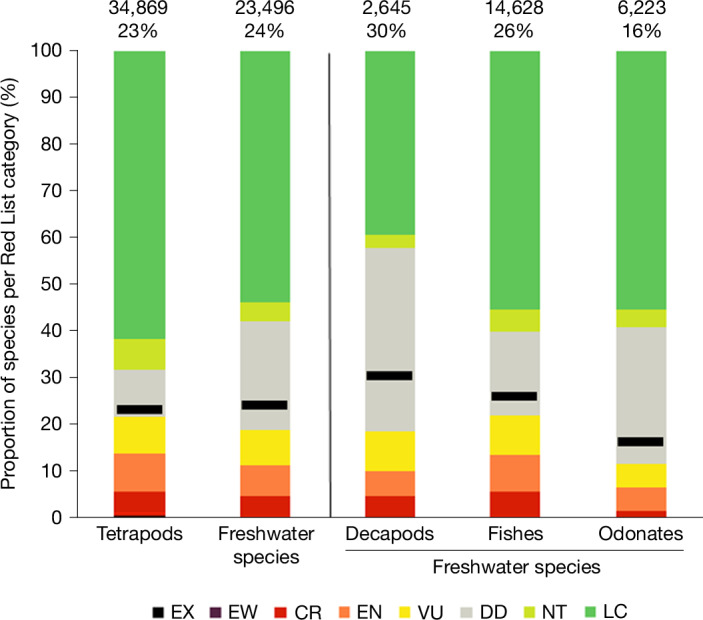
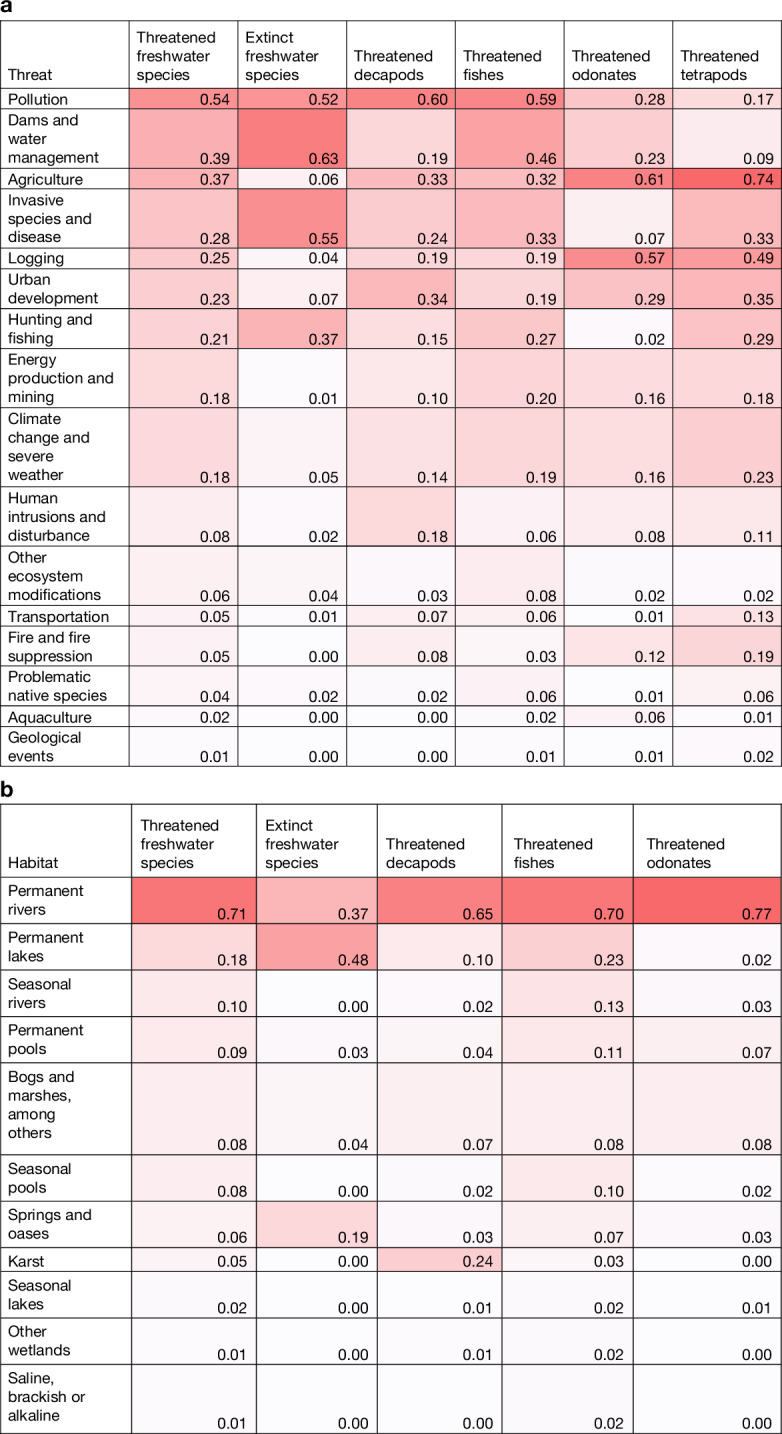
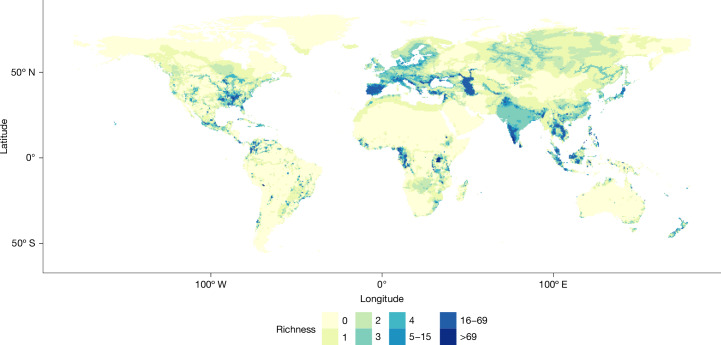
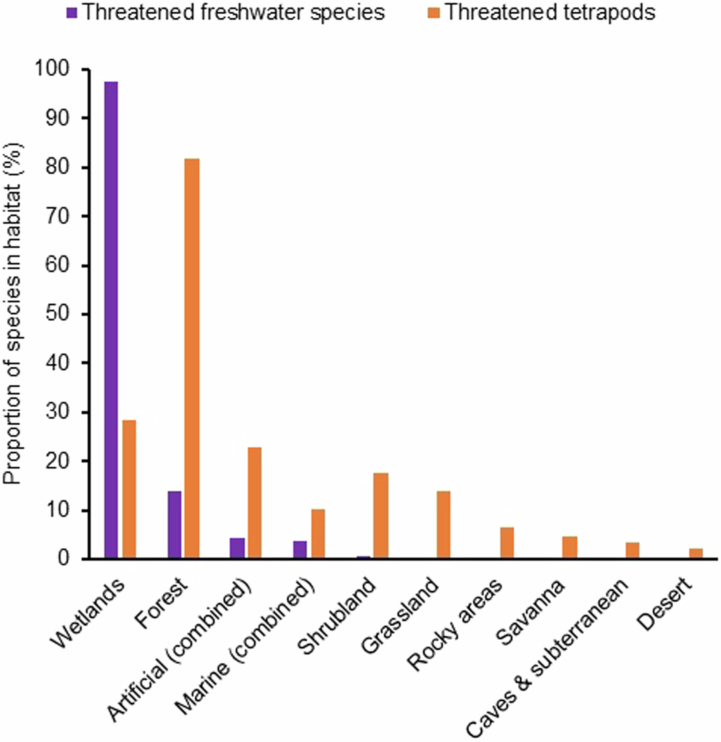
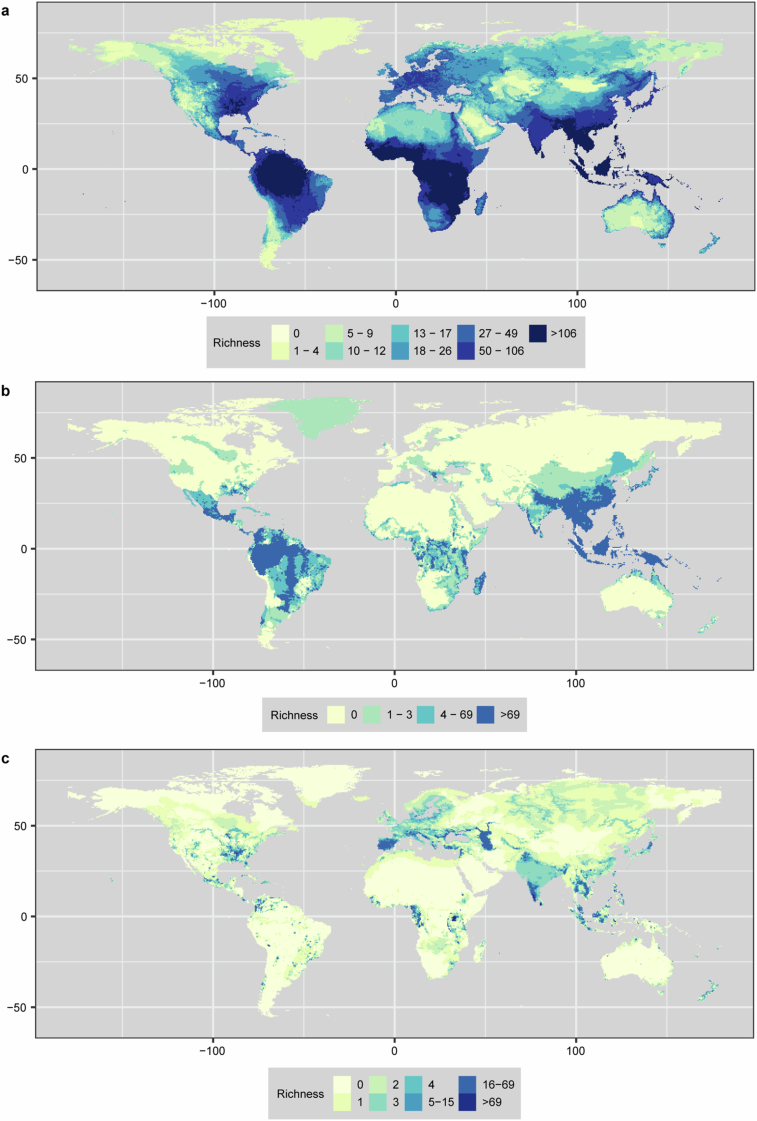
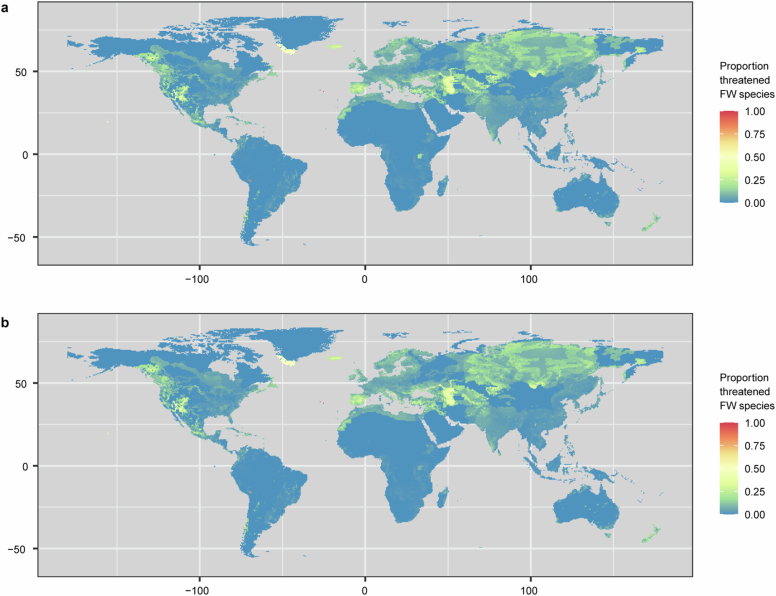
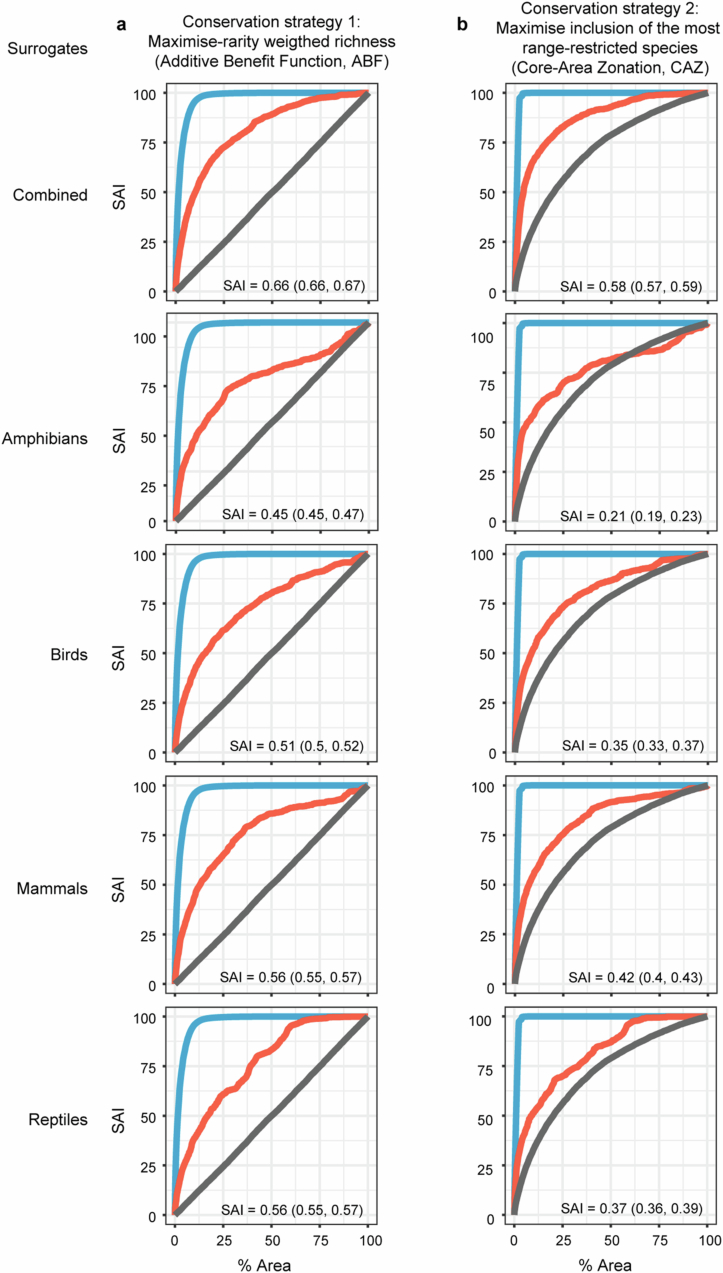
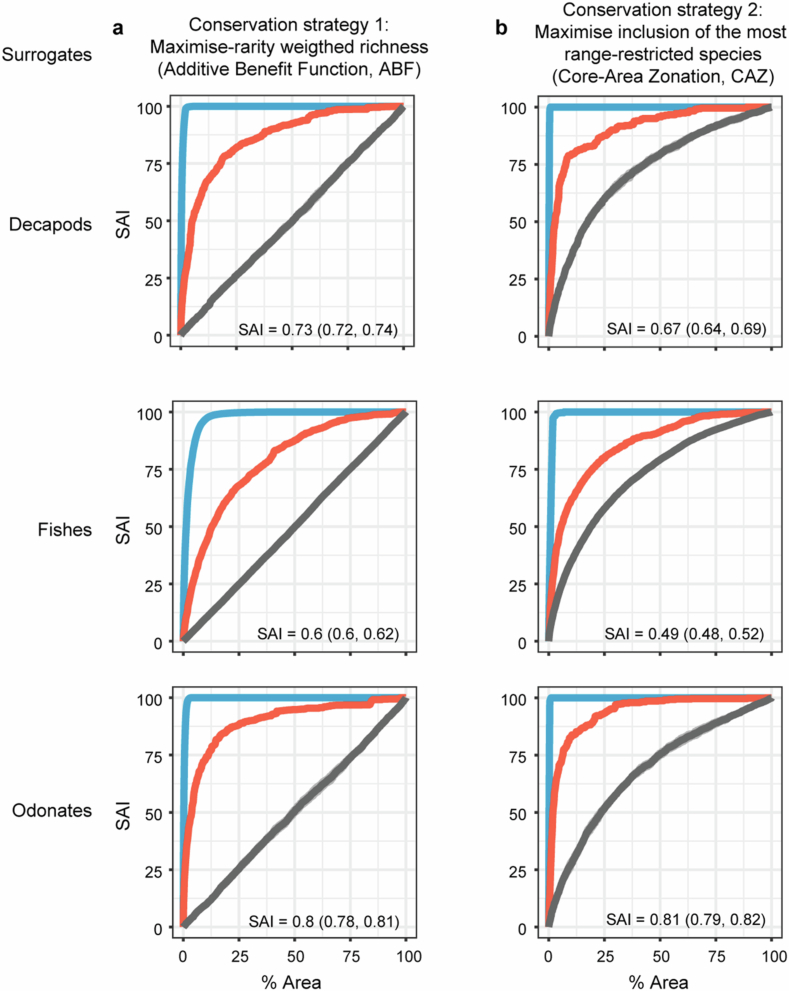
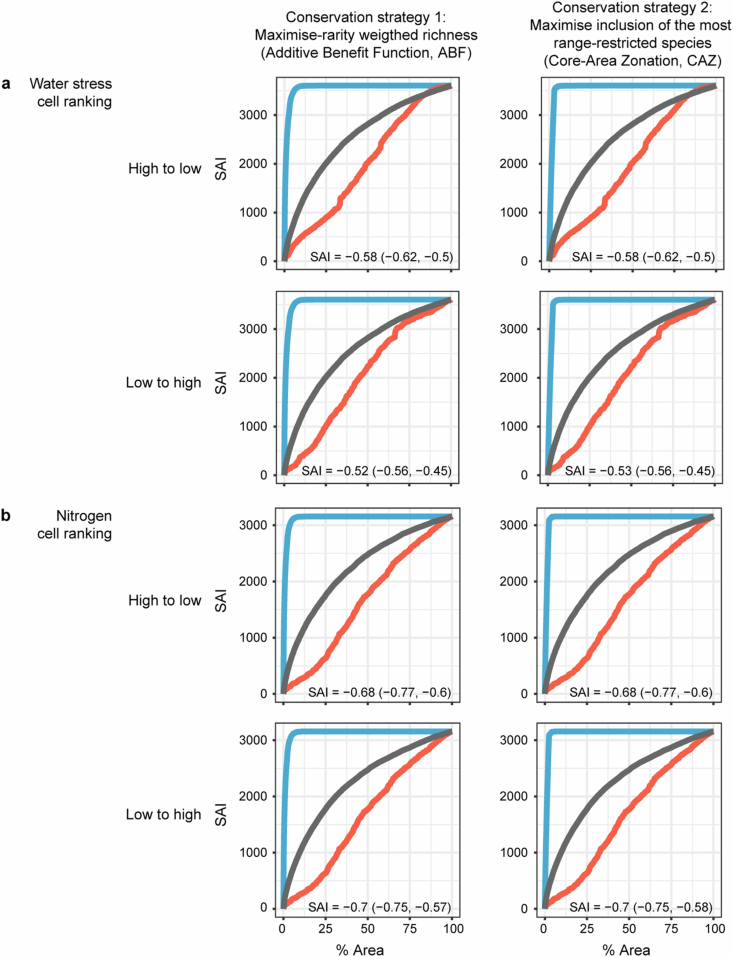
Freshwater ecosystems are highly biodiverse1 and important for livelihoods and economic development2, but are under substantial stress3. To date, comprehensive global assessments of extinction risk have not included any speciose groups primarily living in freshwaters. Consequently, data from predominantly terrestrial tetrapods4,5 are used to guide environmental policy6 and conservation prioritization7, whereas recent proposals for target setting in freshwaters use abiotic factors8-13. However, there is evidence14-17 that such data are insufficient to represent the needs of freshwater species and achieve biodiversity goals18,19. Here we present the results of a multi-taxon global freshwater fauna assessment for The IUCN Red List of Threatened Species covering 23,496 decapod crustaceans, fishes and odonates, finding that one-quarter are threatened with extinction. Prevalent threats include pollution, dams and water extraction, agriculture and invasive species, with overharvesting also driving extinctions. We also examined the degree of surrogacy of both threatened tetrapods and freshwater abiotic factors (water stress and nitrogen) for threatened freshwater species. Threatened tetrapods are good surrogates when prioritizing sites to maximize rarity-weighted richness, but poorer when prioritizing based on the most range-restricted species. However, they are much better surrogates than abiotic factors, which perform worse than random. Thus, although global priority regions identified for tetrapod conservation are broadly reflective of those for freshwater faunas, given differences in key threats and habitats, meeting the needs of tetrapods cannot be assumed sufficient to conserve freshwater species at local scales.


Conflict of interest statement

Competing interests: G.R., M.L. and L.M.-T. are affiliated with commercial companies (Elimia, Fish Fondler Pty Ltd. and Mott MacDonald, respectively), but their contributions to this paper were made in a voluntary capacity. The other authors declare no competing interests.

Figures

Fig. 1
Fig. 1. Patterns of extinction risk in tetrapods (combined) and freshwater species (decapod crustaceans, fishes and odonates; combined and individually).
The numbers above each column refer to the total numbers of species assessed and the best estimates of the proportion of species threatened (Methods). The black lines represent the best estimates of the proportion of species threatened. Red List categories are as follows: extinct (EX), extinct in the wild (EW), critically endangered (CR), endangered (EN), vulnerable (VU), data deficient (DD), near threatened (NT) and least concern (LC). Source data
Fig. 2
Fig. 2. Proportion of threatened freshwater species, extinct freshwater species and threatened tetrapods.
a, Proportion of threatened freshwater species (decapod crustaceans, fishes and odonates; combined and individually), extinct freshwater species (combined) and threatened tetrapods (combined) affected by each threat. The darker cells indicate a greater proportion of species affected by the threat. Threats are not mutually exclusive. Threats are coded following the IUCN Threats Classification Scheme (version 3.3) and combined for presentation as follows (the value of the highest hierarchical level is indicated; all subsequent levels are included): pollution (9); dams and water management (7.2); agriculture (2.1, 2.2 and 2.3); invasive species and disease (8.1, 8.3, 8.4, 8.5 and 8.6); logging (5.2 and 5.3); urban development (1); hunting and fishing (5.1 and 5.4); energy production and mining (3); climate change and severe weather (11); human intrusions and disturbance (6); other ecosystem modifications (7.3); transportation (4); fire and fire suppression (7.1); problematic native species (8.2); aquaculture (2.4); and geological events (10). For the number of species: threatened freshwater species n = 4,190, extinct freshwater species n = 82, threatened decapods n = 472, threatened fishes n = 3,032, threatened odonates n = 686 and threatened tetrapods n = 7,112. b, Proportion of threatened freshwater species (decapod crustaceans, fishes and odonates; combined and individually) and extinct freshwater species (combined) using each wetland habitat. The darker cells indicate a greater proportion of species using the habitat. Habitats are not mutually exclusive. Habitats are coded following the IUCN Habitats Classification Scheme (version 3.1) as follows: permanent rivers (5.1); permanent lakes (5.5); seasonal rivers (5.2); permanent pools (5.7); bogs and marshes, among others (5.4); seasonal pools (5.8); springs and oases (5.9); karst (5.18); seasonal lakes (5.6); other wetlands (5.3, 5.10, 5.11 and 5.12); and saline, brackish or alkaline (5.14, 5.15, 5.16 and 5.17). For the number of species: threatened freshwater species n = 4,255, extinct freshwater species n = 100, threatened decapods n = 484, threatened fishes n = 3,071 and threatened odonates n = 700. In panels a,b, threatened species include those assessed as critically endangered (including those flagged as possibly extinct and possibly extinct in the wild), endangered or vulnerable. Extinct freshwater species include those assessed as extinct or extinct in the wild.
Fig. 3
Fig. 3. Absolute richness of threatened freshwater species.
Threatened species are those assessed as critically endangered, endangered or vulnerable (including those flagged as possibly extinct and possibly extinct in the wild). The following distributions are included: presence refers to extant, probably extant or possibly extinct; origin denotes native, reintroduced or assisted colonization; and seasonality indicates resident, breeding, non-breeding or passage. The value of each cell is calculated as the count of threatened species with a mapped distribution overlapping the cell. Richness is shown using a 0.5 × 0.5 latitude–longitude grid and WGS84. World Bank Official Boundaries (licensed under a Creative Commons licence CC BY 4.0) were used as the base map. For absolute threatened species richness of tetrapods, see ref. .
Extended Data Fig. 1
Extended Data Fig. 1. Habitats used by threatened freshwater species (decapod crustaceans, fishes, and odonates; combined) and threatened tetrapods.
Threatened species include those assessed as Critically Endangered, Endangered, or Vulnerable (including those flagged as Possibly Extinct and Possibly Extinct in the Wild). Habitats are not mutually exclusive. Habitats are coded following the IUCN Habitats Classification Scheme (version 3.1) and combined for presentation as follows (value of highest hierarchical level is indicated, all subsequent levels are included): wetlands (5); forest (1); artificial (combined) (14, 15); marine (combined) (9, 10, 11, 12, 13); shrubland (3); grassland (4); rocky areas (6); savanna (2); caves & subterranean (7); and desert (8). The following habitats are not shown: introduced vegetation (16); other (17); and unknown (18). Number of species: threatened freshwater species n = 4,236; and threatened tetrapods n = 7,108.
Extended Data Fig. 2
Extended Data Fig. 2. Absolute richness of freshwater species for a) all freshwater species; b) Data Deficient freshwater species; and c) threatened freshwater species (excluding Critically Endangered (Possibly Extinct) and Critically Endangered (Possibly Extinct in the Wild) species).
The following distributions are included: Presence = Extant, Probably Extant, or Possibly Extinct; Origin = Native, Reintroduced, or Assisted Colonisation; and Seasonality = Resident, Breeding, Non-breeding, or Passage. The value of each cell is calculated as the count of species with a mapped distribution overlapping the cell. Richness shown using a 0.5 × 0.5 latitude-longitude grid and WGS84. World Bank Official Boundaries (licensed under a Creative Commons licence CC BY 4.0) were used as the base map.
Extended Data Fig. 3
Extended Data Fig. 3. Proportional richness of threatened freshwater species a) including Critically Endangered (Possibly Extinct) and Critically Endangered (Possibly Extinct in the Wild) species; and b) excluding Critically Endangered (Possibly Extinct) and Critically Endangered (Possibly Extinct in the Wild) species.
The following distributions are included: Presence = Extant, Probably Extant, or Possibly Extinct; Origin = Native, Reintroduced, or Assisted Colonisation; and Seasonality = Resident, Breeding, Non-breeding, or Passage. The value of each cell is calculated by its absolute threatened species richness divided by its absolute species richness. Richness shown using a 0.5 × 0.5 latitude-longitude grid and WGS84. World Bank Official Boundaries (licensed under a Creative Commons licence CC BY 4.0) were used as the base map.
Extended Data Fig. 4
Extended Data Fig. 4. Species Accumulation Index (SAI) values and curves from the surrogacy analysis, indicating the effectiveness of tetrapods (combined or individually) as surrogates for freshwater species (combined) targets.
Values and curves are shown for two alternative conservation strategies: a) maximises rarity-weighted richness, and b) maximises inclusion of the most range-restricted species. See Methods for a full explanation of each strategy. Surrogate effectiveness is measured using the Species Accumulation Index (SAI): values range from −∞ to 1, with 1 indicating perfect surrogacy, values between 1 and 0 indicating positive surrogacy, 0 indicating no surrogacy, and values less than 0 indicating negative surrogacy. In each panel, median SAI values are provided, with lower and upper confidence intervals in brackets. Blue lines are the optimal curves (accumulation of target diversity based on target priority areas); red lines are the surrogate curves (accumulation of target diversity based on surrogate priority areas); and grey lines are the random curves (accumulation of target diversity based on random selection of areas). Confidence intervals (95%, based on 100 randomisations) are shown in lighter shading around curves; most are too small to be visible.
Extended Data Fig. 5
Extended Data Fig. 5. Species Accumulation Index (SAI) values and curves from the surrogacy analysis, indicating the effectiveness of tetrapods (combined) surrogates for freshwater species (individually) targets.
Values and curves are shown for two alternative conservation strategies: a) maximises rarity-weighted richness, and b) maximises inclusion of the most range-restricted species. See Methods for a full explanation of each strategy. Surrogate effectiveness is measured using the Species Accumulation Index (SAI): values range from −∞ to 1, with 1 indicating perfect surrogacy, values between 1 and 0 indicating positive surrogacy, 0 indicating no surrogacy, and values less than 0 indicating negative surrogacy. In each panel, median SAI values are provided, with lower and upper confidence intervals in brackets. Blue lines are the optimal curves (accumulation of target diversity based on target priority areas); red lines are the surrogate curves (accumulation of target diversity based on surrogate priority areas); and grey lines are the random curves (accumulation of target diversity based on random selection of areas). Confidence intervals (95%, based on 100 randomisations) are shown in lighter shading around curves; most are too small to be visible.
Extended Data Fig. 6
Extended Data Fig. 6. Species Accumulation Index (SAI) values and curves from the surrogacy analysis, indicating the effectiveness of two abiotic factors as surrogates for freshwater species (combined) targets: a) water stress, and b) Nitrogen (as a proxy of eutrophication).
Values and curves are shown for two alternative conservation strategies: 1) maximises rarity-weighted richness, and 2) maximises inclusion of the most range-restricted species. See Methods for a full explanation of each strategies and values of water stress. Surrogate effectiveness is measured using the Species Accumulation Index (SAI): values range from −∞ to 1, with 1 indicating perfect surrogacy, values between 1 and 0 indicating positive surrogacy, 0 indicating no surrogacy, and values less than 0 indicating negative surrogacy. In each panel, median SAI values are provided, with lower and upper confidence intervals in brackets. Blue lines are the optimal curves (accumulation of target diversity based on target priority areas); red lines are the surrogate curves (accumulation of target diversity based on surrogate priority areas); and grey lines are the random curves (accumulation of target diversity based on random selection of areas). Confidence intervals (95%, based on 100 randomisations) shown in lighter shading around curves; most are too small to be visible.

Similar articles

Cited by

References

    1. Strayer, D. L. & Dudgeon, D. Freshwater biodiversity conservation: recent progress and future challenges. J. North Am. Benthol. Soc.29, 344–358 (2010).
    1. Lynch, A. J. et al. People need freshwater biodiversity. WIREs Water10, e1633 (2023).
    1. Dudgeon, D. Multiple threats imperil freshwater biodiversity in the Anthropocene. Curr. Biol.29, R960–R967 (2019). - PubMed
    1. Mair, L. et al. A metric for spatially explicit contributions to science-based species targets. Nat. Ecol. Evol.5, 836–844 (2021). - PubMed
    1. Hoffmann, M. et al. The impact of conservation on the status of the world’s vertebrates. Science330, 1503–1509 (2010). - PubMed

MeSH terms

LinkOut - more resources