. 2025 Feb;26(2):174-187.
doi: 10.1038/s41590-024-02041-2. Epub 2025 Jan 8.

β-Glucan reprograms neutrophils to promote disease tolerance against influenza A virus

Affiliations

β-Glucan reprograms neutrophils to promote disease tolerance against influenza A virus

Nargis Khan et al. Nat Immunol. 2025 Feb.

Erratum in

Abstract

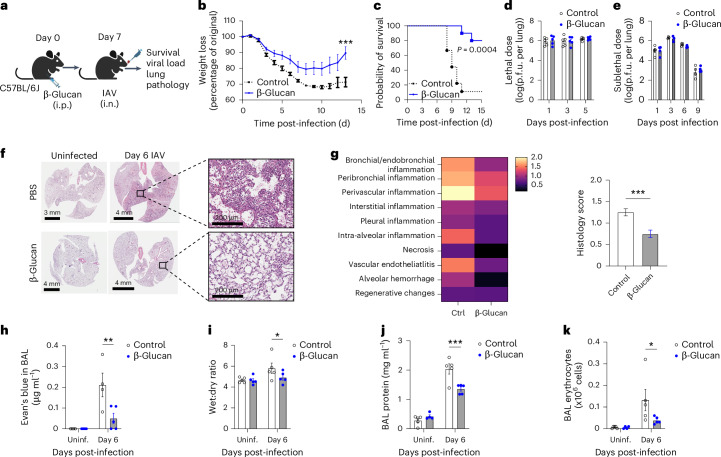
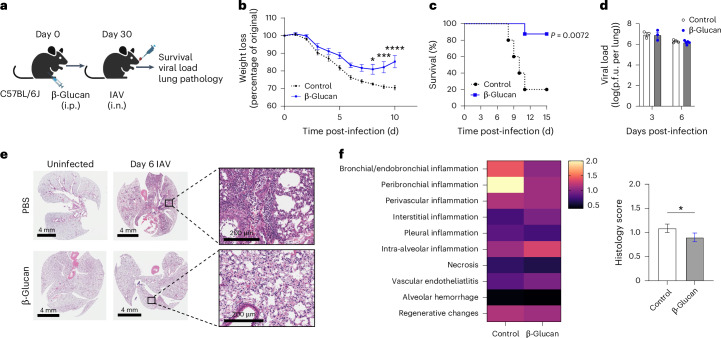
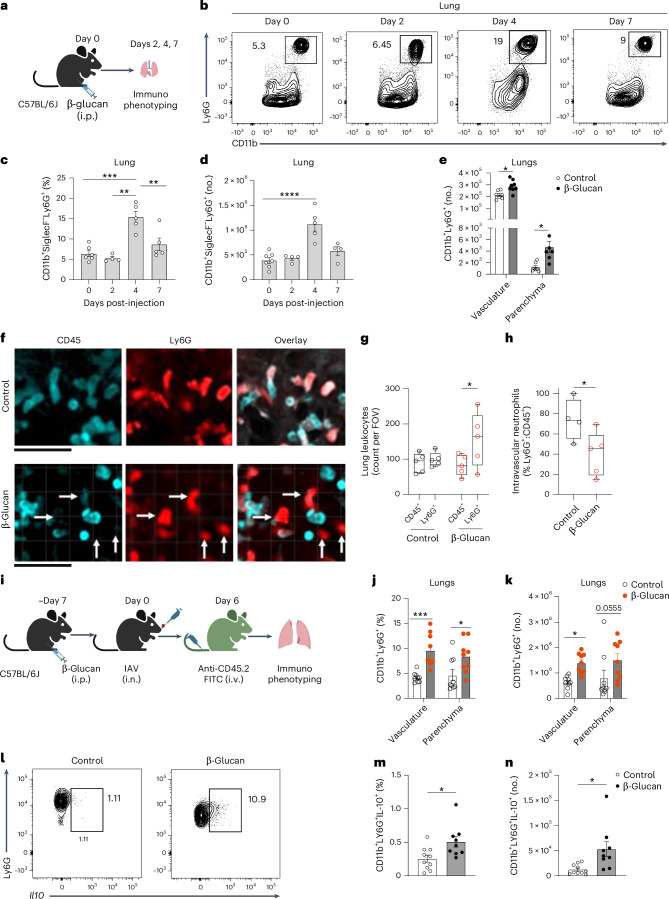
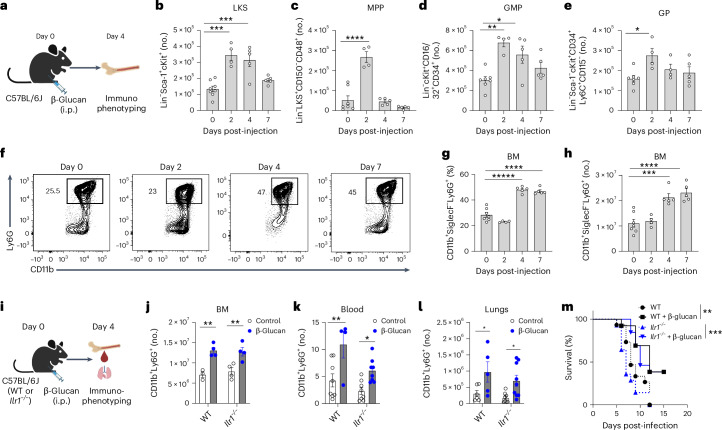
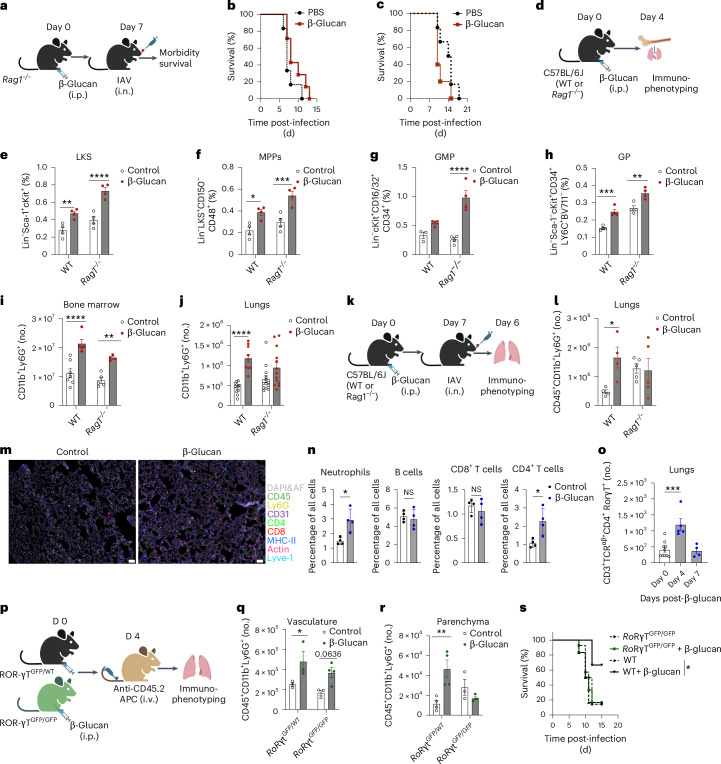
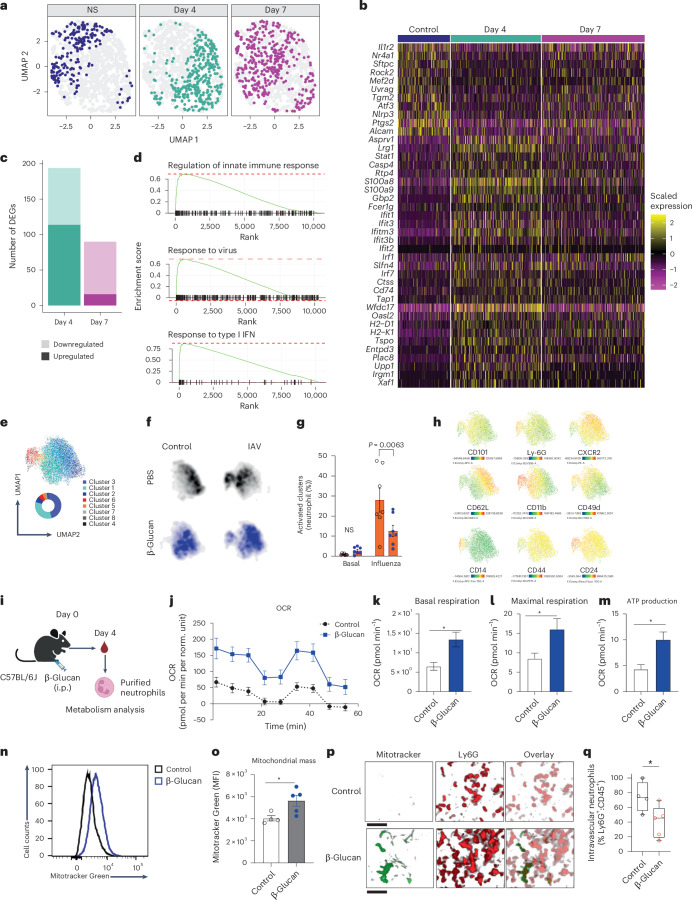
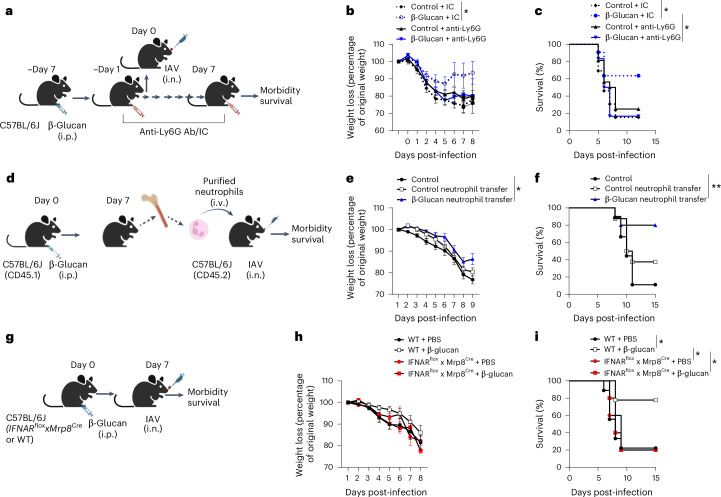
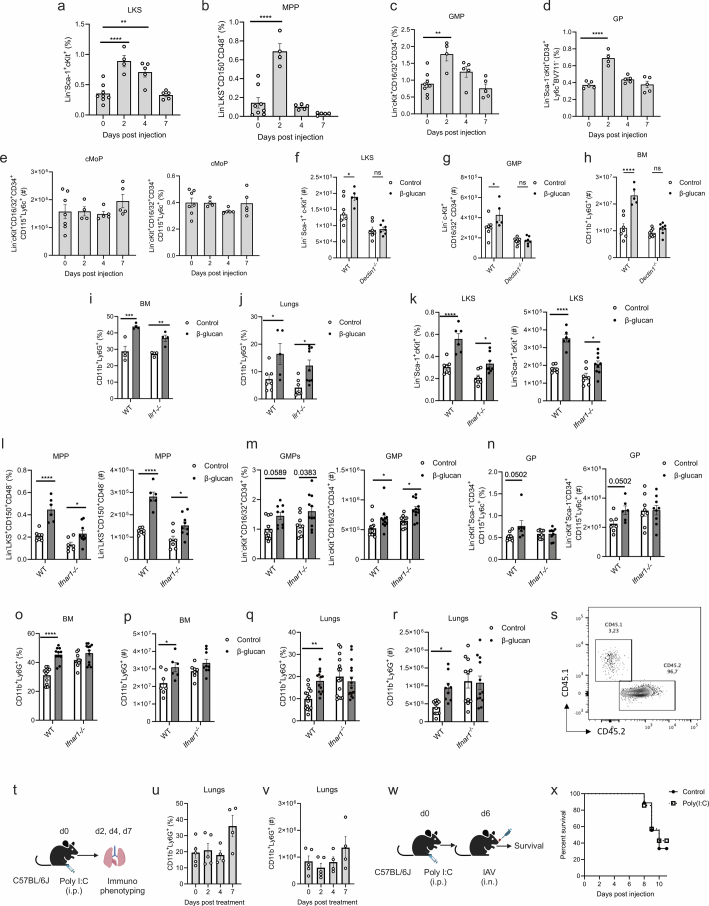
Disease tolerance is an evolutionarily conserved host defense strategy that preserves tissue integrity and physiology without affecting pathogen load. Unlike host resistance, the mechanisms underlying disease tolerance remain poorly understood. In the present study, we investigated whether an adjuvant (β-glucan) can reprogram innate immunity to provide protection against influenza A virus (IAV) infection. β-Glucan treatment reduces the morbidity and mortality against IAV infection, independent of host resistance. The enhanced survival is the result of increased recruitment of neutrophils via RoRγt+ T cells in the lung tissue. β-Glucan treatment promotes granulopoiesis in a type 1 interferon-dependent manner that leads to the generation of a unique subset of immature neutrophils utilizing a mitochondrial oxidative metabolism and producing interleukin-10. Collectively, our data indicate that β-glucan reprograms hematopoietic stem cells to generate neutrophils with a new 'regulatory' function, which is required for promoting disease tolerance and maintaining lung tissue integrity against viral infection.


Conflict of interest statement

Competing interests: The authors declare no competing interests.

Figures

Fig. 1
Fig. 1. β-Glucan treatment induces disease tolerance against IAV.
a, Mice were infected with IAV at day 7 post-β-glucan treatment i.p. b,c, Weight loss (b) and survival (c) monitored over time (n = 10) of mice infected with a lethal dose of IAV (120 p.f.u.). d, Viral burden quantified at several time points post-IAV infection with a lethal dose (n = 5). e, Viral burden quantified at several time points post-IAV infection with a sublethal dose (50 p.f.u.; n = 5). f, Representative micrographs of lung histology from β-glucan (7 d)-treated mice stained with H&E day 6 post-IAV infection.Scale bar, 200 μm. g, Lung histology scoring at day 6 post-IAV infection after β-glucan treatment (n = 5). hk, Mice were infected with a sublethal dose of IAV at day 7 post-β-glucan, followed at day 6 post-IAV infection: quantification of endothelial permeability (h), pulmonary edema (i), BAL protein (j) and BAL erythrocytes (k) (n = 5). Data are represented as mean ± s.e.m. Data were analyzed using two-tailed, unpaired Student’s t-test (g) or two-way ANOVA followed by Šidák’s multiple-comparison tests (b and hk). Survival was monitored by a log(rank) test (c). *P < 0.05, ***P < 0.001, ****P < 0.0001. i.n., intranasally; uninf., uninfected. Illustrations in a created using BioRender.com. Source data
Fig. 2
Fig. 2. β-Glucan treatment promotes long-lasting disease tolerance against IAV infection.
a, Mice were infected with IAV with a lethal (survival and weight loss) or sublethal dose (viral load and pathology) at day 30 post-β-glucan treatment i.p. b,c, Weight loss (b) and survival (c) monitored over time (n = 10). d, Viral load quantified at days 3 and 6 post-infection (n = 4). e, Representative micrographs of lung histology from β-glucan (30 d)-treated mice stained with H&E at day 6 post-IAV infection. Scale bar, 200 μm. f, Lung histology at day 6 post-IAV infection after β-glucan long treatment (n = 5–6). Data are represented as mean ± s.e.m. Data were analyzed using two-tailed, unpaired Student’s t-test (f) or two-way ANOVA followed by Šidák’s multiple-comparison tests (d and e). Survival was monitored by a log(rank) test (c). *P < 0.05, ***P < 0.001, ****P < 0.0001. Illustrations in a created using BioRender.com. Source data
Fig. 3
Fig. 3. β-Glucan treatment increases the recruitment of neutrophils to the lungs.
ad, Mice were treated with β-glucan and immune cells were assessed in the lungs at several time points (a). Representative FACS plots (b), frequency (c) and total cell counts (d) of neutrophils in the lungs are measured at days 2, 4 and 7 post-β-glucan treatment (n = 4–6). e, Intravascular staining at day 4 post-β-glucan treatment: total cell count of neutrophils in the vasculature and parenchyma of lungs (n = 5). f, Representative lung confocal intravital microscopy images comparing Ly6G-TdTom mice receiving saline i.p. versus mice treated with β-glucan i.p. Intravenous, fluorescently conjugated, anti-CD45 monoclonal antibody was used to mark intravascular leukocytes. Arrows highlight examples of Ly6G+CD45- cells. Scale bars, 50 μm. g, Visualized cells from the lung intravital images quantified by expression of either CD45 or Ly6G from control or β-glucan-treated mice. The horizontal lines represent the median, the bounds of the boxes indicate the 25th and 75th percentiles and the whiskers represent the minima and maxima. Each dot representing an individual sample (n = 5). h, The percentage of intravascular neutrophils in lung imaging was quantified as Ly6G+CD45+/total Ly6G+ (n = 5). i, Intravasculature staining at day 6 post-IAV infection. j,k, Frequency (j) and total cell counts (k) of neutrophils in the vasculature and parenchyma of lungs day 6 post-IAV infection (n = 5). l, Il10GFP reporter mice infected with IAV at day 7 post-β-glucan. The lungs were collected 6 d post-IAV infection. Representative FACS plots show Il10GFP+Ly6G+ cells as a percentage of Ly6G+ cells. m,n, Frequency (m) and total cell counts (n) of Il10-expressing neutrophils (n = 5, data pooled from two individual experiments). Data are represented as mean ± s.e.m. Data were analyzed using unpaired, two-tailed Student’s t-test (m and n), one-way ANOVA followed by Tukey’s multiple-comparison test (c and d) or two-way ANOVA followed by Šidák’s multiple-comparison test (e, g, h, j and k).*P < 0.05, **P < 0.01, ***P < 0.001, ****P < 0.0001. FOV, field of view. Illustrations in a and i created using BioRender.com. Source data
Fig. 4
Fig. 4. β-Glucan increases granulopoiesis and is independent of IL-1 signaling.
a, Mice were treated with β-glucan, HSCs or progenitors and immune cells were assessed in the BM at days 2, 4 and 7 post-β-glucan treatment. be, Expansion of LKSs (b), MPPs (c), GMPs (d) and GPs (e) in the BM (n = 5). fh, Representative FACS plots (f), frequency (g) and total cell counts of neutrophils (h) in the BM (n = 5). i, C57BL/6 (WT and Il1r/) mice were treated with β-glucan. jl, Neutrophils in the BM (j), blood (k) and lungs (l) at day 4 post-β-glucan treatment (n = 5). Data are pooled from two individual experiments. m, Survival of Il1r/ or WT mice after β-glucan treatment following IAV infection (lethal dose) at day 7 (n = 10). Data are represented as mean ± s.e.m. Data were analyzed using one-way ANOVA followed by Tukey’s multiple-comparison test (be, g and h) or two-way ANOVA followed by Šidák’s multiple-comparison tests (jl). Survival was monitored by a log(rank) test (m). *P < 0.05, **P < 0.01, ***P < 0.001, ****P < 0.0001. Illustrations in a and i created using BioRender.com. Source data
Fig. 5
Fig. 5. β-Glucan-mediated granulopoiesis requires type I IFN signaling.
WT and Ifnar1/ mice were treated with β-glucan. a,b, Representative FACS plots (a) and total cell counts (b) of neutrophils in the BM. c, Frequency of neutrophils in the blood (n = 5). d,e, Representative FACS plots (d) and total cell counts of neutrophils (e) in the lungs at day 4 post-β-glucan treatment (n = 8). f,g, Survival of C57BL/6 WT (f) or Ifnar1/ (g) mice after β-glucan treatment following IAV infection (lethal dose) at day 7. h, Mouse chimera model. i,j, Weight loss (i) and survival (j) of CD45.1 chimeric mice reconstituted with Ifnar1/ (CD45.2) BM after β-glucan treatment following IAV infection (lethal dose) on day 7 (n = 10). Data are represented as mean ± s.e.m. Data were analyzed using two-way ANOVA followed by Šidák’s multiple-comparison tests (b, c, e and i). Survival was monitored by a log(rank) test (g and j). *P < 0.05, **P < 0.01, ***P < 0.001, ****P < 0.0001. Illustrations in f and h created using BioRender.com. Source data
Fig. 6
Fig. 6. T cells are required for the recruitment of β-glucan-trained neutrophils to the lung tissue.
ac, Rag1/ mice (a) were infected with IAV lethal dose (b) and sublethal dose (c) at day 7 post-β-glucan treatment to assess survival (n = 10). d, C57BL/6 (WT and Rag1/) mice were treated with β-glucan. eh, Expansion of LKSs (e), MPPs (f), GMPs (g) and GPs (h) assessed in the BM on day 4 post-β-glucan treatment (n = 5). i,j, Total cell counts of neutrophils in BM (i) and lungs (j) on day 4 post-β-glucan treatment (n = 8). k, C57BL/6 (WT and Rag1/) mice infected with IAV infection on day 7 post-β-glucan. l, Total cell counts of neutrophils in the lungs at day 6 post-IAV infection (n = 4). m, Mice were treated with β-glucan and after 4 d lungs subjected to MACSima imaging. n, Quantification of corresponding pulmonary immune cells from MACSima imaging (n = 4). o, Quantification of RORγt CD4+ T cells after β-glucan treatment (n = 5). p, Intravascular staining of RORγtGFP/GFP or RORγtWT/GFP at day 4 post β-glucan treatment. q,r, Total cell counts of neutrophils in the lung vasculature (q) and parenchyma (r) (n = 4). s, RORγtGFP/GFP or RORγtWT/GFP mice infected with IAV (lethal dose) at day 7 post-β-glucan treatment to assess survival. Data are represented as mean ± s.e.m. Data were analyzed using two-tailed, unpaired Student’s t-test (n), one-way ANOVA followed by Tukey’s multiple-comparison test (o) and two-way ANOVA followed by Šidák’s multiple-comparison tests (ej, l, q and r). Survival was monitored by a log(rank) test (b, c and s). *P < 0.05, **P < 0.01, ***P < 0.001, ****P < 0.0001. NS, not significant. Illustrations in a, d, k and p created using BioRender.com. Source data
Fig. 7
Fig. 7. β-Glucan training induces robust changes in neutrophils phenotype and metabolism.
a, UMAP of 925 lung neutrophils isolated from nontreated mice and mice challenged with β-glucan for 4 and 7 d. b, Heatmap of scaled expression levels of select DEGs (FDR < 0.05) at day 4 post β-glucan treatment. c, Number of DEGs 4 and 7 d after β-glucan treatment. d, Enrichment plots of representative upregulated (FDR < 0.05) GO pathways 4 d after β-glucan treatment. eh, Mice were treated with β-glucan 6 d before influenza infection. On day 9 post-β-glucan treatment, lung neutrophils from infected and noninfected mice were extracted and their surface phenotype was assessed by spectral flow cytometry. e, UMAP of CD11b+Ly6G+ neutrophils with and without influenza infection. Neutrophils separate in eight Flowsom Clusters. f, UMAP from b projected for the four experimental groups (PBS ± influenza, black and β-glucan ± influenza, dark blue). Clusters 5, 6 and 8 expand dramatically during influenza infection. g, Quantification of neutrophil present in influenza-driven clusters (clusters 5, 6 and 8). h, Mean fluorescence intensity (MFI) of selected markers projected on the UMAP from f. Influenza-driven clusters exhibit an activated phenotype (CD14high, CD24high CD11bhigh, CD62Llow, CD49dlow). UMAPs are based on 16 surface markers: CD45, Ly6G, CD101, CXCR2, CXCR4, CD62L, CD24, CD11b, CD49d, CD44, CCR2, Ly6C, CD80, MHC-II, CD16, CD14 (n = 7). i, Mice were treated with β-glucan. Neutrophils were purified from blood on day 4 post-βd-glucan treatment. jm, Neutrophils’ cellular metabolism determined by Seahorse (j), basal respiration (k), maximal respiration (l) and ATP production (m). n,o, Representative histogram plot (n) and quantification (MFI) (o) for mitochondrial mass using Mitotracker Green dye in the neutrophils of β-glucan-treated mice (n = 4). p, Representative three-dimensional reconstructed lung intravital microscopy images from control or β-glucan-treated Ly6G-TdTom mice. Mitotracker Green dye was given i.v. before imaging. Scale bars, 50 μm. q, Mitochondria bright neutrophils quantified (n = 4). The horizontal lines represent the median, the bounds of the boxes indicate the 25th and 75th percentiles and the whiskers represent the minima and maxima. Each dot represents an individual sample (n = 4). Data are represented as mean ± s.e.m. Data were analyzed using two-way ANOVA followed by Šidák’s multiple-comparison tests (j) and two-tailed, unpaired Student’s t-test (km, o and q). *P < 0.05, **P < 0.01, ***P < 0.001. Norm., normalized. Illustration in i created using BioRender.com. Source data
Fig. 8
Fig. 8. β-Glucan-driven protection against IAV is dependent on trained neutrophils.
a, Schematic of neutrophil depletion experiment using anti-Ly6G antibodies. Mice were infected with IAV (lethal dose) at day 7 post-β-glucan treatment. Anti-Ly6G antibody or isotype control (IC) was administered (i.p.) on day 1 before infection and daily until day 7. b,c, Weight loss (b) and survival (c) monitored over time (n = 10). d, Schematic of adoptive transfer experiment. Neutrophils were isolated from CD45.1 control or β-glucan donor mice and adoptively transferred into naive CD45.2 recipient mice, which were infected with a lethal dose of IAV. e,f, Weight loss (e) and survival (f) monitored over time (n = 10). g, IFNARflox × Mrp8Cre mice were infected with IAV (lethal dose) at day 7 post-β-glucan. h,i, Weight loss (h) and survival (i) monitored over time (n = 8). Data are represented as mean ± s.e.m. Data were analyzed using two-way ANOVA followed by Šidák’s multiple-comparison tests (b, e and h). Survival was monitored by a log(rank) test (c, f and i). *P < 0.05, **P < 0.01. Illustrations in a, d, g created using BioRender.com. Source data
Extended Data Fig. 1
Extended Data Fig. 1. Gating Strategy.
(a) Cells were gated for FSC-A against SSC-A. Doublets were excluded using FSC-H against FSC-A. Viable CD45+ cells were gated, and within the viable CD45+ cells, cells were gated as CD11b, excluding SiglecF+ cells. CD11b and Ly6G double-positive cells were gated as neutrophils. (b) Cells were gated for FSC-A against SSC-A and doublets were excluded using FSCH against FSC-A as shown in (a). Viable cells were gated, and lineage-committed cells were excluded. Within the lineage-negative population, cells were gated as CD127+ and CD127-. Lin-CD127- population was further gated as LKS-defined as double positive for cKit and Sca-1, and cKit is gated as Sca-1 negative and cKit positive. Gated on the LKS population, cells were divided into LT-HSC, STHSC and MPP based on CD150 and CD48 expression. C-Kit+ Sca-1- cells were further gated based on CD34 and CD16/32 to define CMP, GMP and MEP. (c) Finally, in another set of experiments, Lineage+ cells and then Sca-1+ cells were excluded. The remaining cells were subdivided into cKit+ CD16/32+ (II) and cKit+ CD16/32- groups. In the cKit+CD16/32 + , cells were further gated on CD34+ Flt3- cells. Within this fraction, Ly6C + CD115- cells were the GP, and Ly6C + CD115+ were cMoP.
Extended Data Fig. 2
Extended Data Fig. 2. β-glucan treatment promotes granulopoiesis.
(a) Representative FACS plots for CD64 expression on gated CD11b+Ly6G+ neutrophils at 4 days post β-glucan, and (b) 6 days post-IAV infection. (c) Frequency of Ly6G+ CD64+ macrophages within CD11b+ Ly6G+ cells (n = 5). Mice were treated with β-glucan and immune cells were assessed on day 4 in the lungs. Frequency and total cell count of myeloid cells (d); and adaptive cells (e) in the lungs of β-glucan-treated mice. (f-j) Kinetics of neutrophils in the blood (f) spleen (g, h) and peritoneum (i, j) post β-glucan treatment. FACS plots show indicates the frequency of viable cells. (k) Intravascular staining at day 4 post-β-glucan treatment. Frequency of neutrophils in the vasculature and parenchyma of the lungs (n = 5). Data represented as mean ± SEM. Data were analyzed using one-way ANOVA followed by Sidak’s multiple comparisons tests (f, h, j) or two-way ANOVA followed by Sidak’s multiple comparisons tests (d, e, k). * p < 0.05, ** p < 0.01, *** p < 0.001, **** p < 0.0001. Source data
Extended Data Fig. 3
Extended Data Fig. 3. β-glucan treatment does not induce the expansion of other immune cells following IAV infection.
(a) Mice were infected with IAV at day7 post β-glucan treatment. Frequency and total cell number in the lung parenchyma of neutrophils (b, c), monocytes (d), macrophages (e), T cells (f) and B cells (g) (n = 5). (h) Il10GFP reporter mice were infected with IAV at day7 post β-glucan treatment. Lungs were collected 6 days post IAV-infection. Frequency and total cell number of Il10-expressing cells (i), macrophages (j), monocytes (k), T cells (l) and B cells (m) in the lungs (n = 9). Data represented as mean ± SEM. Data were analyzed using two-tailed unpaired t-test (i-m) or two-way ANOVA followed by Sidak’s multiple comparisons tests(b-g). * p < 0.05, ** p < 0.01, *** p < 0.001, **** p < 0.0001. Illustrations in a and h created using BioRender.com. Source data
Extended Data Fig. 4
Extended Data Fig. 4. β-glucan-driven granulopoiesis is dependent on type I IFN signalling.
(a-e) Kinetics of LKS/progenitors in the BM of β-glucan treated mice. Frequency of LKS (a), MPP (b), GMP (c), GP (d), cMoP (e) in the BM of β-glucan treated mice (n = 4, data pooled from two individual experiments). (f-h) Dectin-1-/- mice were treated with β-glucan. Total cell number of LKS (f), GMP (g) and neutrophils (h) at day 4 (n = 5). C57BL/6 (WT and Il1r-/-) mice were treated with β-glucan. Frequency of neutrophils in the BM (i); and lungs (j) of β-glucan treated mice at day 4. (k-r) WT and Ifnar1-/- mice were treated with β-glucan. Frequency and total cell counts of LKS (k); MPP (l); GMP (m); and GP (n) in the BM at day 4 post-glucan treatment (n = 5). Frequency of neutrophils in the BM (o, p) and lungs (q, r) at day 4 post β-glucan treatment (n = 5, data pooled from two individual experiments). (s) Chimerism was confirmed via flow cytometry. (t-v) Mice were treated with PolyI:C (i.p.). Frequency (u) and total cell counts (v) of neutrophils in the lungs post-PolyI:C (n = 4). (w, x) Mice were infected with IAV (lethal dose) 6 days post-PolyI:C (w), survival was monitored overtime (x) (n = 10). Data represented as mean ± SEM. Data were analyzed using one-way ANOVA followed by Sidak’s multiple comparisons tests (a-e, u, v) or two-way ANOVA followed by Sidak’s multiple comparisons tests (f-r). Survival was monitored by a log-rank test (x). * p < 0.05, ** p < 0.01, *** p < 0.001, **** p < 0.0001. Illustrations in t and w created using BioRender.com. Source data
Extended Data Fig. 5
Extended Data Fig. 5. Localization of trained neutrophils is dependent on adaptive immune cells.
(a-h) C57BL/6 (WT and Rag1-/-) mice were treated with β-glucan. Frequency of neutrophils in the BM (a) and lungs (b); frequency and total cell counts of neutrophils in the peritoneum (c, d); spleen (e, f) at day 4 post-glucan treatment. Frequency of neutrophils in the parenchyma (g) and vasculature (h) of lungs at day 4 post β-glucan treatment (n = 4, data pooled from two individual experiments). (i) Mice were treated with β-glucan, frequency of Rorγt cells CD4+ were quantified at several timepoints post-treatment (n = 5). (j) RORγtGFP/GFP or RORγtWT/GFP mice were treated with β-glucan. Frequency of neutrophils in the BM at day 4 post-glucan treatment (n = 4). (k) RORγtGFP/GFP or RORγtWT/GFP mice were infected with IAV at day 7 post β-glucan. Frequency and total cell counts of neutrophils were quantified in the lung parenchyma (l, m) and vasculature (n, o) at day 6 post-IAV infection (n = 4). Data represented as mean ± SEM. Data were analyzed using one-way ANOVA followed by Sidak’s multiple comparisons tests (i) or two-way ANOVA followed by Sidak’s multiple comparisons tests (a-h, j, l-o). * p < 0.05, ** p < 0.01, *** p < 0.001, **** p < 0.0001. Illustration in k created using BioRender.com. Source data
Extended Data Fig. 6
Extended Data Fig. 6. β-glucan treatment augments mitochondrial respiration.
(a) UMAP of CD11b+ Ly6G+ neutrophils from control and β-glucan-treated mice with relative expression of surface markers quantified by MACSima segmentation 4 days post β-glucan (n = 4). (b-e) Mice were treated with β-glucan and infected with IAV after 6 days. 9 days post β-glucan treatment, blood neutrophils were purified and analyzed for spectral flow cytometry. (b) UMAP of CD11b+ Ly6G+ neutrophils from the blood of control and β-glucan treated mice with and without influenza infection. Neutrophils separate in two main Flowsom Clusters (cluster 1, grey and cluster 2, Cyan, 96% of neutrophils) (c) UMAP from A is projected for the 4 experimental group (PBS +/- Influenza, black and β-glucan +/- Influenza, Dark Blue). Neutrophil density repartition shows a shift of neutrophils in β-glucan treated group from Cluster 1 to Cluster 2. (d) Quantification of neutrophil repartition. (e) MFIs of selected markers are projected on the UMAP from (b). Histograms show MFIs from Cluster 1 (grey) and cluster 2 (Cyan). Cluster 2 neutrophils exhibit lower expression of classical maturation markers CD101, Ly6G and CXCR2 and present with a less activated phenotype (CD62Lhigh, CD11blow, CD49dlow) (n = 7). (f, g) Mice were infected with IAV at day 7 post β-glucan. Frequency and counts of immature neutrophils were quantified at several days post-IAV infection (n = 5). (h, i) Mice were infected with IAV at day 7 post β-glucan. Splenic neutrophils were purified at day 4 post IAV and subjected to Bulk-RNAseq. (h) Network visualization of GO-terms significantly enriched among genes whose response to IAV was primed by β-glucan exposure (p < 0.05). Each circle represents an enriched GO term (p.adj < 0.05). The larger nodes with darker shading indicate a greater degree of significance. Connections between nodes indicate similarity between terms. (i) Summary bubble plot of gene set enrichment analysis (GSEA) results. Genes were ordered by the rank statistic –log10(pval)*logFC for the effect of β-glucan priming on response to IAV infection and compared against Reactome gene sets. Circle size and shading is scaled to the normalized enrichment score (NES). All circles with a dark border have padj < =0.1. Red circles indicate that the pathway is increased in β-glucan primed samples and blue circles indicate that β-glucan-priming leads to an overall decrease in expression of the pathway. (j-m) Ifnar1-/- mice were treated with β-glucan. Neutrophils were purified from blood on day 4 post β-glucan treatment. Neutrophils’ cellular metabolism was determined by seahorse (j) and basal respiration (k). Representative histogram plot (l) and quantification (MFI) for mitochondrial mass (m) using mitotracker green dye in the neutrophils from the lungs of β-glucan-treated Ifnar1-/- mice (n = 4). Data represented as mean ± SEM. Data were analyzed using two-tailed unpaired t-test (a,k m) or two-way ANOVA followed by Sidak’s multiple comparisons tests (j, f, g). * p < 0.05, ** p < 0.01, *** p < 0.001, **** p < 0.0001. Source data
Extended Data Fig. 7
Extended Data Fig. 7. β-glucan mediated protection depends on trained neutrophils.
(a) FACS plots showing the depletion of neutrophils in the blood of mice treated with anti-LY6G depletion antibody based on Ly6G and CD11b expression. (b) FACS plots showing the depletion of neutrophils based on FSC/SSC back gating. (c-g) WT and Ccr22-/- mice were treated with β-glucan. Frequency and absolute number of monocytes and neutrophils in the BM (c, d); blood (e); and lungs (f, g) at day 4 post β-glucan treatment (n = 4, data pooled from two individual experiments). (h-j) C57BL/6 (WT and Ccr2-/-) mice were infected with IAV (lethal dose) at day 7 post β-glucan treatment. Weight loss (i) and survival (j) was monitored over time (n = 10). (k) Adoptive transfer of CD45.1 neutrophils confirmed in the lungs of CD45.2 recipient mice. (l-m) IFNARflox x Mrp8Cre mice were treated with β-glucan for 4 days, frequency and total cell counts of LKS+ cells (m, n), GMPs (o, p) and GPs (q, r) were quantified in the BM (n = 4). Data represented as mean ± SEM. Data were analyzed using two-tailed unpaired t-test (m-r) or two-way ANOVA followed by Sidak’s multiple comparisons tests (c-g, i). Survival was monitored by a log-rank test (j). * p < 0.05, ** p < 0.01, *** p < 0.001, **** p < 0.0001. Illustrations in h and l created using BioRender.com. Source data

References

    1. Medzhitov, R., Schneider, D. S. & Soares, M. P. Disease tolerance as a defense strategy. Science335, 936–941 (2012). - PMC - PubMed
    1. Meunier, I., Kaufmann, E., Downey, J. & Divangahi, M. Unravelling the networks dictating host resistance versus tolerance during pulmonary infections. Cell Tissue Res.367, 525–536 (2017). - PMC - PubMed
    1. Divangahi, M. Are tolerance and training required to end TB? Nat. Rev. Immunol.18, 661–663 (2018). - PubMed
    1. Pernet, E., Downey, J., Vinh, D. C., Powell, W. S. & Divangahi, M. Leukotriene B4-type I interferon axis regulates macrophage-mediated disease tolerance to influenza infection. Nat. Microbiol.4, 1389–1400 (2019). - PubMed
    1. Downey, J. et al. Mitochondrial cyclophilin D promotes disease tolerance by licensing NK cell development and IL-22 production against influenza virus. Cell Rep.39, 110974 (2022). - PubMed

LinkOut - more resources