. 2025 Feb;26(2):279-293.
doi: 10.1038/s41590-024-02042-1. Epub 2025 Jan 8.

A multi-kinase inhibitor screen identifies inhibitors preserving stem-cell-like chimeric antigen receptor T cells

Affiliations

A multi-kinase inhibitor screen identifies inhibitors preserving stem-cell-like chimeric antigen receptor T cells

Feifei Song et al. Nat Immunol. 2025 Feb.

Abstract

Chimeric antigen receptor T cells (CAR T cells) with T stem (TSCM) cell-like phenotypic characteristics promote sustained antitumor effects. We performed an unbiased and automated high-throughput screen of a kinase-focused compound set to identify kinase inhibitors (KIs) that preserve human TSCM cell-like CAR T cells. We identified three KIs, UNC10225387B, UNC10225263A and UNC10112761A, that combined in vitro increased the frequency of CD45RA+CCR7+TCF1hi TSCM cell-like CAR T cells from both healthy donors and patients with cancer. KI-treated CAR T cells showed enhanced antitumor effects both in vitro and in vivo in mouse tumor models. The KI cocktail maintains TSCM cell-like phenotype preferentially in CAR T cells originating from naive T cells and causes transcriptomic changes without arresting T cell activation or modulating the chromatin organization. Specific kinases, ITK, ADCK3, MAP3K4 and CDK13, targeted by the KI cocktail in a dose-dependent manner are directly associated with the preservation of TSCM cell-like CAR T cells. Knockdown of these kinases individually or in combination enriches for TSCM cell-like CAR T cells, but only CAR T cells generated in the presence of the KI cocktail show robust expansion and differentiation on stimulation with tumor cells. Overall, transient pharmacological inhibition of strategically targeted kinases maintains stem-like features in CAR T cells and improves their antitumor activity.


Conflict of interest statement

Competing interests: G.D. serves in the SAB of NanoCells, Estella, Arovella and Outspace Bio and is cofounder of Persistence Bio. A patent application has been submitted for the use of the identified KIs. Y.X. consults for Lumosa Therapeutics. The remaining authors declared no potential competing interests.

Figures
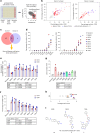
Fig. 1
Fig. 1. Automated high-throughput screening of KIs in activated human T cells.
a, Schematic of the automated high-throughput screening. b,c, Percentage of activity of each KI that passes exclusion criteria in CD4 and CD8 T cells from donor nos. 1 and 2 (b). Gray dots represent non-hit compounds, red dots (n = 80) hits identified in donor 1, blue dots (n = 24) hits identified in donor 2 and purple dots (n = 15) hits identified in both donors 1 and 2. Panel (c) illustrates KIs indentified in both donors. d, Summary of the activity of seven KIs that showed dose–response effects in an automated dose–response assay in both CD8 and CD4 T cells. Data are shown as the mean (n = 2 independent T cell donors). Nonstim, nonstimulated T cells. eg, Phenotypic transition from CD45RA+CD45RO to CD45RACD45RO+ (e), CD69 expression in both CD8 and CD4 T cells (f) and cell counts (g) of T cells treated with the KIs shown in d. Data are shown as individual values and the mean ± s.d. (n = 3 independent T cell donors). P values were determined using two-sided, paired Student’s t-test. h, Rank score of the seven KIs based on their activity in blocking differentiation and impact on T cell activation and T cell expansion shown in eg. i, Chemical structure and putative kinase targets of the KIs UNC10225387B, UNC10225263A and UNC10225761A. Source data
Fig. 2
Fig. 2. KIs preserve TSCM cell-like CAR.CD19 T cells.
a, Schematic of the generation of CAR.CD19 T cells in vitro using a cocktail of UNC10225387B, UNC10225263A and UNC10225761A KIs at 0.75 μM. DMSO was used as control. b,c, CAR expression (b) and composition of CD4 and CD8 T cells (c) assessed by FACS in CAR.CD19 T cells at day 10 (n = 7 independent T cell donors). d,e, Representative FACS plots (d) and percentage (e) of memory cell subsets defined using CD45RA and CCR7 as markers in CD4 and CD8 CAR.CD19 T cells (n = 8 independent T cell donors). f, Representative FACS plots showing the expression of CD95, CD122 (IL-2Rβ), CD127 (IL-7Rα) and CD62L in CD4 and CD8 CAR.CD19 T cells gated on the CD45RA+CCR7+ cells (n = 3 independent T cell donors). g,h, MFI of TCF1 (g) and mRNA expression of TCF7 (h) in CD4 and CD8 CAR.CD19 T cells generated in DMSO or KIs measured by FACS and RT–qPCR, respectively (n = 4 in g and n = 3 independent T cell donors in h). a.u., arbitrary units. i, Cell counts of CAR.CD19 T cells generated in the presence of DMSO or KIs. The data are shown as mean ± s.e.m. (n = 7 independent T cell donors). j,k, CAR.CD19 T cells were generated from sorted naive (j) or memory (k) T cells in the presence of DMSO or KIs. The percentage of memory cell subsets in CAR.CD19 T cells obtained from TN cells (j) or memory T cells (k) was determined by FACS (n = 4 independent T cell donors). The data are shown as individual values and mean ± s.d. except where indicated. P values were determined using two-sided, paired Student’s t-test for bh and jk and two-sided Wilcoxon’s matched-pair, signed-rank test for i. Source data
Fig. 3
Fig. 3. KIs enhance antitumor activity of CAR.CD19 T cells in vitro.
a,b, CAR.CD19 T cells generated in DMSO or KIs were co-cultured with CD19+ Daudi cells at 1:2 effector:target (E:T) ratio. On day 4, residual tumor cells (a) and T cells (b) were counted by FACS (n = 7 in a and n = 9 independent T cell donors in b). c, Measurement of IL-2 and IFNγ in the supernatant of CAR.CD19 T cells co-cultured with Daudi cells after 24 h (n = 8 independent T cell donors.) d, CTV-labeled CAR.CD19 T cells co-cultured with Daudi cells at 1:2 E:T ratio for 5 d and with CTV dilution analyzed by FACS. A representative CTV dilution plot was gated on either CD4 or CD8 T cells (n = 3 independent T cell donors). e, CAR.CD19 T cells repeatedly cultured with Daudi cells at 1:1 E:T ratio every 2 d, for 3 consecutive rounds. T cells were counted by FACS after each round (n = 8 independent T cell donors). f,g, Intracellular staining for granzyme B (f), tumor necrosis factor (TNF), IFNγ and IL-2 (g) in CAR.CD19 T cells after the third round of stimulation with tumor cells as described in e (n = 7 independent T cell donors). hj, Expression of TOX (h and i) and inhibitory receptors TIM3, LAG3 and PD1 (j) in CAR.CD19 T cells after the third round of stimulation with tumor cells (n = 3 independent T cell donors). The data are shown as individual values and the mean ± s.d. P values were determined using two-sided, paired Student’s t-test for e, g, i and j and using two-sided Wilcoxon’s matched-pair, signed-rank test for a, b, c and f. Source data
Fig. 4
Fig. 4. KIs enhance antitumor activity and long-term persistence of CAR.CD19 T cells in in vivo tumor mouse model.
a,b, Representative IVIS imaging (a) and tumor BLI kinetics (b) of NSG mice engrafted with the FFluc-Daudi cells and treated with a suboptimal dose of CAR.CD19 T cells (2 × 106 cells) generated in DMSO or KIs, NT, nontransduced T cells. Mice treated with CAR.CD19 T cells were rechallenged with 2 × 106 Daudi cells at day 18. The data in b summarize experiments from two independent T cell donors (n = 6 mice in the NT group, n = 8 mice in the DMSO or KI group). The arrow indicates the time of tumor rechallenge in mice receiving CAR.CD19 T cells. c, Kaplan–Meier survival curve of the mouse tumor model described in b. The data summarize experiments from two independent T cell donors (n = 6 mice in the NT group, n = 8 mice in the DMSO or KI group). d,e, Tumor BLI kinetics (d) and Kaplan–Meier survival curve (e) of Daudi-bearing mice infused with low-dose CAR.CD19 T cells (1 × 106 cells per mouse) without tumor rechallenge. The data summarize experiments from two independent T cell donors (n = 4 mice in the NT group, n = 8 mice in the DMSO or KI group). fh, Daudi-bearing mice treated with CAR.CD19 T cells euthanized 12 d after CAR T cell treatment to assess CAR T cell persistence and composition: counts of CAR.CD19 T cells (f) and CD45RA+CCR7+ CAR T cells (g) in the spleens and percentage of CD45RA+CCR7+ CAR T cells in the bone marrow (h). The data summarize experiments from two independent T cell donors and are shown as values of individual animals and mean ± s.d. (n = 7 in the DMSO group, n = 6 in the KI group). P values were determined using two-sided, unpaired Student’s t-test for b, d and fh and log(rank) test for c and e. In vivo experiments described in ac and d–e were obtained using IVIS Kinetic and IVIS spectrum In Vivo Imaging Systems, respectively. Source data
Fig. 5
Fig. 5. Multiple kinase inhibition is required to preserve TSCM cell-like CAR T cells.
a, Schematics of the MIB–MS in Jurkat cells incubated with the KIs UNC10225263A, UNC10225761A or UNC10225387B at 0.75 µM, 2.0 µM or DMSO. b, Kinases showing dose-dependent inhibition by UNC10225263A, UNC10225387B and UNC10225761A (n = 3 replicates for UNC10225263A and UNC10225387B and n = 2 replicates for DMSO and UNC10225761A). c, Jurkat cells pre-incubated with DMSO or UNC10225263A, UNC10225761A or UNC10225387B KI (2 µM) for 6 h and then activated with 10 µg ml−1 of agonistic CD3 mAb and crosslinking secondary antibody at 37 °C for 5 min. Phosphorylation of TCR signaling molecules was measured by phospho-flow (top) and immunoblot (bottom); β-actin was used as a loading control. d,e, CAR.CD19 T cells co-transduced with lentiviruses encoding shRNA-targeting specific kinases and the percentage of CD45RA+CCR7+ cells in CD4 or CD8 CAR.CD19 T cells determined by FACS. In d, shRNA targeted CLK3, STK17B, MAP3K7, AURKA, MINK1, CDK12 or ITK, whereas, in e, it targeted ADCK1, ADCK3, MAP3K4, CDK13 or TRIM28 (n = 8 independent T cell donors for d and n = 6 for e). The data represent two series of separated experiments, shNC indicates small hairpin negative control and was used as negative control. The blue bars indicate kinases with knockdown that caused a significant increase in TSCM cell-like CAR T cells. f, CAR.CD19 T cells co-transduced with a combination of lentiviruses encoding shRNA-targeting ADCK3 + ITK + MAP3K4 (C1) or ADCK3 + ITK + CDK13 (C2). The percentage of CD45RA+CCR7+ cells in CD4 or CD8 CAR.CD19 T cells was determined by FACS. CAR T cells co-transduced with the shNC and cultured in DMSO or KIs were used as controls (n = 8 independent T cell donors). gi, ShRNA (C1) (g), shRNA (C2) (h), shNC + DMSO and shNC + KIs CAR.CD19 (i) T cells stimulated with CD19+ Daudi tumor cells at 1:2 E:T ratio for 3 d. Relative fold expansion to shNC + DMSO group (h) and percentage of the CD45RA+CCR7+ cells (i) of CAR.CD19 T cells were measured by FACS (n = 5 in h and n = 4 independent T cell donors in i). The P values were determined using two-sided, paired Student’s t-test. Data are shown as individual values and the mean ± s.d. except in b where error bars are not shown. Source data
Fig. 6
Fig. 6. KIs induce TSCM cell signature in CAR T cells.
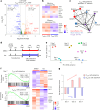
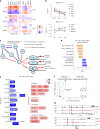
a, Volcano plot showing genes differentially expressed between FACS-sorted CD8 TSCM and TEM/TE cells in CAR.CD19 T cells (n = 3 independent T cell donors). Blue and red dots represent genes significantly upregulated in the TSCM and TEM/TE cell population, respectively. b, Heatmap of normalized gene counts of memory-associated and effector-associated TFs in TSCM and TEM/TE cells. c, TF regulatory network predicted by ChEA3 based on the top 200 signature genes upregulated in TSCM cells. The direction of the arrows indicates regulatory relationships between TFs and the thickness and darkness of arrows denote the number of ChIP–seq analyses and/or co-expression databases supporting the regulatory relationship. d, Timeline of sample collection for bulk RNA-seq analysis comparing transcriptome of CAR.CD19 T cells in DMSO or KIs. For each condition and time point, RNA was extracted from 2 × 106 cells and processed for downstream analysis. e, PCA of CAR.CD19 T cells at days 1, 3 and 7 post-addition of KIs or DMSO (n = 2 independent T cell donors). f, GSEA for the expression profiles of KIs versus DMSO on day 7 using gene signatures of TSCM and TEM/TE cells and heatmap representation of loading genes in each signature. NES, Normalized enrichment score. g, Net enrichment score of TSCM and TEM/TE cell signature of KIs versus DMSO on days 1, 3 and 7. Source data
Fig. 7
Fig. 7. KIs drive the development programs of TSCM CAR T cells without causing epigenetic alterations.
a,b, Heatmap representation (a) of the fold-change of memory-associated and effector-associated TFs in KIs versus DMSO on days 1, 3 and 7. Data in b are mean log2(fold-change) (log2(FC)) of expression of memory or effector TFs from two independent T cell donors. c, Regulatory relationship of memory-associated TFs upregulated by KIs on day 1. d, GSEA for the expression profiles of KI versus DMSO on day 1 using Hallmark gene sets. e, Heatmap representation of genes involved in glycolysis and OXPHOS/electron transport chains (ETCs) in KIs versus DMSO on day 3. f,g, ATAC–seq analysis performed on TN cells at time 0 and CAR.CD19 T cells generated from TN cells in the presence of DMSO or KIs for 72 h (n = 2 independent T cell donors; 105 cells were profiled for each group). f, PCA of ATAC–seq data based on all variable features of two TN cell samples. g, Representative genomic regions near TCF7 and LAG3. Source data
Fig. 8
Fig. 8. KIs promote TSCM cell-like CAR.CD19 T cells in samples from patients with CLL.
a, Schematic of the generation of CAR.CD19 T cells using peripheral blood samples collected from patients with CLL. A single dose of KIs was added on day 3 at 0.75 μM. b,c, Representative histograms showing CAR.CD19 expression in T cells (b) and summary (c) on day 10 post-transduction (n = 4 independent T cell donors). d, CAR T cell counts on day 10 post-transduction (n = 4). e,f, Percentage of memory cell subsets (e) and expression of TCF1 (f) in CD4 and CD8 cells as measured by FACS on day 10 post-transduction (n = 4 independent T cell donors). g, Detection of IL-2 in the supernatant of CAR.CD19 T cells co-cultured with autologous CD19+ CLL cells at a 1:2.5 E:T ratio for 24 h (n = 4 independent T cell donors). h, Fold expansion of CAR.CD19 T cells after repetitive co-culture with autologous CD19+ CLL cells for 3 rounds at 1:2.5 E:T ratio (n = 4 independent T cell donors). i,j, Representative IVIS imaging (i) and tumor BLI kinetics (j) of NSG mice engrafted with the FFluc-Daudi cells and treated with CAR.CD19 T cells (3 × 106 cells) generated from patients with CLL in DMSO or KIs. The mice treated with CAR.CD19 T cells were rechallenged with tumor cells at day 31. The data in j summarize experiments from two independent T cell donors (n = 3 mice in the NT group, n = 6 mice in DMSO or KI group). The arrow indicates the time of tumor rechallenge in mice receiving CAR T cells. IVIS imaging was obtained by an IVIS Spectrum system. Data are shown as individual values and the mean ± s.d. The P values were determined using two-sided, paired Student’s t-test for dh and two-way ANOVA for j. Source data
Extended Data Fig. 1
Extended Data Fig. 1. Automated high-throughput screening of kinase inhibitors in activated T cells.
(a) Percentages of CD45RA+CD45RO in T cells stimulated with the CD3/CD28 agonistic mAbs in the presence of DMSO for 5 days and in control non-stimulated T cells. The majority of non-stimulated T cells are CD45RA+CD45RO (75% ± 2% for CD4 T cells and 75% ± 2% for CD8 T cells) (n = 32), while stimulated T cells transitioned to CD45RACD45RO+ cells (91% ± 3% for CD4 T cells and 86% ± 3% for CD8 T cells) (n = 352). The Z-factors (Z’) were calculated using the percentage of CD45RA+CD45RO cells activated with CD3/CD28 agonistic mAbs in DMSO and non-stimulated T cells for CD4 and CD8 T cells, respectively. No-stim = T cells non-stimulated. (b) Automated dose response assay in which KIs were dispensed in assay ready plates to yield 10 μM top concentration with 10-point 3-fold serial dilution. Illustrated is the percentage of viable T cells in response to the top 7 selected KIs; n = 2 independent T cell donors. Data are shown as mean of two experiments. Source data
Extended Data Fig. 2
Extended Data Fig. 2. Combined kinase inhibitors maintain TSCM-like CAR.CD19-T cells in vitro.
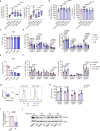
(a) Schematic of the generation of CAR.CD19-T cells in vitro using individual KIs (387B, 263 A and 761 A) at 3 μM where DMSO or KIs were added at the time of the initiation of the CAR-T cell generation (D-2); arrows indicate the time points at which DMSO or KIs are added to the culture. (b) Expression of the CAR.CD19 in T cells was measured by FACS at day 10 in CAR-T cells generated according to the schema in (a); n = 3 independent T cell donors. (c) Schematic of the generation of CAR.CD19-T cells in vitro using individual KI (387B, 263A and 761A at 3 μM) where DMSO or KIs were added starting at day 3 post transduction (D3); arrows indicate the time points at which DMSO or KIs are added to the culture. (d) Expression of the CAR.CD19 in T cells was measured by FACS at day 10 in CAR-T cells generated according to the schema in (c); n = 3 independent T cell donors. (e) Frequency of the memory cell subsets defined by the expression of CD45RA and CCR7 in CD4 and CD8 of CAR.CD19-T cells generated in DMSO or KIs using the schema described in (c); n = 3 independent T cell donors. (f) Schematic of the generation of CAR.CD19-T cells in vitro using the KI cocktail (387B, 263A and 761A) at 0.75 or 1.5 μM where DMSO or KIs were added from day 3 post-vector transduction (D3); arrows indicate the time points at which the DMSO or KIs are added to the culture. (g-i) CAR.CD19 expression (g), percentage of the CD45RA+CCR7+ cells (h), and T cell numbers (i) of CAR-T cells at day 10 generated in the presence of DMSO or KIs using the schema described in (f); n = 4 independent T cell donors in (g-h) and n = 3 in (i). Data are shown as individual values and mean ± SD; p values were determined by two-side paired student’s t test. Source data
Extended Data Fig. 3
Extended Data Fig. 3. Combined kinase inhibitors maintain TSCM-like CAR.CD19-T cells in vitro.
(a-b) Percentage of TSCM-like subset and TCF1 MFI in CAR.CD19-T cells generated using different combinations of KIs; n = 6 for (a) and n = 5 independent T cell donors for (b). (c-e) CAR.CD19 expression (c), T cell counts (d) and percentage of memory cell subsets (e) of CAR-T cells generated in the presence of DMSO or KI 402 A at 0.75 µM, 1.5 µM and 3.0 µM; n = 4 in (c, e) and n = 3 independent T cell donors in (d). (f) Percentage of memory cell subsets in CAR-T cells cultured with IL-2 or IL-7/IL-15 with or without the cocktail of KIs; n = 3 independent T cell donors. (g) Representative histograms showing the expression of TCF1 in TCM, TEM, TSCM and TEMRA CAR.CD19-T cell subsets as measured by intracellular staining. (h) Expression of TCF1 in each memory cell subset of CAR.CD19-T cells generated in the presence of DMSO or KIs; n = 4 independent T cell donors. (i-j) mRNA (i) and protein expression (j) of FOXO1 in CAR-T cells generated in the presence of DMSO or KIs; n = 4 independent T cell donors. Data are shown as individual values and mean ± SD; p values were determined by two-side Wilcoxon matched-pairs test for (a) and by two-side paired student’s t test for (b-i). Source data
Extended Data Fig. 4
Extended Data Fig. 4. Kinase inhibitors do not affect CAR.CD19-T cell activation.
(a-b) Representative flow cytometric histograms (a) and summary (b) showing CD69, CD25 and CD137 expression in CD4 and CD8 CAR.CD19-T cells co-cultured with CD19+ Daudi cells in the presence of single 263A, 387B or 761A KIs or combined KIs or Dasatinib. DMSO was used as control. n = 4 independent T cell donors. (c) IFNγ and IL-2 secretion by CAR.CD19-T cells co-cultured with Daudi cells for 24 hrs as illustrated in (a); n = 4 independent T cell donors. (d) Representative FACS histograms illustrating the expression of activation markers in CAR.CD19-T cells co-cultured with Daudi cells at 1:1 E:T ratio for 24 hrs in the presence of the different concentrations of the KIs; n = 3 independent T cell donors. (e, f) CAR.CD19-T cells were stimulated with plate-coated anti-CAR.CD19 idiotype mAb (1 µg/ml) (e) or agonistic CD3 mAb (1 µg/ml) (f) for 24 hrs in the presence of single 263A, 387B or 761A KIs or combined KIs or Dasatinib, and the expression of the CD69, CD25 and CD137 was assessed by FACS; n = 3 independent T cell donors. DMSO was used as control. Data are shown as individual values and mean ± SD; p values were determined by two-side paired student’s t test. Source data
Extended Data Fig. 5
Extended Data Fig. 5. CAR.CD19-T cells generated in the presence of kinase inhibitors retain functionality.
(a) CAR.CD19-T cells generated in the presence of DMSO or KIs were stimulated with the anti-CAR.CD19 idiotype mAb for 24 hrs and the expression of the activation markers CD25, CD69 and CD137 was evaluated by FACS; n = 7 independent T cell donors. (b, c) T cell differentiation (b) and T cell counts (c) of CAR.CD19-T cells generated in the presence of DMSO or KIs stimulated with the anti-CAR.CD19 idiotype mAb for 3 days; n = 3 independent T cell donors for (b) and n = 6 for (c). (d) IFNγ, IL-2 and TNFα released by CAR.CD19-T cells determined by intracellular cytokine staining after 6 hrs stimulation with PMA/Ionomycin/BFA; n = 7 independent T cell donors. Source data
Extended Data Fig. 6
Extended Data Fig. 6. Kinase inhibitors enhance anti-tumor activity of CAR.CD19-T cells with 4-1BB co-stimulatory endodomain.
(a, b) Percentage of CD45RA+CCR7+ (a) and CD27+CD28+ (b) in CD4 and CD8 CAR.CD19-41BB T cells generated in the presence of DMSO or KIs; n = 4 independent T cell donors. (c) Representative IVIS imaging of NSG mice engrafted with the FFluc-Daudi cells and treated with 3 × 10⁶ CAR.CD19-41BB T cells generated in the presence of DMSO or KIs; NT = non-transduced T cells; mice treated with CAR.CD19-T cells were re-challenged with 2 × 10⁶ Daudi tumor cells at day 25. Two human healthy donors were used to generate the CAR-T cells; n = 2 in NT group, n = 6 in DMSO and KIs. The arrow indicates the time of tumor re-challenge in mice receiving CAR.CD19-T cells. (d, e) Quantification of human CD4 and CD8 T cells in the peripheral blood collected from mice at day 21 after CAR-T cell infusion (d), and CD4 or CD8 T cells in blood and CD27+CD28+ T cells in blood and spleens collected from mice at the experiment endpoint (Day 63) (e); n = 3, each dot represents one animal. (f, g) Daudi-bearing NSG mice were infused with a low dose (1.5 × 10⁶) CAR.CD19-Ts encoding the 4-1BB endodomain generated using the KI cocktail (387B, 263A and 761A at 0.75 μM). DMSO was used as control. Tumor BLI kinetics (f) and Kaplan-Meier survival curves (g) are presented. CAR-T cells were generated from 2 independent T cell donors; n = 5 mice in NT group, n = 8 mice in DMSO and n = 10 in KIs. Data are shown as values of individual animal and mean ± SD; p values were determined by two-side paired student’s t test for (a)-(b), two-side unpaired student’s t test (d, e, f), log-rank for (g). Source data
Extended Data Fig. 7
Extended Data Fig. 7. Kinase inhibitors enhance antitumor activity of CAR.GD2-T cells in vitro and in vivo.
(a) Schematic of the generation of CAR.GD2-T cells in DMSO or KIs. (b) Expression of the CAR.GD2 in T cells; n = 7 independent T cell donors. (c) Percentage of memory cell subsets in CD4 and CD8 CAR.GD2-T cells generated in DMSO or KIs; n = 8 independent T cell donors. (d, e) TCF1 mRNA (d) and protein (e) expression in CAR.GD2-T cells; n = 3 independent T cell donors for (d); n = 6 independent T cell donors for (e). (f) T cell counts of CAR.GD2-T cells at days 3, 6 and 10 post-transduction; n = 6 independent T cell donors. (g, h) CAR.GD2-T cells generated in DMSO or KIs were co-cultured with the GD2+ LAN1 neuroblastoma cells at 1:5 E:T ratio for 5 days, tumor cells (g) and T cells (h) were enumerated by FACS; n = 4–7 independent T cell donors. (i, j) Intracellular staining for granzyme-B (i), TNFα, IFNγ and IL-2 (j) in CAR.GD2-T cells after the 3 rounds of stimulation with LAN1 tumor cells; n = 6 independent T cell donors. (k, l) Representative IVIS imaging (k) and tumor bioluminescence (BLI) kinetics (l) of NSG mice engrafted with the FFluc-CHLA-255 neuroblastoma (2 × 10⁶), and treated with a suboptimal dose of CAR.GD2-T cells (2 × 10⁶) generated in DMSO or KIs. Mice treated with CAR.GD2-T cells were re-challenged with tumor cells at day 21. Imaging was taken by AMI HT imaging system; arrow indicates the time of tumor re-challenge; n = 5 mice/group. (m) Kaplan-Meier survival curve of (l); n = 5 mice/group. (n) Percentage of CD45RA+CCR7+ cells in CAR.GD2-T cells detected in the spleens of the CHLA-255 tumor-bearing mice euthanized at day 17 after treatment; n = 5 mice/group. (o) Expression of PD1, TIM3 or LAG3 in CD4 and CD8 CAR.GD2-T cells described in (n); n = 5 mice/group. (p) CD45RA+CCR7+, CD27+CD28+, and CD45RA+CD28+ T cells detected within the livers with tumor metastases in the neuroblastoma model; n = 5 mice/group. Data in (b-j) are shown as individual values and mean ± SD while each dot in (n-p) represent one animal; p values were determined by two-side paired student’s t test for (b)-(e), (g), (i), two-side Wilcoxon matched-pairs signed rank test for (f) and (j), two-side Mann-Whitney test for (h), log-rank test for (m), two-side unpaired student’s test for (n-p) and two-way ANOVA for (l). Source data
Extended Data Fig. 8
Extended Data Fig. 8. Targeting multiple kinases by genetic engineering preserve TSCM-like CAR-T cells.
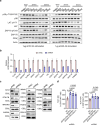
(a) Western blots showing p38, LAT and ZAP70 phosphorylation in CAR.CD19-T cells stimulated with 1 µg/ml agonistic CD3 mAb or 1 µg/ml anti-idiotype CAR Ab in the presence of the KIs; β-actin was used as loading control. (b, c) Specific kinases were knockdown in CAR.CD19-T cells by using lentiviruses encoding specific shRNAs. Messenger RNA (b) and protein (c) expression of each targeted kinase in CAR.CD19-T cells after shRNA-based knocking down. (d) Comparison of TCF1 expression in CD4 or CD8 CAR.CD19-T cells obtained after combination of shRNA targeting ADCK3 + ITK + MAP3K4 (C1) or targeting ADCK3 + ITK + CDK13 (C2) and CAR-T cells generated in the presence of DMSO or KIs expressing the control shRNA; n = 3 independent T cell donors. Data are shown as individual values and mean ± SD; p values were determined by two-side paired student’s t test. Source data
Extended Data Fig. 9
Extended Data Fig. 9. Kinase inhibitors promote TSCM signature genes and transcriptional programs.
(a) Schematics of FACS sorting and RNA-Seq analysis of CD8+ TSCM and TEM/TE subsets obtained from CAR.CD19-T cells. (b) Volcano plots showing the number of DEGs comparing CAR-T cells with KIs vs. DMSO at days 1, 3 and 7 after treatment. (c) Overlap between up-regulated and down-regulated DEGs between KIs and DMSO on days 1 and 3. (d) Volcano plot showing differentially expressed genes between FACS-sorted TSCM (CD45RA+CCR7+) CAR-T cells generated in the presence of DMSO or KIs from 2 independent healthy donors with 2 technical replicates in each group. (e) Cross-referencing DEGs in (f) with signature genes of TSCM and TE/TEM showing overlap genes in both gene sets. (f) Heatmaps showing the expression of TSCM and TE/TEM signature genes in TSCM selected from CAR.CD19-T cells generated in DMSO or KIs. For analysis in d-f, RNA was extracted from 2 × 10⁶ cells, and processed for downstream analysis.
Extended Data Fig. 10
Extended Data Fig. 10. Kinase inhibitors enhance the activity of CAR.CD19-T cells obtained for CLL patients.
(a) Schematic of the generation CAR.CD19-T cells in DMSO or one-dose or two-doses of KIs in healthy donors. Arrows indicate the time points at which KIs were added to the culture. (b, c) T cell numbers (b), and expression of CD45RA and CCR7 (c) in CAR.CD19-T cells after 7 days of culture; n = 6 independent T cell donors. (d-e) Phenotype of CAR.CD19-T cells obtained from CLL patients used for the in vivo experiments.Expression of CAR.CD19 (d), CD45RA, CCR7, CD27 and CD28 (e) in CAR.CD19-T cells generated in DMSO or KIs. (f) Expression of CD45RA and CCR7 in CAR+CD27+CD28+ T cells. (g, h) Quantification of human CD45+CD3+ (g) and CD27+CD28+CD45RA+CCR7+ (h) T cells in the peripheral blood of Daudi-bearing mice treated with CAR.CD19-T cells generated from CLL patients. Data in (b-c) are shown as individual values and mean ± SD, and data in (g, h) are shown as summarized experiments from 2 independent T cell donors; n = 4 mice in DMSO and n = 5 mice in KIs; p value was determined by two-side paired student’s t test for (b-c), two-side unpaired student’s t test for (g-h). Source data

References

    1. Kochenderfer, J. N. et al. Chemotherapy-refractory diffuse large B-cell lymphoma and indolent B-cell malignancies can be effectively treated with autologous T cells expressing an anti-CD19 chimeric antigen receptor. J. Clin. Oncol.33, 540–549 (2015). - PMC - PubMed
    1. Raje, N. et al. Anti-BCMA CAR T-cell therapy bb2121 in relapsed or refractory multiple myeloma. N. Engl. J. Med.380, 1726–1737 (2019). - PMC - PubMed
    1. Ramos, C. A. et al. Anti-CD30 CAR-T cell therapy in relapsed and refractory Hodgkin lymphoma. J. Clin. Oncol.38, 3794–3804 (2020). - PMC - PubMed
    1. Maude, S. L. et al. Chimeric antigen receptor T cells for sustained remissions in leukemia. N. Engl. J. Med.371, 1507–1517 (2014). - PMC - PubMed
    1. Mueller, K. T. et al. Cellular kinetics of CTL019 in relapsed/refractory B-cell acute lymphoblastic leukemia and chronic lymphocytic leukemia. Blood130, 2317–2325 (2017). - PMC - PubMed

Substances