. 2025 Feb;10(2):388-404.
doi: 10.1038/s41564-024-01882-9. Epub 2025 Jan 8.

Enterobactin inhibits microbiota-dependent activation of AhR to promote bacterial sepsis in mice

Affiliations

Enterobactin inhibits microbiota-dependent activation of AhR to promote bacterial sepsis in mice

Robert C Keskey et al. Nat Microbiol. 2025 Feb.

Abstract

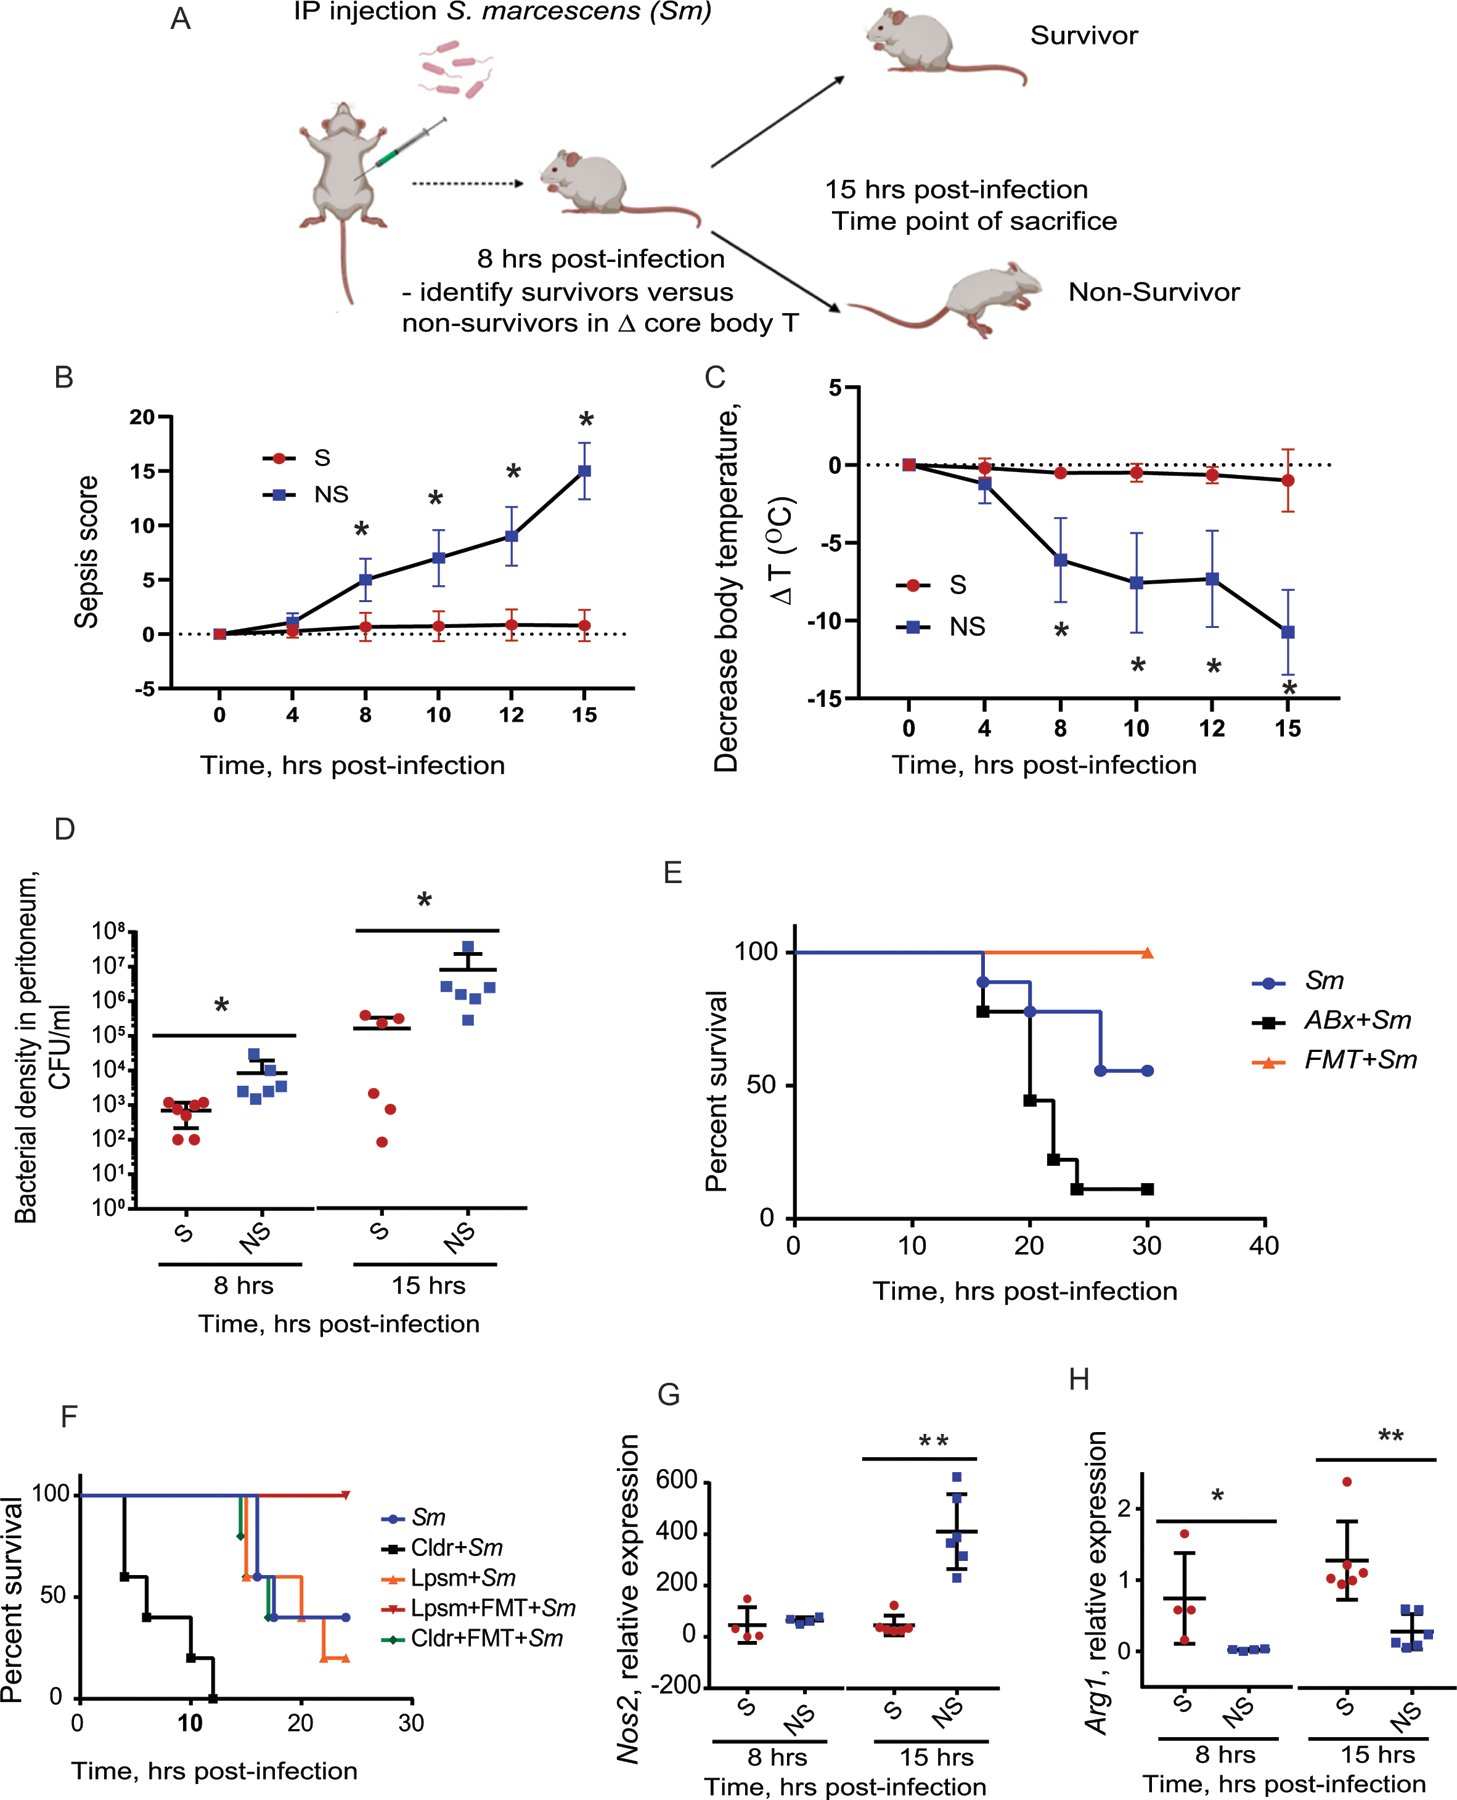
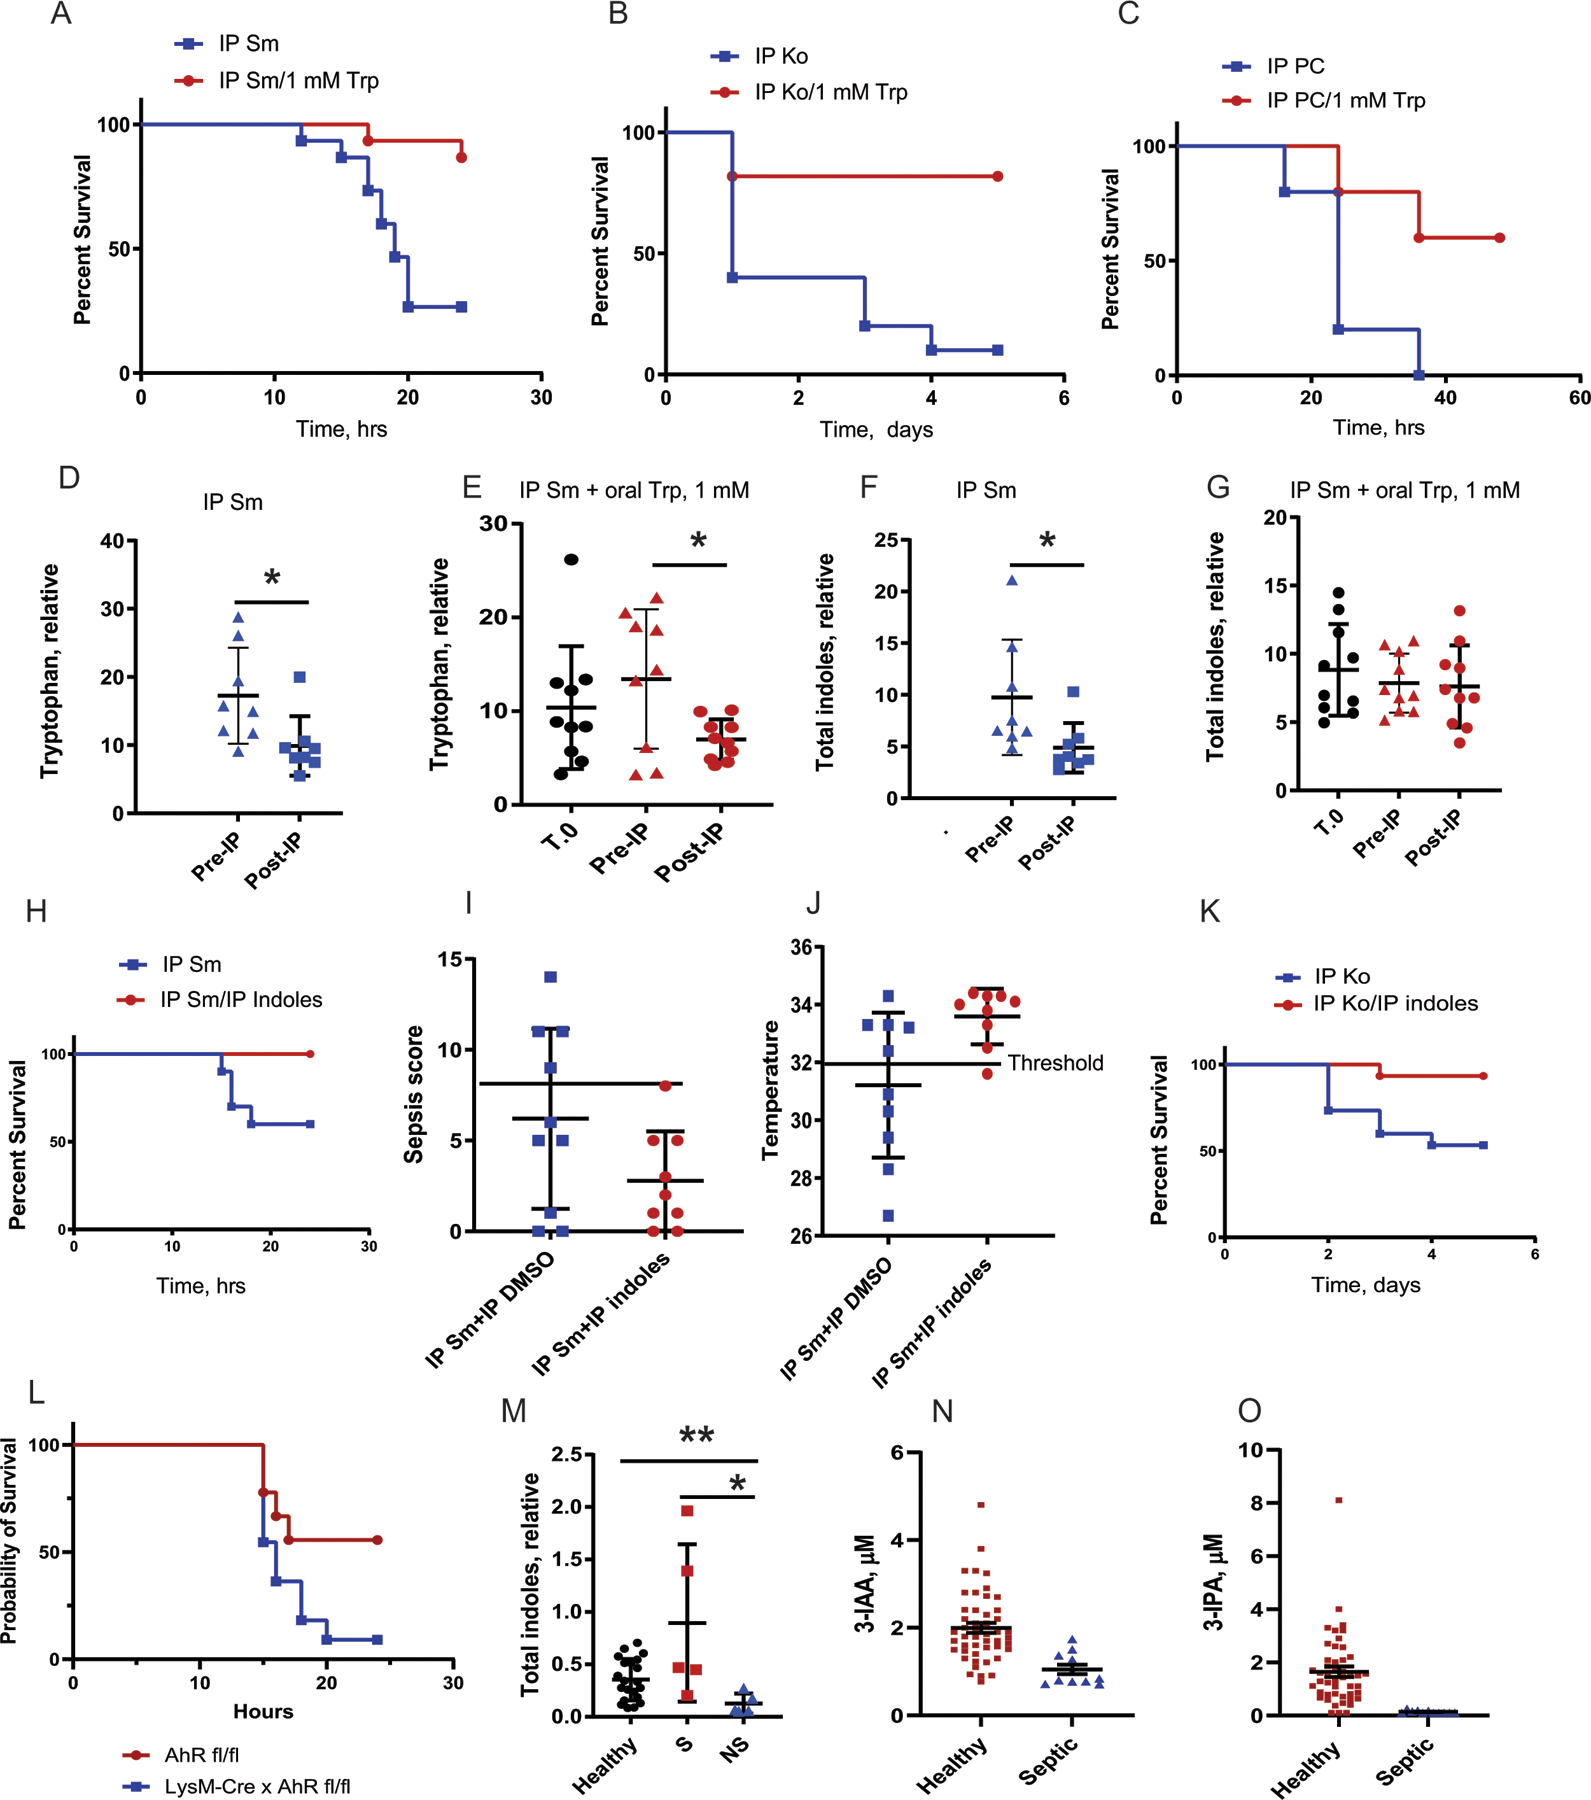
Sepsis is a major cause of morbidity and mortality, but our understanding of the mechanisms underlying survival or susceptibility is limited. Here, as pathogens often subvert host defence mechanisms, we hypothesized that this might influence the outcome of sepsis. We used microbiota analysis, faecal microbiota transplantation, antibiotic treatment and caecal metabolite analysis to show that gut-microbiota-derived tryptophan metabolites including indoles increased host survival in a mouse model of Serratia marcescens sepsis. Infection in macrophage-specific aryl hydrocarbon receptor (AhR) knockout mice revealed that AhR activation induced transcriptional reprogramming in macrophages and increased bacterial clearance and host survival. However, culture supernatants from multiple bacterial pathogens inhibited AhR activation in vitro. We showed that the secreted siderophore, enterobactin, inhibited AhR activation in vitro and increased sepsis mortality in vivo. By contrast, oral or systemic tryptophan supplementation increased survival. These findings show that sepsis survival depends upon the interplay between pathogen inhibition and the activation of AhR by a microbiota-derived metabolite.


Conflict of interest statement

Competing interests: The authors declare nocompeting interests.

Figures

Extended Figure 1:
Extended Figure 1:. Comparison of alpha and beta diversity between gut microbiota of Survivors, Non-Survivors and FMT treated mice.
16S sequencing was completed of the cecal microbiota obtained from survivors (n =7), non-survivors (n=8), and FMT (n=5). The Shannon alpha diversity was compared between groups (A) and the Beta diversity, weighted unifrac (B). Boxplots – lower and upper lines represent first and third quartiles, middle line represents the median, whiskers are 1.5xIQR.
Extended Figure 2:
Extended Figure 2:. Short chain fatty acids (SCFA) were compared between survivors and non-survivors in the cecum and peritoneum.
Cecal concentrations of acetate (A), propionate (B), and butyrate (C) were compared between survivors and non-survivors (n = 5). Levels of acetate (D), propionate (E). and butyrate (F) in the peritoneum of survivors and non-survivors (n = 3 per group).
Extended Figure 3:
Extended Figure 3:. Bacterial dissemination and clinical severity of AhR inhibition in S. marcescens peritonitis.
Bacterial culture of the peritoneum (A) and blood (B) comparing survivors (n = 6), non-survivors (n =6), AhR inhibitor with SR1 (n = 5), FMT (n =5), and FMT + AhRi ( n =5). One way ANOVA followed by pairwise comparison with BH correction. p values, * < 0.05, ** < 0.01, *** <0.001
Extended Figure 4:
Extended Figure 4:. Transcriptional profiles of peritoneal macropahges from FMT treated mice.
RNA sequencing was performed on peritoneal macrophages from FMT treated mice (n =5) compared to non-surviving mice (n = 5). Differentially expressed genes comparing FMT to non-surviving mice are demonstrated in the volcano plot in A. Gene set enrichment demonstrated significant transcription factors between FMT and non-survivors (B). Ingenuity pathway analysis was completed comparing differentially expressed genes between peritoneal macrophages isolated from FMT and FMT+AhRi demonstrating significantly altered pathways (C).
Extended Figure 5:
Extended Figure 5:. Uniquely differentially expressed genes in peritoneal macrophages from surviving mice.
RNA sequencing was performed on peritoneal macrophages isolated from survivors (n = 5), non-survivors (n =5), and FMT (n =5). Differentially expressed genes (absolute log FC > 1.5 and FDR < 0.05) that were either unique to survivors or oppositely expressed between survivors and non-survivors are listed in the panels.
Extended Figure 6:
Extended Figure 6:. AhR activation in vitro by individual indole metabolites.
A murine hepatoma AhR reporter cell line was utilized to determine the dose response of AhR activation by individual indole metabolites (indole-3 acetic acid, indole-3 carboxaldehyde, indole-3 lactic acid, and tryptophol). Each metabolite was tested at concentrations ranging from 0.01 mM to 5 mM, n = 3 bioligic replicates per concentration for each metabolite. Boxplots – lower and upper lines represent first and third quartiles, middle line represents the median, whiskers are 1.5xIQR.
Extended Figure 7:
Extended Figure 7:. AhR activation in vitro by short chain fatty acids.
A murine hepatoma AhR reporter cell line was utilized to determine the dose response of AhR activation by individual short chain fatty acids (SCFAs: acetate, propionate, and butyrate) and a mixture of SCFAs (high = 10mM, low = 1mM). The AhR activation was compared to indole metabolites at 1mM (indole-3 acetic acid, indole-3 lactic acid, indole-3 carboxaldehyde, and tryptophol). n = 3 biologic replicates per concentration for each metabolite.
Extended Figure 8:
Extended Figure 8:. Expression of pro-inflammatory cytokines by macrophages in response to S. marcescens and indole metabolites in vitro.
Bone marrow derived macrophages (BMDMs) were stimulated in vitro in the presence of S. marcesens, S. marcescens with 0.01 mM indole metabolite mixture (indole-3 lactic acid, indole-3 acetic acid, indole-3 carboxaldehyde, and tryptophol), and S. marcescens in the presence of indole mixture with AhR inhibitor (SR1). Gene expression of Nos2, Il6, and TNFa was compared between groups (DMSO n =6, Indole Mix n = 9, and Indole Mix + AhRi n = 6). Boxplots – lower and upper lines represent first and third quartiles, middle line represents the median, whiskers are 1.5xIQR.
Extended Figure 9:
Extended Figure 9:. Molecular docking was utilized in silico to determine potential pathogen secreted exoproducts capable of inhibiting AhR.
Prodiogosin and enterobactin are two secondary metabolites common to pathogens that are predicted to be AhR Antagonists. Three dimensional binding mode (i), surface representation (ii), and two-dimensional illustration of molecular docking between enterobactin and AhR and prodiogosin and AhR are demonstrated. The binding energies and docking scores are demonstrated in extended table 3.
Extended Figure 10:
Extended Figure 10:. Iron chelation does not impact enterobactin inhibition of AhR and enterobactin intermediate dihydroxybenzoic acid can inhibit AhR in vitro.
Murine hepatoma AhR reporter cell line was utilized to determine the ability of iron to impact enterobactin inhibition of AhR activation by indole metabolites (A). Furthermore, enterobactin intermediate dihydroxybenzoic acid (DHBA) was utilized to determine if it could inhibit indole activation of AhR (B). n = 3 biologic replicates per group. Boxplots – lower and upper lines represent first and third quartiles, middle line represents the median, whiskers are 1.5xIQR.
Figure 1.
Figure 1.. Survival from S. marcescens peritonitis is dependent on the gut microbiota and correlates with peritoneal macrophage phenotype.
(A), Mouse model of IP Serratia marcescens injection. (B-D), Surviving mice are characterized by lower sepsis score (p = 1.5×10⁻⁴ at 8h) (B), higher core body temperature (p = 8.18×10⁻⁵ at 8h )(C), and lower S. marcescens density in the peritoneum (D). n=7 mice per group, *p=0.046, Mann-Whitney unpaired t-test. (E), Kaplan-Meyer survival curves demonstrating that disruption of gut microbiota by antibiotics (clindamycin and cefoxitin) increases mortality in infected mice while replenishment of the gut microbiota via FMT protects against mortality. n=10 per group, p<0.0001, Log-rank (Mantel-Cox) test. (F), Kaplan-Meyer survival curves demonstrating that depletion of macrophages by clodronate liposomes increases mortality of mice following intraperitoneal (IP) injection of S. marcescens. n=5 per group, p<0.0001, Log-rank (Mantel-Cox) test. (G,H). pMACs isolated from survivors have lower expression of canonical M1 gene Nos2, *p = **p = 0.0001 at 15h (G) associated with higher expression of the canonical M2 gene Arg1, *p = 0.031 at 8h, **p = 0.00229 at 15h (H). n=4 mice per group for 8 hrs time point; n=6 mice per group for 15 hrs time point. Mann-Whitney unpaired t-test. Sm, S. marcescens; Cldr, clodronate liposomes; Lpsm, liposomes (vehicle control); FMT, fecal microbial transplant. For temperature tracking experiments, n = 52 (Survivors, n = 21; Non-Survivors, n = 31, in 3 independent experiments). Error bars represent standard deviation. All statistical tests were two-sided and BH correction was utilized for multiple hypothesis testing. Created in BioRender. Keskey, R. (2024) BioRender.com/z85h314
Figure 2.
Figure 2.. Gut microbiota-derived tryptophan metabolites are increased in surviving mice and the aryl hydrocarbon receptor is required for survival in this model.
(A), Relative abundance of cecal microbiota at the phyla level. (B), Gut metabolites abundance of infected mice. (C,D), Tryptophan (C) and relative total indoles (D) in the cecum of mice after 8 hrs of IP injection with S. marcescens (n=6 for S, n = 7 for NS, n = 5 FMT) with IP injection of S. marcescens. S, surviving mice; NS, non-surviving mice; FMT = fecal microbiota transplant. (C): p=0.0049, One-way ANOVA followed by pairwise comparison with Benjamini-Hochberg (BH) correction; ***p = 0.0082, NS vs FMT; *p=0.0504, S vs FMT; p = 0.2401, S vs NS . (D): *p=0.0153, S vs NS; **p= 5.5e-5, NS vs FMT; ***p=0.0055, S vs FMT, pairwise comparison with BH correction. (E), Microbial metabolites of tryptophan in the peritoneum of surviving mice relative to non-surviving mice. (F), Serum levels of indole-3 propionic acid comparing survivor (n = 7) and non-survivor (n = 6) mice. (G), Kaplan-Meyer survival curves demonstrating the abrogation of the FMT rescue effect during AhR inhibition (AhRi). n=5 per group, p<0.0001, Log-rank (Mantel-Cox) test. SM, S. marcescens; AhRi, AhR inhibitor StemRegennin; FMT, fecal microbial transplant. (H), Knockout of AhR within macrophages (LysM-Cre x AhR fl/fl) attenuates survival of mice as demonstrating by Kaplan-Meyer survival curves, p=0.0211, n = 20 mice per group. Error bars represent standard deviation. All statistical tests were two-sided and BH correction was utilized for multiple hypothesis testing.
Figure 3.
Figure 3.. Transcriptional analysis of pMACs demonstrates distinct profiles of surviving and non-surviving mice in an AhR dependent manner.
RNA sequencing was performed on pMACs isolated from survivors, non-survivors, n=5 per group. (A) Venn Diagram comparing differentially expressed genes within macrophages of survivors, non-survivors, and FMT treated mice. (B), Volcano plots (logFC >1.5 and FDR < 0.05) between pMACs from surviving mice compared to non-surviving mice. (C), Gene set enrichment (GSE) with g:Profiler comparing survivors to non-survivors demonstrating significant transcription factors. (D), GSE analysis with ImmuneSigDB between pMACs from survivors, non-survivors, and FMT mice. (E), Ingenuity pathway analysis comparing survivors to AhRi (F), Concentration- dependent effect of indoles on AhR activation using a mouse AhR reporter cell line. n=3 biologic replicates for DMSO, n=12 biologic replicates for indoles mix at 0.01 mM concentration and n=3 for indoles mix at 0.1, 1.0 and 10 mM concentrations. p<0.0001, One-way ANOVA; *p=1.5e-9, **p=2e-16, ***p=0.0019, pairwise comparison with BH correction. (G), Relative expression of Cyp1b1 in BMDMs, n=11 p=0.0001, One-way ANOVA test; *p=0.00046 Indoles vs Indoles + AhRi; **p=0.00092 Indoles vs DMSO, pairwise comparison with BH correction. (H), Gentamicin protection assays using BMDMs exposed to 0.01 mM indole mixture with S. marcescens. n= 11 per group, p<0.0001, One-way ANOVA test; *p=2.2e-9 Indole Mix vs Indole Mix + AhRi; p=2.0e-7 Indole Mix vs DMSO; p = 0.046 Indole Mix + AhRi vs DMSO, pairwise comparison with BH correction. (I-J), Relative expression of Arg1 (I) and Il10 (J), in BMDMs after exposure to Sm. I: p<0.0001, One-way ANOVA test; *p<0.0001, DMSO n =12, Indole mix n =14, Indole mix + AhRi n = 9. (J): p=0.0058, One-way ANOVA test; *p=0.00022, pairwise comparison with BH correction. **p=2.3×10⁻⁵. (K), IL10 protein by ELISA. p=0.014, One-way ANOVA test; *p=2.0e-7, DMSO vs Indole Mix; p = 2.2×10⁻⁹ Indole mix vs Indole mix + AhRi, pairwise comparison completed with BH correction, DMSO n = 6, Indole Mix n = 9, Indole Mix + AhRi n = 6. Error bars represent standard deviation.
Figure 4.
Figure 4.. S. marcescens exoproduct inhibits indole-mediated AhR activation.
The Impact of S. marcescens on AhR signaling was studied in vitro. Filtered supernatant was collected from S. marcescens at early and late log phase. The AhR reporter cell line was exposed to filtered supernatant in the presence and absence of the indole mixture to determine its impact on AhR signaling. (A) Supernatant from the late log phase resulted in significant repression of AhR activation in the presence of the indole mix at 0.01 mM and 0.1 mM. p<0.0001, One-way ANOVA. *p = 1.6e-13, Indole Mix vs Control; p = 6e-10; p = 3e-7, Indole Mix + Early Log supernatant vs 0.01 Indole Mix; **p<1e-10 for early log, late log, stationary phase vs indole mix, pairwise comparison with BH correction, n = 3 biologic replicates per group. (B) Supernatant from the late log phase resulted in significant repression of AhR activation in the presence of the individual indoles at 0.1 mM. p<0.0001, One-way ANOVA. *p <0.0001, **p=0.0231, unpaired t-test, n = 3 biologic replicates per group. (C), The <3 kDa fraction of the supernatant represses the activation of AhR by the indole mix at 0.01 mM. p<0.0001, One-way ANOVA. *p <0.0001, unpaired t-test, n = 6 biologic replicates per group. (D-G) Supernatants were collected from different clinically relevant pathogens to determine their ability to inhibit indole activation of AhR in vitro, n = 3 biogic replicates per group. (D), The P. aeruginosa supernatants were toxic to cell line and were removed from AhR activation experiment. (E), The AhR reporter cell line (H1L1.1c2) was then exposed to the indole mixture in the presence of supernatant from pathogens that were not cytotoxic to determine their ability to inhibit indole activation of AhR. (F), Enterococcus faecalis and Klebsiella pneumoniae demonstrated an AhR inhibition that was strongly dependent on growth phase. (G), Pathogen supernatants were then fractionated by molecular weight to determine if size (i.e., < 3kD) was a discriminatory factor in the observed inhibition, n = 3 biologic replicates per group. Error bars represent standard deviation. All statistical tests were two-sided and BH correction was utilized for multiple hypothesis testing.
Figure 5:
Figure 5:. Enterobactin can subvert the host immune response and plays a role in the mortality observed following i.p. S. marcescens.
Autodock was utilized to determine potential microbial metabolites capable of interacting with AhR. Three dimensional binding mode (i), surface representation (ii), and two-dimensional illustration of molecular docking between enterobactin and AhR and indole-3-acetic acid and AhR are demonstrated (A). Mass spectrometry demonstrates that both K. oxytoca and S.marcescens are capable of producing enterobactin as both enterobactin and components of enterobactin were detected in <3 KDa fraction of liquid culture, n = 3 biologic replicates per group (B). Enterobactin significantly inhibited indole activation of AhR in vitro (C) without being cytoxic (D) n = 3 biologic replicates per group. When enterobactin was delivered IP, simultaneously with S. marcescens in vivo, there was a significant increase (p=0.0156) in mortality compared to DMSO control, n = 15 per group (E). Error bars represent standard deviation. All statistical tests were two-sided and BH correction was utilized for multiple hypothesis testing.
Figure 6.
Figure 6.. Systemic delivery of the indole mixture or oral supplementation with tryptophan prevents mortality in mice following i.p S. marcescens, Sm; K. oxytoca, Ko; and polymicrobial community, PC consisting of Klebsiella oxytoca, Enterococcus faecalis, Serratia marcescens, and Candida albicans)
Mice supplemented with oral tryptophan (1mM) in their drinking water for 2 weeks prior to IP infection demonstrated a significant improvement in survival folloiwng IP S. marcecens (A), K. oxytoca (B), and PC (C). (D-G), Metabolomics analysis of the stool demonstrated that that (D), the tryptophan level is decreased after IP injection of Sm. (E), tryptophan supplementation did not significantly increase stool tryptophan prior to infection, however a significant decrease in gut tryptophan was still observed following IP pathogen injection. (F), Similarly,we observed a significant decrease of indoles following i.p pathogen injection that was not observed with Trp supplementation (G). n=10 per group, *p<0.05. (H), Systemic delivery of the indole mixture of 0.01 mM delivered IP at the time of infection with Sm peritonitis demosntrated a significant improvement in survival. Kaplan-Meyer survival curves, n=10 per group, p=0.0291, Log-rank (Mantel-Cox) test (H). (I), Sepsis score. All indole-treated mice sepsis scores were below threshold, sepsis score=8 (n = 10 per group). (J), Core body temperature. All indole-treated mice body temperatures were over the threshold (32°C). (K), Mice were rescued with 0.01 mM indole mixture delivered i.p at the time of infection with Klebsiella oxytoca. (L) LysM Cre x AhR fl/fl were not able to be rescued with i.p injection of indoles compared to AhR fl/fl mice (n= 9 AhR fl/fl, n = 11 LysM-Cre x AhR fl/fl) p = 0.051. (M) Stool indole levels were compared between healthy controls, survivors and non-survivors of sepsis; p = 0.1741, Healthy vs NS; p = 0.0055, Survivor vs Healthy; p = 0.0030, Survivor vs Non-Survivors (Healthy control n = 21, Survivors n = 5, Non-Survivors n= 5). (N) Serum levels of indole-3 acetic acid (I3AA) was compared between septic patients (n = 11, 26 samples) and healthy controls (n =48), p = 0.0003. (O) Serum Indole-3 Propionic Acid (3-IPA) was compared in the serum of the same patients (n = 11, 26 samples), p = 0.0005. Error bars represent standard deviation. All statistical tests were two-sided and BH correction was utilized for multiple hypothesis testing.

Similar articles

Cited by

References

    1. Leligdowicz A & Matthay MA Heterogeneity in sepsis: new biological evidence with clinical applications. Crit Care 23, 80 (2019). - PMC - PubMed
    1. Marshall JC Why have clinical trials in sepsis failed? Trends in Molecular Medicine 20, 195–203 (2014). - PubMed
    1. McCarville JL, Chen GY, Cuevas VD, Troha K & Ayres JS Microbiota Metabolites in Health and Disease. Annu. Rev. Immunol 38, 147–170 (2020). - PubMed
    1. Casadevall A & Pirofski L Host-Pathogen Interactions: Basic Concepts of Microbial Commensalism, Colonization, Infection, and Disease. Infect Immun 68, 6511–6518 (2000). - PMC - PubMed
    1. Gutiérrez-Vázquez C & Quintana FJ Regulation of the Immune Response by the Aryl Hydrocarbon Receptor. Immunity 48, 19–33 (2018). - PMC - PubMed

MeSH terms

LinkOut - more resources