

Longitudinal genomic profiling using liquid biopsies in metastatic nonsquamous NSCLC following first line immunotherapy
- PMID: 39779891
- PMCID: PMC11711381
- DOI: 10.1038/s41698-024-00797-2
Longitudinal genomic profiling using liquid biopsies in metastatic nonsquamous NSCLC following first line immunotherapy
Abstract
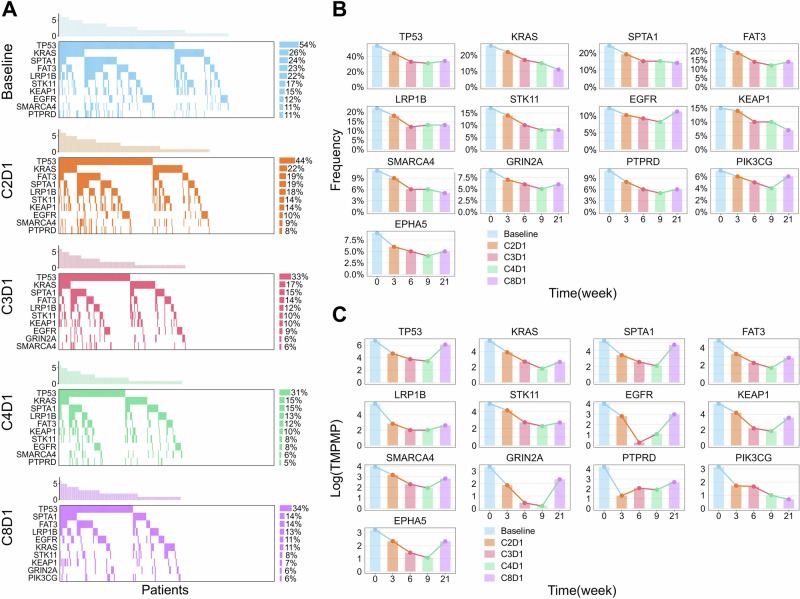
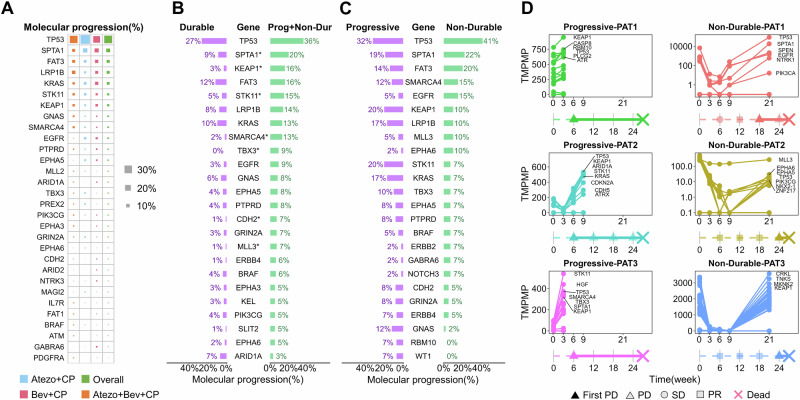
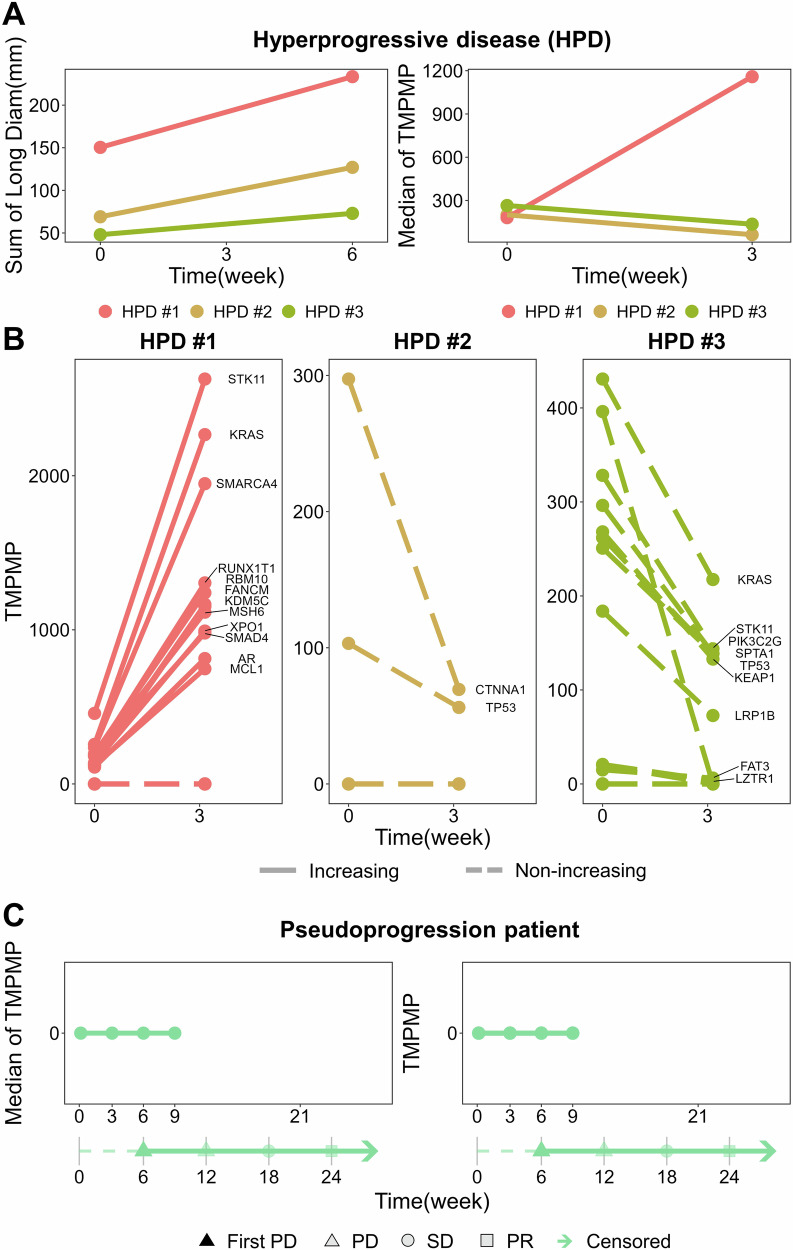
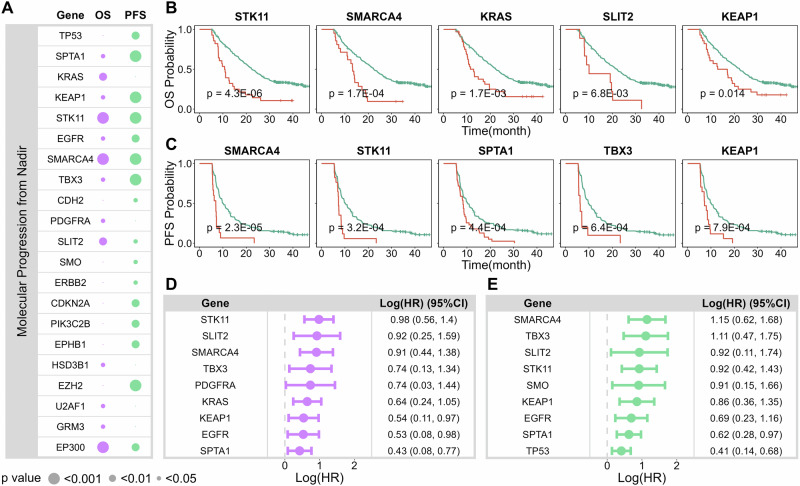
Tumor genomic profiling is often limited to one or two timepoints due to the invasiveness of tissue biopsies, but longitudinal profiling may provide deeper clinical insights. Using ctDNA data from IMpower150 study, we examined genetic changes in metastatic non-squamous NSCLC post-first-line immunotherapy. Mutations were most frequently detected in TP53, KRAS, SPTA1, FAT3, and LRP1B at baseline and during treatment. Mutation levels rose prior to radiographic progression in most progressing patients, with specific mutations (SPTA1, STK11, KEAP1, SMARCA4, TBX3, CDH2, and MLL3) significantly enriched in those with progression or nondurable response. However, ctDNA's role in detecting hyperprogression and pseudoprogression remains uncertain. STK11, SMARCA4, KRAS, SLT2, and KEAP1 mutations showed the strongest correlation with poorer overall survival, while SMARCA4, STK11, SPTA1, TBX3, and KEAP1 mutations correlated with shorter progression-free survival. Overall, longitudinal liquid biopsy profiling provided valuable insights into lung cancer biology post-immunotherapy, potentially guiding personalized therapies and future drug development.
© 2025. The Author(s).
Conflict of interest statement
Competing interests: X.S.X. is an employee of Genmab, Inc. Genmab did not provide funding for this study. The remaining authors declare no competing interests.
Figures
Similar articles
-
Clinical efficacy of atezolizumab plus bevacizumab and chemotherapy in KRAS-mutated non-small cell lung cancer with STK11, KEAP1, or TP53 comutations: subgroup results from the phase III IMpower150 trial.J Immunother Cancer. 2022 Feb;10(2):e003027. doi: 10.1136/jitc-2021-003027. J Immunother Cancer. 2022. PMID: 35190375 Free PMC article. Clinical Trial.
-
The prognostic impact of KRAS, TP53, STK11 and KEAP1 mutations and their influence on the NLR in NSCLC patients treated with immunotherapy.Cancer Treat Res Commun. 2023;37:100767. doi: 10.1016/j.ctarc.2023.100767. Epub 2023 Oct 10. Cancer Treat Res Commun. 2023. PMID: 37832364
-
STK11 and KEAP1 mutations in non-small cell lung cancer patients: Descriptive analysis and prognostic value among Hispanics (STRIKE registry-CLICaP).Lung Cancer. 2022 Aug;170:114-121. doi: 10.1016/j.lungcan.2022.06.010. Epub 2022 Jun 20. Lung Cancer. 2022. PMID: 35753125
-
To be, or not to be: the dilemma of immunotherapy for non-small cell lung cancer harboring various driver mutations.J Cancer Res Clin Oncol. 2023 Sep;149(12):10027-10040. doi: 10.1007/s00432-023-04919-4. Epub 2023 Jun 1. J Cancer Res Clin Oncol. 2023. PMID: 37261523 Free PMC article. Review.
-
Emerging insights into STK11, KEAP1 and KRAS mutations: implications for immunotherapy in patients with advanced non-small cell lung cancer.Transl Lung Cancer Res. 2024 Dec 31;13(12):3718-3730. doi: 10.21037/tlcr-24-552. Epub 2024 Dec 23. Transl Lung Cancer Res. 2024. PMID: 39830769 Free PMC article. Review.
Cited by
-
Insights into pet-based radiogenomics in oncology: an updated systematic review.Eur J Nucl Med Mol Imaging. 2025 Apr 7. doi: 10.1007/s00259-025-07262-7. Online ahead of print. Eur J Nucl Med Mol Imaging. 2025. PMID: 40192792 Review.
References
-
- Herbst, R. S., Morgensztern, D. & Boshoff, C. The biology and management of non-small cell lung cancer. Nature553, 446–454 (2018). - PubMed
-
- Wang, M. N., Herbst, R. S. & Boshoff, C. Toward personalized treatment approaches for non-small-cell lung cancer. Nat. Med.27, 1345–1356 (2021). - PubMed
-
- Dagogo-Jack, I. & Lennerz, J. K. Personalized diagnostic workflows: the next wave of precision medicine in NSCLC. J. Thorac. Oncol.15, 888–890 (2020). - PubMed
Grants and funding
LinkOut - more resources
Full Text Sources
Research Materials
Miscellaneous
