. 2025 Feb;31(2):490-501.
doi: 10.1038/s41591-024-03422-8. Epub 2025 Jan 8.

High-efficiency base editing in the retina in primates and human tissues

Affiliations

High-efficiency base editing in the retina in primates and human tissues

Alissa Muller et al. Nat Med. 2025 Feb.

Abstract

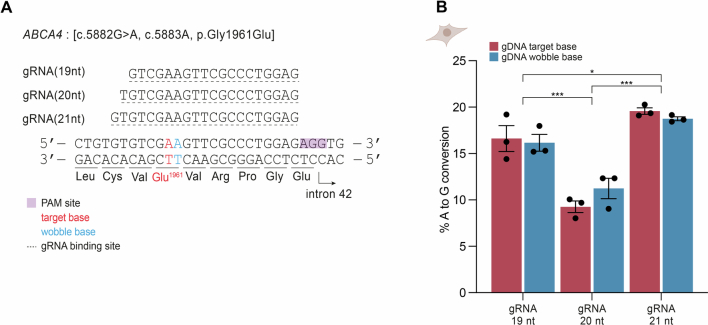
Stargardt disease is a currently untreatable, inherited neurodegenerative disease that leads to macular degeneration and blindness due to loss-of-function mutations in the ABCA4 gene. We have designed a dual adeno-associated viral vector encoding a split-intein adenine base editor to correct the most common mutation in ABCA4 (c.5882G>A, p.Gly1961Glu). We optimized ABCA4 base editing in human models, including retinal organoids, induced pluripotent stem cell-derived retinal pigment epithelial (RPE) cells, as well as adult human retinal explants and RPE/choroid explants in vitro. The resulting gene therapy vectors achieved high levels of gene correction in mutation-carrying mice and in female nonhuman primates, with average editing of 75% of cones and 87% of RPE cells in vivo, which has the potential to translate to a clinical benefit. No off-target editing was detectable in human retinal explants and RPE/choroid explants. The high editing rates in primates show promise for efficient gene editing in other ocular diseases that are targetable by base editing.


Conflict of interest statement

Competing interests: J.S., C.P-W., T.V., L.A.B., L.Y., A.K., D.B. and G.C. are employees and/or shareholders of Beam Therapeutics. Beam Therapeutics has filed a patent based on some of this work. H.P.N.S. is member of the Scientific Advisory Board of: Boehringer Ingelheim, Droia NV, Janssen Research & Development (Johnson & Johnson) and Okuvision and Tenpoint Therapeutics. H.P.N.S. is a member of the Data Monitoring and Safety Board/Committee of Belite Bio (DRAGON trial, NCT05244304 ; LBS-008-CT02, NCT05266014 ), F. Hoffmann-La Roche (VELODROME trial, NCT04657289 ; DIAGRID trial, NCT05126966 ; HUTONG trial) and ViGeneron (protocol no. VG901-2021-A) and a member of the Steering Committee of Novo Nordisk (FOCUS trial; NCT03811561 ). B.R. is a consultant of SpliceBio. All other authors declare no competing interests.

Figures

Fig. 1
Fig. 1. Adenine base editing corrects the most common Stargardt disease-associated mutation in vitro.
a, Images of a retina of an individual with Stargardt disease with biallelic ABCA4 mutations (c.5882G>A, p.Gly1961Glu); (c.66G>A, p.K = ) and of a healthy individual. The magnified grayscale images show the corresponding autofluorescence images. Decreased foveal autofluorescence (dark region) detected in the individual indicates atrophy of RPE cells. OCT images (bottom) show a cross-sectional view of the retina. The photoreceptor and RPE layers are highlighted to indicate foveal thinning. b, Dual AAV split-intein adenine base-editing strategy. Two adenines fall in the base-editing window: the c.5882A target base and the c.5883A wobble base of codon 1961. Conversion of the wobble base results in a silent base change. WtTadA and eTadA denote wild-type and evolved tRNA adenosine deaminase, respectively. c, Model systems used in the evaluation of ABCA4 base-editing efficiency in photoreceptors and RPE cells. Genotype of the model systems, target adenines, delivery modalities and the targeted sites are indicated. The colors in the fourth column highlight the model-specific gRNA. STGD-gRNA, Stargardt disease gRNA; wt-gRNA, wild-type gRNA; ms-gRNA, mouse gRNA. Illustrations in ce and illustrations of the AAV inverted terminal repeats (ITRs) created with BioRender.com. d, Base-editing efficiencies at the A7 and A8 sites with ABE7.10 split at five different positions in lenti-ABCA41961E HEK293T cells. Results were obtained from four biological replicates and presented as the mean ± s.d. ***P < 0.001, by three-way mixed-effects analysis of variance (ANOVA) with Dunnett’s correction, compared to the unsplit ABE7.10 construct. NS, not significant. e, Base-editing efficiencies at the A7 and A8 sites with different ABE versions in lenti-ABCA41961E HEK293T cells (top). Results were obtained from three replicates and are presented as means. Dual AAV-mediated base-editing efficiencies at the A8 site in gDNA of human iPS cell-RPE cells (bottom). Results were obtained from two replicates and are presented as means. f, AAV-mediated base-editing in gDNA and in ABCA4 mRNA of different in vitro models using an ABE8.5m base editor split at amino acid residue 310 of SpCas9 (total dose: 2.3 × 1011 vector genomes (v.g.) per organoid and 3.3 × 1011 v.g. per human tissue, 1:1 ratio of ABE(N) and ABE(C)). Results were obtained from two to three replicates and are presented as means.
Fig. 2
Fig. 2. In vitro optimization of the ABE AAV vectors.
a, Schematic of the dual AAV split-intein ABE8.5m(N) and ABE8.5m(C) vectors. b, Base-editing efficiencies in ABCA41961E/E human retinal organoids with split-Cfa intein versus split-Npu intein and 2× bpNLS versus 4× bpNLS sequences. Results were obtained from three biological replicates and are presented as the mean ± s.d. ***P = 1.70 × 10−4, by three-way mixed-effects ANOVA with Dunnett’s correction, compared to split-Cfa intein and 2× bpNLS. The dashed lines indicate editing rates using a construct with Cfa intein and 2× bpNLS. c, Base-editing efficiencies using different 3′ UTRs in ABCA41961E/E human retinal organoids. Results were obtained from three biological replicates and presented as the mean ± s.d. **P < 0.01, ***P < 0.001, by three-way mixed-effects ANOVA with Dunnett’s correction, compared to rabbit β-globin polyA (rbGlob). The dashed lines indicate editing rates using a construct with rbGlob polyA. d, Base-editing efficiencies using different 3′ UTRs in human retinal explants, and representative immunofluorescence images of ABE(N) and ABE(C) expression in the photoreceptor layer in whole-mount retinas (scale bars, 25 µm). Results were obtained from two biological replicates and are presented as means. The dashed lines indicate editing rates using a construct with rbGlob polyA. Cyan, ABE(N); yellow, ABE(C); gamma correction has been applied to obtain an optimal dynamic range for visualization. e, Base-editing efficiencies using different 3′ UTRs in human RPE/choroid explants. Results were obtained from two biological replicates and are presented as means. The dashed lines indicate editing rates using a construct with rbGlob polyA. Illustrations in be and illustrations of the AAV ITRs and AAV capsid in a created with BioRender.com. f, Representative immunofluorescence images of human retinal explants transduced with the AAV9-PHP.eB or AAV5 capsid encoding CMV-eGFP. Scale bars, 500 µm (left) and 25 µm (middle); right, quantification of eGFP-expressing cones and rods. Results were obtained from two to three biological replicates and are presented as the mean ± s.d. Gray, Hoechst; green, eGFP; magenta, arrestin3. g, Base-editing efficiencies with AAV5-SABE1 in human retinal explants and RPE/choroid explants, human iPS cell-RPE cells and sorted cones and rods. Results were obtained from three to four biological replicates and are presented as the mean ± s.d.
Fig. 3
Fig. 3. In vivo base editing in mice.
a, Experimental design. Dual AAV9-PHP.eB-SABE1 was delivered by subretinal injection. Eyes were harvested at 2, 4 or 8 weeks after injection and the retina and RPE/choroid/sclera were processed separately. Illustration in a and illustrations of the AAV ITRs and AAV capsid in a created with BioRender.com. b, Representative immunofluorescence images of ABE(N) and ABE(C) expression in the photoreceptor layer (scale bar, 12.5 µm) and RPE layer (scale bar, 25 µm) of Abca4ms1961G/G wild-type mice at 7 weeks after injection. Gray, Hoechst; cyan, ABE(N); yellow, ABE(C). c, In vivo base-editing efficiencies with the STGD-gRNA targeting the humanized allele in Abca4hu1961E/ms1961G(KO) mice in the retina and RPE/choroid/sclera at different time points after treatment. The analysis was performed on the humanized allele only. Results were obtained from four (week 2) and six (weeks 4 and 8) biological replicates (eyes) and are presented as the mean ± s.d. d, In vivo base-editing efficiencies with the ms-gRNA targeting the mouse alleles in Abca4ms1961G/G (wt) mice in the retina and RPE/choroid/sclera at 4 weeks after treatment. The analysis was performed on both mouse alleles. Results were obtained from four biological replicates (eyes) and are presented as mean ± s.d. Source data
Fig. 4
Fig. 4. In vivo base editing in NHPs.
a, Schematic of the SABE(N) and SABE(C) constructs. b, Dual AAV5-SABE vectors were delivered to 23 eyes of NHPs by subretinal injection under the macula. Illustration in a, illustrations of the AAV ITRs and AAV capsid in a and illustration of the eye in b created with BioRender.com. Some of the injections also detached the fovea. OCT was used to confirm successful bleb formation. c, Experimental design. The number of eyes with fovea detached are indicated in brackets. d, Representative immunofluorescence images of ABE(N) expression in a NHP retinal section (scale bars, 20 μm). IS/OS, photoreceptor inner and outer segments; ONL, outer nuclear layer (photoreceptors); OPL, outer plexiform layer; INL, inner nuclear layer. Gray, Hoechst; cyan, ABE(N); magenta, arrestin3; gamma correction has been applied to obtain an optimal dynamic range for visualization. e, In vivo base-editing efficiencies in gDNA and ABCA4 mRNA in the retina with different base-editor constructs and at different doses. Results are presented as the mean ± s.d. Significance for dose response was calculated using a one-way ANOVA with Tukey’s correction, (gDNA: *P = 0.011, ABCA4 mRNA: *P = 0.011). f, In vivo base-editing efficiencies in gDNA and ABCA4 mRNA in the RPE/choroid with different base-editor constructs and at different doses. Results are presented as the mean ± s.d. g, In vivo base-editing efficiencies in gDNA of sorted cones and rods and representative immunofluorescence images of sorted cells (scale bars, 25 μm). IS, photoreceptor inner segment. Results are presented as the mean ± s.d. White, Hoechst; magenta, arrestin3; orange, rhodopsin. h, In vivo base-editing efficiencies in the foveal retina and RPE/choroid in gDNA at different dose levels and with different constructs. Results are presented as the mean ± s.d.
Fig. 5
Fig. 5. In vivo base editing in NHPs with optimized AAV-SABE1.
a, Alkaline gel electrophoresis image (left) and 2D-ddPCR (right) of SABE1(N) and SABE1(C) packaged into AAV5-v1 (1–2), AAV5-v2 (3–4) or AAV9-PHP.eB (5–6). GOI, gene of interest. b, Schematic showing the key differences between the AAV5-v1 (top) and AAV5-v2 (bottom) Rep/Cap packaging plasmids. c, Experimental design showing different injection conditions, the number of eyes injected and the number of eyes in which the fovea was detached (in brackets). Illustration in c created with BioRender.com. d, In vivo base-editing efficiencies in the retina in gDNA and ABCA4 mRNA with AAV5-v2-SABE1 (left) and AAV9-PHP.eB-SABE1 (right) at different dose levels. Results are presented as the mean ± s.d. The dashed lines indicate editing rates using AAV5-v1 at 1 × 1011 v.g. per eye (left) or AAV5-v1 at 3 × 1011 v.g. per eye (right); data are from Fig. 4e. Fold improvements compared to AAV5-v1 are indicated above the bars. e, In vivo base-editing efficiencies in the RPE/choroid in gDNA and ABCA4 mRNA with AAV5-v2-SABE1 (left) and AAV9-PHP.eB-SABE1 (right) at different dose levels. Results are presented as the mean ± s.d. The dashed lines indicate editing rates using AAV5-v1 at 1 × 1011 v.g. per eye (left) or AAV5-v1 at 3 × 1011 v.g. per eye (right); data are from Fig. 4f. Fold improvements compared to AAV5-v1 are indicated above the bars. f, In vivo base-editing efficiencies in gDNA of sorted cones and rods with AAV5-v2-SABE1 (left) and AAV9-PHP.eB-SABE1 (right) at different dose levels. Results are presented as the mean ± s.d. The dashed lines indicate editing rates using AAV5-v1 at 1 × 1011 v.g. per eye (left) or AAV5-v1 at 3 × 1011 v.g. per eye (right); data are from Fig. 4g. Fold improvements compared to AAV5-v1 are indicated above the bars. g, In vivo base-editing efficiencies in the foveal retina and RPE/choroid with AAV5-v2-SABE1 (left) and AAV9-PHP.eB-SABE1 (right) at different dose levels. Results are presented as the mean. Source data
Fig. 6
Fig. 6. Off-target profile of the STGD-gRNA on human retinal and RPE/choroid explants.
a,b, Circos plots visualizing the off-target profile of the STGD-gRNA. Each sector in the circos plot corresponds to one chromosome that is indicated by the number in the outermost track. The second track shows the results from the ONE-seq assay with the bars representing the counts per million (CPM) for each genomic site. The green bar corresponds to the on-target site, and the red bars represent off-target sites for which the CPM passed the assay threshold of 200 CPM. The innermost track shows the targeted sequencing results of the sites nominated by the ONE-seq assay as well as sites with ≤3 mismatches to the STGD-gRNA, from human retinal explants (a; 399 genomic sites; 811 adenine base-editing positions) and RPE/choroid explants (b; 401 genomic sites; 812 adenine base-editing positions) treated with AAV5-v2-SABE1. The logarithm of base 2 of the odds ratio (log2(OR)) quantifying the A-to-G enrichment at each genomic site in the treated samples is plotted along the vertical axis of the track. Statistical significance was determined by Fisher’s exact test and expressed as −log10 P value. The on-target site, for which the logarithm of the OR was significant (−log10(P value) > 20), is colored in green. Sites for which the enrichment was not significant (−log10(P value) < 20) are colored in gray. Illustrations in a and b created with BioRender.com.
Extended Data Fig. 1
Extended Data Fig. 1. c.5882G>A haplotype categories and percent of patients who have a fully correctable allele by SABE.
Our analysis is based on published genetic data from 150 Stargardt patients mostly from European descent. A) Possible haplotypes found in Stargardt patient with at least one allele including c.5882G>A. B) Counts and percentage of different haplotypes found in the published study. C) Fraction of patients who have at least one allele, which is fully or partially correctable by SABE. D) Pie chart showing fraction of STGD patients carrying the p.Gly1961Glu mutation who have at least one allele, which is fully (green) or partially (red) correctable by SABE. The calculation is based on Lee W et al. and was applied on a large number of patients analyzed by Cornelis SS et al. E) Depiction of possible ABCA4 genotypes with respect to SABE-mediated correction. Concerning patients with homozygous haplotype 1, we expect other yet unknown modifier(s) (labeled with question mark) since homozygosity for c.5882G>A alone was shown not to lead to disease. Therefore, we considered haplotype 1 as “partially correctable”. VUS, variant of uncertain significance.
Extended Data Fig. 2
Extended Data Fig. 2. Adenine base-editing efficiency by different gRNAs.
A) Schematic of a fragment of the ABCA4 exon 42 with the NGG-PAM sequence indicated in purple, the Stargardt c.5882A target base highlighted in red, and the c.5883A wobble base shown in blue. B) Base-editing efficiencies at the target- and wobble bases with the unsplit ABE7.10 base editor in combination with the different gRNAs in lenti-ABCA41961E HEK293T cells. Results were obtained from three biological replicates (eyes) and are presented as mean ± s.d. *P < 0.05, ***P < 0.001 by three-way mixed-effect ANOVA with Tukey’s correction. Illustration in b created with BioRender.com.
Extended Data Fig. 3
Extended Data Fig. 3. Conservation of the ABCA4 sequence around p.Gly1961 and ABE-mediated cytosine editing on the ABCA4 gene.
A) The table shows the sequence alignment between humans and 10 other vertebrates. The first row shows the human ABCA4 reference sequence. All sequence changes to the human sequence are indicated in bold. The second row shows the ABCA4 c.5882A allele, with the A7 target base highlighted in red. The third and fourth rows show the most frequent base-editing outcomes in our study. The two observed bystander edits, c.5880C to c.5880T at position five (c.5880 C>T, p.Val1960 = ) and c.5883A to c.5883G at position eight (c.5883A>G, p.Gly1961=) lead to silent changes, do not affect conserved base positions, and are present in other species. These results suggest that these bystander base changes have no biological relevance. B) Fragment of the ABCA4 exon 42 with the base-editor window highlighted in grey. The base-editor window also contains a TC sequence that constitutes a possible motif for ABE-mediated cytosine editing. ABCA4 c.5880C to c.5880T bystander editing results in a silent change (c.5880C>T, p.Val1960=). This change is not conserved and is expected to have no biological relevance. C) Adenine base-editing efficiencies at the A8 site and cytosine base-editing efficiencies at the C5 site with different dual AAV-ABE versions in human iPS cell-RPE cells. Results were obtained from two biological replicates and are presented as mean. Illustration in c created with BioRender.com.
Extended Data Fig. 4
Extended Data Fig. 4. Generation of the ABCA4G1961E human mutant iPSC line.
A) Strategy for the generation of an ABCA4G1961E iPSC line. ABCA4 exon 42 (blue box) with flanking introns (top). The PAM site is highlighted in purple, and the gRNA binding site is indicated by a black dashed line. The black arrowheads point to the PAM disruption site (silent mutation) and the red arrowheads point to the ABCA4 c.5882G>A mutation. Representative Sanger sequencing trace of the ABCA41961E/E clone that was selected for human retinal organoid induction (bottom). B) Results from targeted deep-sequencing of the ABCA41961G/E (top) and ABCA41961E/E (bottom) clone confirming successful knock-in of the target mutation in a heterozygous or homozygous form. C) Results from the iPSC digital aneuploidy test, confirming the genomic integrity of the ABCA41961G/E (top) and ABCA41961E/E (bottom) clone. These clones were used for human retinal organoid induction. D) Confocal images of ABCA41961G/E (left) and ABCA41961E/E (right) iPSCs. Green: antibody for pluripotency markers (NANOG, SOX2, OCT4, SSEA4); grey: Hoechst (scale bars: 100 µm). The experiment was performed once with one biological replicate.
Extended Data Fig. 5
Extended Data Fig. 5. Characterization of the ABCA4G1961E human retinal organoids.
A) Confocal images of ABCA41961G/G (left), ABCA41961G/E (middle), and ABCA41961E/E (right) human retinal organoids. Grey: Hoechst; cyan: rhodopsin; magenta: arrestin3 (scale bars: 25 µm). B) 2D UMAP projection of single cells from human retinal organoids ordered by the ABCA4 genotype (ABCA41961G/G human retinal organoids: left; ABCA41961G/E human retinal organoids: middle, and ABCA41961E/E human retinal organoids: right) and the developmental stage (immature: top; mature: bottom). C) 2D UMAP plot of scRNA data from mature human retinal organoids colored by cell type and plotted separately by the ABCA4 genotype (ABCA41961G/G human retinal organoids: left; ABCA41961G/E human retinal organoids: middle, and ABCA41961E/E human retinal organoids: right). D) Heat map for Jensen–Shannon divergence (JSD) showing the similarity between organoids of different ABCA4 genotypes at two different developmental stages (immature: top; mature: bottom). E) Results from targeted deep-sequencing of the ABCA41961G/E clone confirming successful knock-in of the target mutation in a heterozygous form. Confocal images of un-fed and POS-fed iPS cell-RPE cells. Grey: ZO-1; magenta: ceramide (scale bars: 25 µm). Quantification of ceramide intensity signal, for un-fed and POS-fed iPS cell-RPE cells. F) Genotypes of patient iPS cell-RPE cells. Quantification of (G) ceramide intensity signal, (H) filipin-stained lipid deposits and (I) BODIPY-stained lipid deposits (one outlier point in control 2 was removed for plotting) for un-fed and POS-fed controls and patient-derived iPS cell-RPE cells. For BODIPY-stained lipid deposits. Statistical tests used were two-sided, *P = 0.0296 for the interaction between feeding condition and sample (control and patient) in the ANOVA model with the count in fed condition being higher than in unfed condition in patient and lower in control. For Extended Data Fig. 5G-I, the experiment was performed twice with two biological replicates and results are presented as mean ± s.d.
Extended Data Fig. 6
Extended Data Fig. 6. Generation and characterization of Abca4hu1961E mice.
A) Strategy for the generation of the Abca4hu1961E mouse line. Abca4 exon 42 (blue box) with flanking introns. The PAM sites are highlighted, and the gRNA binding sites are indicated by black dashed lines. The red arrowhead points to the p.Gly1961Glu mutation. Bold nucleotides indicate nucleotide changes due to humanization. Note the deletion in the downstream intron – this is intentional and was introduced to disrupt the PAM site. The deletion is not expected to interfere with splicing as it is at position +9, at which there is no base preference for canonical splicing. B) Sequencing of the gDNA of the Abca4hu1961E allele. The red arrowhead points to the Abca4 c.5882G>A mutation, the black arrowhead points to a deletion in the intron. C) Deep-sequencing of Abca4hu1961E/ms1961G(KO) mice, where the results indicate heterozygosity. The red arrowhead points to the Abca4 c.5882G>A mutation and the black arrowheads point to the nucleotide changes due to humanization. D) Retinoid and bisretinoid levels measured by LC-HRMS analysis of eyes of Abca4hu1961E/ms1961G(KO) mice compared to age-matched Abca4ms1961G/ms1961G(KO) littermates. Retinyl acetate was used as internal standard (IS) for normalization. Absolute levels of A2E (A2E targeted) were determined according to the standard curve for synthetic A2E. Results were obtained from four biological replicates, except for atROL for mutant animals, where 3 biological replicates were used (9 months). Results were obtained from six biological replicates, except for atROL, where 4 biological replicates were used (11 months). Results are presented as mean ± s.d. Statistical tests used were two-sided, A2E targeted: *P = 0.021, A2GPE: *P = 0.016, dimeric atRAL: **P = 0.002, atROL: P = 0.056 for the interaction between genotype and age in the ANOVA model. E) Fundus autofluorescence images of retinas from an Abca4hu1961E/ms1961G(KO) and wild-type Abca4ms1961G/G mouse (top). Quantification of the fluorescent signals at different ages (bottom). For Abca4hu1961E/ms1961G(KO) animals, results were obtained from eight (week 20), nine (week 33) and five (week 44) biological replicates (eyes). For wild-type Abca4ms1961G/G animals, results were obtained from eight (week 20), two (week 33) and five (week 44) biological replicates (eyes). F) Confocal images of sections from Abca4hu1961E/ms1961G(KO) mice. Grey: Hoechst; cyan: rhodopsin, magenta: ABCA4 (scale bar: 25 µm).
Extended Data Fig. 7
Extended Data Fig. 7. Dual AAV base editing in different in vitro model systems.
A) Comparison of in vitro base-editing efficiencies at the A8 site in gDNA with different ubiquitous and photoreceptor specific promoters in ABCA41961G/G human retinal organoids. Results were obtained from three biological replicates and are presented as mean ± s.d. *P < 0.05 by one-way ANOVA with Tukey’s multiple comparisons test. CMV: cytomegalovirus promoter, CBA: chicken β-actin promoter, ProA7: cone-specific promoter from, hGRK1: human rhodopsin-kinase promoter. B) AAV9-PHP.eB-SABE1 editing efficiencies at the A8 site in gDNA of human iPS cell-RPE cells at different time points and two different doses (high dose = 106 v.g./cell and low dose = 105 v.g./cell). Results were obtained from four biological replicates and are presented as mean ± s.d. C) AAV9-PHP.eB-SABE1 editing at the A7 and A8 sites in gDNA of ABCA41961E/E human retinal organoids. Results were obtained from five biological replicates and are presented as mean ± s.d. D) AAV5-v2-SABE1 editing efficiencies at the A8 site in gDNA, ABCA4 mRNA and sorted cones and rods of human retinal explants 5 weeks post-transduction. Results were obtained from three biological replicates and are presented as mean ± s.d. E) AAV5-v2-SABE1 editing efficiencies at the A8 site in gDNA and ABCA4 mRNA of human RPE/choroid explants 5 weeks post-transduction. Results were obtained from three biological replicates and are presented as mean ± s.d. Illustrations in ae created with BioRender.com.
Extended Data Fig. 8
Extended Data Fig. 8. In vitro AAV capsid screen (low dose).
A) Representative images of ABCA41961G/G human retinal explants transduced with different AAV capsids encoding for CMV-eGFP. Results are from 5 weeks after transduction (4.7 × 10¹⁰ v.g./explant). Efficient cone-photoreceptor transduction is shown by colocalization of eGFP with arrestin3 (merge) (scale bars: 25 µm). B) Representative images of ABCA41961G/G human retinal organoids transduced with the same capsids 4 weeks after transduction (3 × 10¹⁰ v.g./organoid). Efficient cone-photoreceptor transduction is shown by colocalization of eGFP with arrestin3 (merge) (scale bars: 50 µm). C) Representative images of ABCA41961G/G human RPE/choroid explants transduced with AAV5- or AAV9-PHP.eB capsids 5 weeks after transduction (4.7 × 10¹⁰ v.g./explant) (scale bars: 25 µm). Grey: Hoechst; magenta: arrestin3; green: eGFP. The number of independent experiments and biological replicates are included in the Methods section, under ‘Statistics and Reproducibility’. Illustrations in ac created with BioRender.com.
Extended Data Fig. 9
Extended Data Fig. 9. In vitro AAV capsid screen (high dose).
A) Representative images of ABCA41961G/G human retinal explants transduced with different AAV capsids encoding for CMV-eGFP. Results are from 5 weeks after transduction (2.5 × 10¹¹ v.g./explant). Efficient cone-photoreceptor transduction is shown by colocalization of eGFP with arrestin3 (merge) (scale bars: 25 µm). B) Representative images of ABCA41961G/G human retinal organoids transduced with the same capsids 4 weeks after transduction (1.15 × 10¹¹ v.g./organoid). Efficient cone-photoreceptor transduction is shown by colocalization of eGFP with arrestin3 (merge) (scale bars: 50 µm). C) Representative images of ABCA41961G/G human RPE/choroid explants transduced with AAV5- or AAV9-PHP.eB capsids 5 weeks after transduction (2.5 × 10¹¹ v.g./explant) (scale bars: 25 µm). Grey: Hoechst; magenta: arrestin3; green: eGFP. The number of independent experiments and biological replicates are included in the Methods, under ‘Statistics and Reproducibility’. Illustrations in ac created with BioRender.com.
Extended Data Fig. 10
Extended Data Fig. 10. In vivo ABCA4 base editing in non-ocular tissues from subretinally injected mice and NHPs.
A) In vivo base-editing efficiencies in mouse tissues at the A7 and A8 site in Abca4 gDNA and mRNA in the retina and RPE/choroid/sclera as well as in Abca4 gDNA of different tissues of the visual pathway, cortex, cerebellum and peripheral organs. Tissues were harvested 5 weeks after subretinal injection. Results were obtained from two biological replicates (eyes) and one replicate (non-occular tissues). Results are presented as mean. B) In vivo base-editing efficiencies in NHPs at the A8 site in ABCA4 gDNA and mRNA in the retina and RPE/choroid as well as in ABCA4 gDNA of different tissues of the visual pathway, cortex, cerebellum and peripheral organs. Tissues were harvested 20 weeks after subretinal injection. Results were obtained from four biological replicates (eyes) and two biological replicates (non-occular tissues). Results are presented as mean ± s.d. Illustrations in a and b created with BioRender.com.

Similar articles

Cited by

References

    1. Hanany, M., Rivolta, C. & Sharon, D. Worldwide carrier frequency and genetic prevalence of autosomal recessive inherited retinal diseases. Proc. Natl Acad. Sci. USA117, 2710–2716 (2020). - PMC - PubMed
    1. Allikmets, R. et al. Mutation of the Stargardt disease gene (ABCR) in age-related macular degeneration. Science277, 1805–1807 (1997). - PubMed
    1. Quazi, F., Lenevich, S. & Molday, R. S. ABCA4 is an N-retinylidene-phosphatidylethanolamine and phosphatidylethanolamine importer. Nat. Commun.3, 925 (2012). - PMC - PubMed
    1. Scortecci, J. F. et al. Cryo-EM structures of the ABCA4 importer reveal mechanisms underlying substrate binding and Stargardt disease. Nat. Commun.12, 5902 (2021). - PMC - PubMed
    1. Fujinami, K. et al. Detailed genetic characteristics of an international large cohort of patients with Stargardt disease: ProgStar study report 8. Br. J. Ophthalmol.103, 390–397 (2019). - PMC - PubMed

Substances

LinkOut - more resources