. 2025 Jan;27(1):73-86.
doi: 10.1038/s41556-024-01565-x. Epub 2025 Jan 8.

Chromosome mis-segregation triggers cell cycle arrest through a mechanosensitive nuclear envelope checkpoint

Affiliations

Chromosome mis-segregation triggers cell cycle arrest through a mechanosensitive nuclear envelope checkpoint

Solène Hervé et al. Nat Cell Biol. 2025 Jan.

Abstract

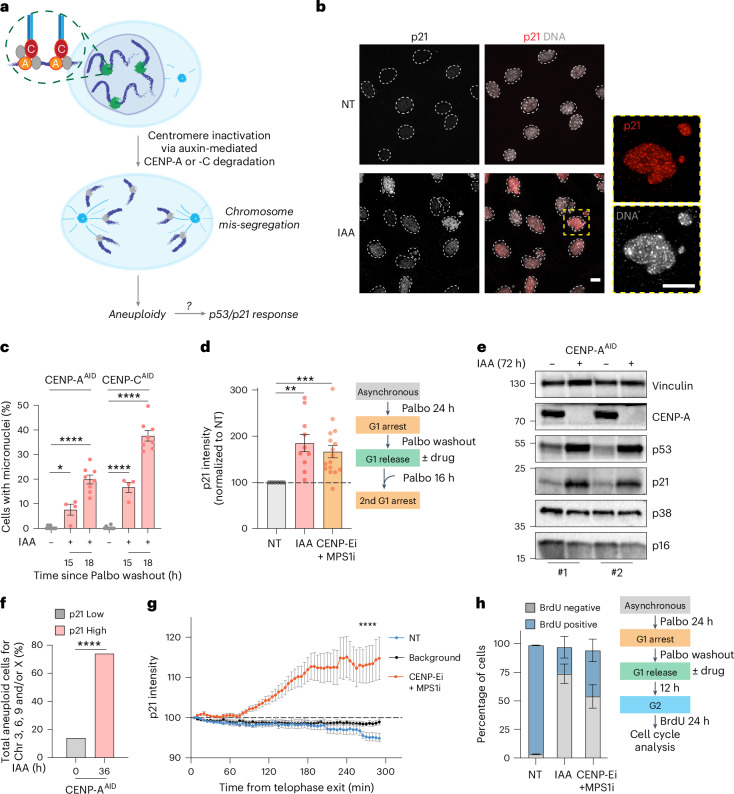
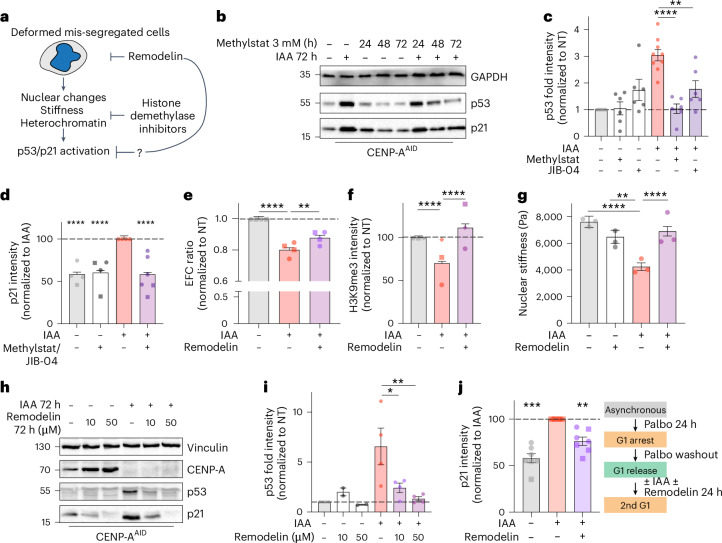
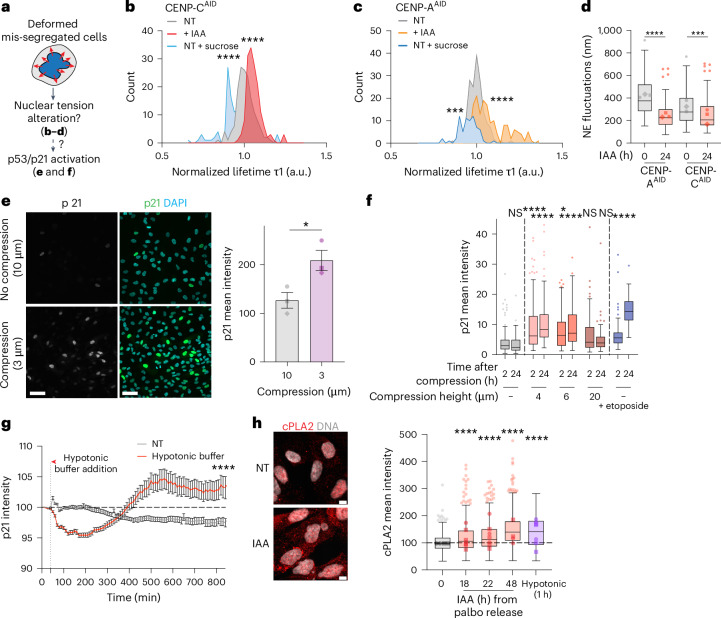
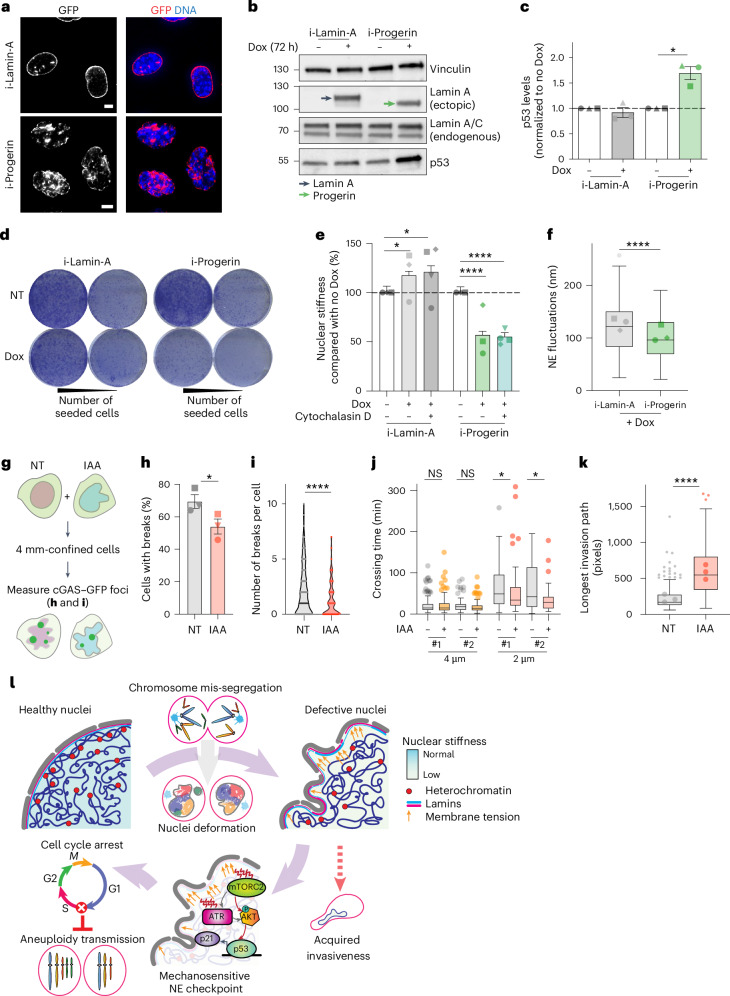
Errors during cell division lead to aneuploidy, which is associated with genomic instability and cell transformation. In response to aneuploidy, cells activate the tumour suppressor p53 to elicit a surveillance mechanism that halts proliferation and promotes senescence. The molecular sensors that trigger this checkpoint are unclear. Here, using a tunable system of chromosome mis-segregation, we show that mitotic errors trigger nuclear deformation, nuclear softening, and lamin and heterochromatin alterations, leading to rapid p53/p21 activation upon mitotic exit in response to changes in nuclear mechanics. We identify mTORC2 and ATR as nuclear deformation sensors upstream of p53/p21 activation. While triggering mitotic arrest, the chromosome mis-segregation-induced alterations of nuclear envelope mechanics provide a fitness advantage for aneuploid cells by promoting nuclear deformation resilience and enhancing pro-invasive capabilities. Collectively, this work identifies a nuclear mechanical checkpoint triggered by altered chromatin organization that probably plays a critical role in cellular transformation and cancer progression.


Conflict of interest statement

Competing interests: The authors declare no competing interests.

Figures

Fig. 1
Fig. 1. Chromosome mis-segregation triggers a p53–p21 response.
a, Schematic of the scope of the manuscript. A, CENP-A; C, CENP-C; ?, phenomenon sensed by p53/p21. b, Immunofluorescence images of p21 (red) activation and micronucleus formation upon IAA treatment (18 h) of CENP-CAID RPE-1 cells. Nuclei were counterstained with DAPI (grey). Scale bars, 5 μm. NT, not treated. c, Quantification of cells with micronuclei in untreated and IAA-treated CENP-AAID and CENP-CAID RPE-1 cells at the indicated times after release from G1 (palbociclib (Palbo) washout). n = 8 (untreated), 4 (IAA at 15 h) and 8 (IAA at 18 h) independent replicates, with 197, 59 and 159 CENP-AAID cells for these respective groups and 166, 61 and 160 CENP-CAID cells for these respective groups. Each dot represents the mean of one experiment. Statistical significance was determined by ordinary one-way analysis of variance (*P = 0.0229; ****P < 0.0001). d, Quantification of the normalized p21 immunofluorescence intensity in CENP-A/CAID or CENP-Ei+MPS1i RPE-1 cells after cell synchronization in G1, release and treatments performed according to the schematic to the right. Each dot represents the mean of one experiment. n = 6, 10 and 16 independent replicates with 60 cells per experiment for NT, IAA and CENP-Ei + MPS1i, respectively. Statistical significance was determined by one-sample two-sided t-test (**P = 0.0015; ***P = 0.0002). e, Immunoblot analysis with the indicated antibodies of CENP-AAID RPE-1 cells treated with IAA for 72 h where indicated. Two representative experiments are shown (#1 and #2). Vinculin served as the loading control. f, Quantification of IAA-induced aneuploidy relative to chromosomes 3, 6, 9 and X in CENP-AAID RPE-1 cells sorted by p21 negativity versus positivity, assessed by FISH in interphase. n = 150 nuclei counted per condition from one experiment. Statistical significance was determined by two-sided Fisher’s exact test (****P < 0.0001). g, Quantification of p21 signal during live-cell imaging of synchronized eGFP–p21 RPE-1 cells treated as indicated. T0 denotes telophase exit. The signals are normalized to T0 of the untreated group. n = 3 (background), 8 (NT) and 20 (CENP-Ei + MPS1i) cells from three independent replicates. Statistical significance was determined by Kruskal–Wallis test (****P < 0.0001), calculated at the last time point. h, Percentages of BrdU-negative and -positive CENP-AAID RPE-1 cells after cell cycle synchronization, release from G1 and treatments performed according to the schematic to the right. CENP-Ei and MPS1i were used at 0.5 and 1.0 μM, respectively. n = 2 independent replicates with 10,000 cells. In c, d, g and h, the error bars represent s.e.m. Source data
Fig. 2
Fig. 2. Altered NE and chromatin architecture in chromosome mis-segregated cells.
a, Electron microscopy of untreated and IAA-treated (24 h) RPE-1 cells Scale bar, 5 μm. b, Lamin immunofluorescence of untreated and IAA-treated (24 h) CENP-AAID RPE-1 cells. Scale bar, 5 μm. c, Quantification of nuclei deformation (solidity). n = 23, 11, 14 and 7 independent replicates with 60 cells per experiment per condition for NT, CENP-AAID, CENP-CAID and CENP-Ei + MPS1i, respectively. Statistical significance was determined by Kruskal–Wallis test (****P < 0.0001). d, Imaging of IAA-treated RPE-1 cells from metaphase until G1. The arrows denote misaligned chromosomes causing nuclear deformations. The values in the bottom right corners represent the time (in min) since the beginning of the recording (metaphase). Scale bar, 5 μm. e, Nuclear solidity (arbitrary units) during CENP-AAID RPE-1 live-cell imaging in untreated cells or upon IAA treatment. n = 25 cells per condition. Statistical significance was determined by unpaired two-sided t-test (****P < 0.0001), calculated at the last time point. f, Left, lamin immunofluorescence of G1 RPE-1 cells. Right, lamin intensity variation in untreated versus IAA-treated (24 h post-palbociclib release) RPE-1 cells. n = 6 and 9 independent replicates with 570 and 627 cells for NT and IAA, respectively. Statistical significance was determined by unpaired two-sided t-test (**P = 0.0014; ***P = 0.0004). Scale bar, 5 μm. g, SIM of lamins in untreated versus IAA-treated (24 h) RPE-1 cells. Arrows denote irregular lamin patches and invaginations. Scale bar, 5 μm. h, Left, H3K9me3 and p21 immunofluorescence. The arrows denote cells with reduced H3K9me3 and increased p21. Right, relative H3K9me3, HP1α and H3K27me3 signals in untreated versus IAA-treated (24 h post-palbociclib release) RPE-1 cells. n = 3 (three NT groups), 7 (HP1α; IAA), 15 (H3K9me3; IAA) and 8 (H3K27me3; IAA) independent replicates with 50 cells per experiment per condition. Statistical significance was determined by unpaired two-sided t-test (*P = 0.02; **P = 0.002). Scale bar, 5 μm. i, Lamin B1 ChIP-qPCR of lamin-associated domains in IAA-treated (24 h post-G1 release) RPE-1 cells. Immunoglobulin G (IgG) was used as the isotype control. Enrichment was computed as the percentage of input normalized to the NT group. Each dot represents enrichment relative to a discrete LAD locus (7). n = 3 independent replicates. Statistical significance was determined by one-sample two-sided t-test (***P = 0.0002). j, Nuclear stiffness normalized to the NT or dimethyl sulfoxide (DMSO) treatment groups. n = 3 independent replicates with 235, 157, 173, 80 and 96 cells for NT, CENP-A + IAA, CENP-C + IAA, DMSO and CENP-Ei, respectively. Statistical significance was determined by Kruskal–Wallis test (****P < 0.0001). k, Nuclear stiffness post-G1 release (18 h). n = 107 and 100 cells for NT and IAA, respectively, from three independent replicates. Statistical significance was determined by unpaired two-sided t-test (****P < 0.0001). In c, e, f and hk, the error bars represent s.e.m. In c, f, h, j and k, each dot represents the mean of one experiment. Source data
Fig. 3
Fig. 3. p53 activation is halted by restoration of heterochromatin and nuclear shape.
a, Schematic of the rationale behind the experiments presented in this figure. b, Immunoblot of p53/p21 in CENP-AAID RPE-1 cells. The loading control was GAPDH. c, Quantification of p53 from immunoblots of CENP-AAID RPE-1 cells treated as indicated for 72 h at 3 μM and normalized to GAPDH and NT (dashed line). n = 9 independent replicates for IAA and n = 6 for methylstat, JIB-04, IAA + methylstat and IAA + JIB-04. Statistical significance was determined by Kruskal–Wallis test (**P = 0.0024; ****P < 0.0001). d, p21 immunofluorescence signals of CENP-AAID (circles) and CENP-CAID RPE-1 cells (squares) treated for 72 h with IAA and/or methylstat/JIB-04 (3 μM). n = 335, 274, 229 and 376 cells for the indicated conditions (left to right in the graph) from four independent replicates. Statistical significance was determined by Kruskal–Wallis test (****P < 0.0001). e, Elliptic Fourier coefficient (EFC) ratios (DAPI) of CENP-AAID (circles) and CENP-CAID RPE-1 cells (squares). Both IAA and remodelin were administered for 24 h at 50 μM. n = 284, 337 and 316 cells for NT, IAA and remodelin + IAA, respectively, from four independent replicates. Statistical significance was determined by Kruskal–Wallis test (**P = 0.0015; ****P < 0.0001). f, H3K9me3 immunofluorescence signal of CENP-AAID RPE-1 cells treated with IAA, remodelin or both for 24 h at 50 μM. n = 260, 233 and 242 cells for NT, IAA and remodelin + IAA, respectively, from three independent replicates depicted with different shapes. Statistical significance was determined by Kruskal–Wallis test (****P < 0.0001). g, Nuclear stiffness of CENP-AAID RPE-1 cells treated with IAA, remodelin or both for 24 h at 50 μM. n = 68, 69, 75 and 70 cells for NT, IAA, remodelin and remodelin + IAA, respectively, from three independent replicates. Statistical significance was determined by Kruskal–Wallis test (**P = 0.0018; ****P < 0.0001). h, Immunoblot showing p53 and p21 signals in CENP-AAID cells. The loading control was vinculin. i, Quantification of p53 signals from immunoblots of CENP-AAID cells, normalized to vinculin and NT (dashed line). n = 4 independent replicates. Statistical significance was determined by Kruskal–Wallis test (*P = 0.0220; **P = 0.0041). j, p21 immunofluorescence nuclear signals in CENP-AAID (circles) and CENP-CAID RPE-1 cells (squares). n = 3 (CENP-AAID) and 4 (CENP-CAID) independent replicates with 591, 553 and 545 cells for NT, IAA and remodelin + IAA, respectively. Statistical significance was determined by one-sample two-sided t-test (**P = 0.0019; ***P = 0.0001). In cg, i and j, the error bars represent s.e.m. Each dot represents the mean of one experiment. Source data
Fig. 4
Fig. 4. Alteration of nuclear membrane mechanics triggers p53/p21 activation in response to chromosome mis-segregation.
a, Schematic of the rationale behind the experiments presented in this figure. b,c, Distribution of fluorescence lifetimes with a Gaussian fit, measured using the ER Flipper-TR membrane tension probe, in CENP-CAID (b) and CENP-AAID RPE-1 cells (c) treated for 24 h with IAA. Sucrose treatment (1 M) served as a control. n = 3 independent replicates with 157, 152, 109, 169, 158 and 56 cells for NT, IAA and sucrose in CENP-AAID cells and NT, IAA and sucrose in CENP-CAID cells, respectively. Statistical significance was determined by Kruskal–Wallis test (***P = 0.0038; ****P < 0.0001). d, NE fluctuations measured in RPE-1 cells expressing LAP2β-GFP. n = 93, 91, 149 and 169 cells for NT and IAA in CENP-AAID cells and NT and IAA in CENP-CAID cells, respectively, from three independent replicates depicted with different shapes. Statistical significance was determined by Kruskal–Wallis test (***P = 0.0002; ****P < 0.0001). e, Representative images (left) and quantification (right) of p21 activation (eGFP–p21) in compressed RPE-1 cells (3 h). Each dot represents the mean of one experiment. n = 1,221 and 2,290 cells for 10 and 3 μm, respectively, from three independent replicates depicted with different shapes. Statistical significance was determined by unpaired two-sided t-test (*P = 0.0354). Scale bars, 30 μm. f, p21 intensity (eGFP–p21) in RPE-1 cells in suspension following compression. n = 82, 90, 98, 160, 90, 147, 63, 133, 79 and 90 cells for the conditions depicted from left to right, from two independent replicates. Etoposide (50 μM) was used as a positive control. g, Live p21 intensity (eGFP–p21) in RPE-1 cells in hypotonic versus isotonic medium. Continuous lines denote the average values of 28 (NT) and 35 (hypotonic buffer-treated) cells from n = 3 independent replicates. The horizontal dashed line marks the basal signal intensity to which the data have been normalized (T0). The vertical dashed line marks the time of hypotonic buffer addition. Statistical significance was determined by unpaired two-sided t-test (****P < 0.0001), calculated at the last time point. h, Left, cPLA2 immunofluorescence in CENP-CAID RPE-1 cells treated or not with IAA. Scale bars, 5 μm. Right, cPLA2 nuclear signal in CENP-AAID (circles) and CENP-CAID cells (squares). Hypotonic medium was used as the positive control. n = 627, 628, 650, 1,065 and 653 cells for 0, 18, 22 and 48 h IAA and hypotonic buffer, respectively, from four (48 h release) or six independent replicates. Statistical significance was determined by Kruskal–Wallis test (****P < 0.0001). In d, f and h, the central lines represent median values, the lower and upper bounds represent the 25th and 75th percentiles, the whiskers represent the furthest observations within 1.5× the interquartile range and the dots inside and outside the whiskers represent the means of one experiment and outlier data points, respectively. In e and g, the error bars represent s.e.m. NS, not significant. Source data
Fig. 5
Fig. 5. mTORC2 activation upon mis-segregation-dependent nuclear membrane alterations elicits p53/p21 activation.
a, Schematic of the screening process used to identify kinase inhibitors involved in p53/p21 activation in response to chromosome mis-segregation. b, Efficiency (dose–response slope) plotted against effect (percentage of p21-positive cells at 5 nM) for hits at 5 and 50 nM. c, Left, immunoblot of phospho-AKT (Ser473), phospho-p70 S6 (Thr389) and p70 S6. Vinculin and AKT were used as loading controls. Right, quantification of the phospho-AKT signal normalized to that of the loading control and NT. n = 14 independent replicates. Statistical significance was determined by one-sample two-sided t-test (*P = 0.0348). d, Left, immunoblot of p53 and p21 in CENP-AAID RPE-1 cells treated with the mTORC1/2 inhibitor INK-128, normalized to vinculin and NT. Vinculin was used as the loading control. Right, quantification of protein levels under the conditions shown for the immunoblot. n = 3 independent replicates. Statistical significance was determined by unpaired two-sided t-test (*P = 0.0068 and 0.0058). e, p21 immunofluorescence in G1 RPE-1 cells treated for 24 h with the mTORC1/2 inhibitor INK-128 (0.2 μM), the mTORC2 inhibitor JR-AB2-011 (5 μM) or the mTORC1 inhibitor rapamycin (0.1 μM). n = 11, 13, 7, 10 and 5 independent replicates with 400, 767, 423, 499 and 332 cells for the indicated conditions (left to right in the graph). Statistical significance was determined by one-sample two-sided t-test (**P = 0.046; ***P = 0.0010; ****P < 0.0001). mTORCi, mTORC inhibitor. f, p21 immunofluorescence in CENP-AAID RPE-1 cells treated with ipatasertib (an AKT inhibitor (AKTi)). n = 2 (0.1 μM) or four independent replicates with 225, 199, 104, 187, 194 and 185 cells for the conditions shown from left to right, respectively. The continuous line is the data interpolating curve. Statistical significance was determined by one-sample two-sided t-test (*P = 0.0112, 0.0198 and 0.0477, from left to right; ****P < 0.0001). g, Nuclear ATR immunofluorescence in CENP-AAID RPE-1 cells treated with IAA (with or without MPS1i). n = 250 and 449 cells for NT and IAA (−/+MPS1i), respectively, from three and five independent replicates. Statistical significance was determined by unpaired two-sided t-test (****P < 0.0001). h, p21 immunofluorescence in G1 CENP-A/CAID RPE-1 cells treated with VE-821 (5–10 μM). n = 103, 164 and 345 cells for NT, IAA and ATRi, respectively, from two (NT and IAA) or six (ATR) independent replicates. Statistical significance was determined by one-sample two-sided t-test (****P < 0.0001). i, Nuclear ATR immunofluorescence in G1 CENP-AAID (circles) and CENP-CAID RPE-1 cells (squares) treated with INK-128 (0.2 μM), JR-AB2-011 (5–10 μM) or ipatasertib (5–20 μM). n = 191, 166, 185, 192 and 182 cells for the indicated conditions (left to right in the graph), from four independent replicates. Statistical significance was determined by one-sample two-sided t-test (****P < 0.0001). In ci, the error bars represent s.e.m. Each dot represents the mean of one experiment. Source data
Fig. 6
Fig. 6. The NE stress checkpoint is a universal mechanism.
a, Inducible (i)-lamin A-GFP and progerin-GFP microscopy of doxycycline-treated RPE-1 cells. Scale bars, 5 μm. b, Lamin A-GFP and progerin-GFP immunoblot analysis. Vinculin was used as the loading control. Dox, doxycycline. c, Immunoblot quantification normalized to vinculin and the no-Dox condition. n = 3 independent replicates. Statistical significance was determined by unpaired two-sided t-test (*P = 0.0348). d, Colony formation assays after 7 d of doxycycline treatment (50 ng ml−1). e, AFM-measured nuclear stiffness. Doxycycline was administered for 72 h (10 ng ml−1 for lamin A and 50 ng ml−1 for progerin). Cytochalasin D was administered at 200 nM for 15 min. n = 97, 237, 90, 82, 162 and 107 cells for the indicated conditions (left to right in the graph), from three or four (Dox + cytochalasin D) independent replicates. Statistical significance was determined by Kruskal–Wallis test (*P = 0.0468 and 0.0396, from left to right; ****P < 0.0001). f, NE fluctuations following doxycycline treatment for 72 h. n = 311 and 268 cells for lamin A and progerin, respectively, from three independent replicates. Statistical significance was determined by two-sided Mann–Whitney test (****P < 0.0001). g, Workflow of the cell confinement experiment used to obtain the results shown in h and i. h, Percentages of cells with eGFP–FLAG–cGAS-E225A/D227A foci at the nuclear periphery in CENP-AAID RPE-1 cells left untreated or treated with IAA (24-48 h). n = 157 and 139 cells for NT and IAA, respectively, from three independent replicates represented by different symbols. Statistical significance was determined by two-sided Fisher’s exact test (*P = 0.0338). i, Numbers of eGFP–FLAG–cGAS-E225A/D227A foci at the nuclear periphery in CENP-AAID RPE-1 cells left untreated or treated with IAA (48 h). n = 157 and 139 cells for NT and IAA, respectively, from three independent replicates. Each dot represents a cell. Statistical significance was determined by two-sided Mann–Whitney test (****P < 0.0001). j, Crossing time through 4 and 2 μm microchannels (24 h imaging) of untreated or IAA-treated CENP-AAID RPE-1 cells. n = 120, 126, 72, 94, 83, 54, 28 and 47 cells for the indicated conditions (left to right in the graph), from two independent replicates. Statistical significance was determined by Mann–Whitney test (*P = 0.0416 and 0.0115, from left to right). k, Invasion path length through a collagen matrix of CENP-AAID RPE-1 cells. n = 234 and 568 cells for NT and IAA, respectively, from three independent replicates. Statistical significance was determined by two-sided Mann–Whitney test (****P < 0.0001). l, Model for the mechanosensitive NE checkpoint in response to chromosome mis-segregation. In f, j and k, the central lines represent median values, the lower and upper bounds represent 25th and 75th percentiles, the whiskers represent the furthest observations within 1.5× the interquartile range and the dots inside and outside the whiskers represent the means of one experiment and outlier data points, respectively. In c, e and h, the error bars represent s.e.m. Each dot represents the mean of one experiment. Source data
Extended Data Fig. 1
Extended Data Fig. 1. Chromosome mis-segregation triggers a p53-p21 response.
a. Number of mitotic CENP-AAID RPE-1 cells from live imaging post-G1 release. b. RPE-1 cells with micronuclei. Each dot: mean of one experiment. n = 3 or 4 (CENP-AAID 48 h) independent replicates with 100 cells/experiment/condition. Ordinary one-way ANOVA: *p = 0.0801; **p = 0.0026; ****p < 0.0001. c. Distribution of the number of micronuclei/cell from (b). n = 2 independent replicates with 40 cells/experiment/condition. d. p53 immunofluorescence in RPE-1 cells. N = 64, 82, 65 and 91 cells for NT, 24hIAA, 2nd G1 arrest and IAA+2nd G1 arrest, respectively, from one experiment. Unpaired two-sided t-test: ∗∗∗p = 0.0003; ∗∗∗∗p < 0.0001. e. p21 immunofluorescence in RPE-1 cells. N = 211, 222, 218, 116, 162 and 120 cells for the treatment groups shown from left to right, from one experiment. Kruskal-Wallis test: ***p = 0.0008; ****p < 0.0001. f. p21 immunofluorescence in RPE-1 cells. N = 40, 46, 58 and 52 cells for the treatment groups shown from left to right, from one experiment. Unpaired two-sided t-test: ns, not significant. g. FACS plots of p21-positive and -negative sorted (Alexa Fluor-647) CENP-AAID RPE-1 cells (IAA: 36 h). h. Chromosome-specific FISH in p21-negative and p21-positive cells. N = 460, 942, 753, 559 cells for chromosomes X, 3, 9 and 6, respectively, from one experiment. i. p21 intensity (from Fig. 1g) in eGFPp21 RPE-1 live-cell imaging (normalized to T = 0 for untreated cells). Coloured lines: eGFPp21 intensity in single CENP-Ei+Mps1i-treated cells; black lines: in untreated cells; grey lines: background. n = 3 independent replicates with 3, 8 and 20 cells for Bkg, NT and CENP-Ei+Mps1i, respectively. j. p21 immunofluorescence in G1 RPE-1 cells. N = 57, 50, 62, 67, 57, and 72 cells for the treatment groups shown from left to right, from one experiment. Kruskal-Wallis test: ***p = 0.0002; ****p < 0.0001. k. Percentages of cells in G1, S and G2/M phases. N = 201, 216, 355 and 235 cells for 0 h, 24 h, 48 h and 72 h IAA respectively, from two independent replicas. Two-sided Fisher’s exact test: ****p < 0.0001. l. Percentages of S-phase cells (EdU positive) of p53 and scramble shRNA in RPE-1 cells. N = 50 cells/condition from one experiment. m. Percentages of BrdU-negative and -positive CENP-AAID RPE-1 cells. n = 3 independent replicates with 10,000 cells. In df and j, the center line is the median, the lower and upper bounds are the 25th and 75th percentiles, the whiskers are the furthest observations within 1.5× the interquartile range and the dots inside and outside the whiskers are the mean of one experiment and outlier data points, respectively. In b and m, the error bars represent s.e.m. Source data
Extended Data Fig. 2
Extended Data Fig. 2. Chromosome mis-segregation triggers p53/p21 response independent of DNA damage, replication stress and extended mitotic duration.
a. γH2A.X immunofluorescence intensity in RPE-1 cells. N = 75, 65, 94 and 105 cells for the treatment groups shown from left to right, from one experiment. Unpaired two-sided t-test. b. Number of 53BP1 foci/nucleus in RPE-1 cells. N = 211, 222, 136 and 162 cells for the treatment groups shown from left to right, from one experiment. Unpaired two-sided t-test. c. p21 immunofluorescence intensity in RPE-1 cells. N = 56, 52 and 61 cells for NT, IAA and IAA+ATMi, respectively, from one experiment. Kruskal-Wallis test: *p = 0.0207. d. Immunoblot analysis of RPE-1 cells. IAA: 72 h. Loading control: Vinculin. e. Immunoblot analysis in RPE-1 cells for ATMi efficacy. Positive control: Etoposide. Loading control: Vinculin. f. p21 immunofluorescence intensity in micronuclei-negative and -positive RPE-1 cells treated with IAA (24 h). N = 73, 47, 73 and 47 cells forthe treatment groups shown from left to right, from one experiment. Unpaired two-sided t-test. g. p21 immunofluorescence intensity in RPE-1 cells, normalized to the untreated group. n = 3, 3, 3, 4, 7 and 4 independent replicates with 30 cells/experiment/condition for the treatment groups shown from left to right. Wilcoxon t-test: **p = 0.0060, 0.0021, 0.0011 and 0.0062 from left to right; ****p < 0.0001. h. Immunoblot analysis of RPE-1 cells. Loading control: Vinculin. i. p21 immunofluorescence intensity in CENP-AAID (circle) or CENP-CAID (square) RPE-1 cells (MPSi: 24 h MPI-0479605 or Reversine). n = 3, 7, 7, 7 and 12 independent replicates with 79, 91, 74, 68 and 63 cells/experiment for NT, IAA, IAA + 0.2 μM Mps1i, IAA + 0.5 μM Mps1i and 0.5 μM Mps1i, respectively. Kruskal-Wallis test: **p = 0.0051. j. p21 immunofluorescence intensity. N = 70 and 47 cells for −/+ IAA respectively, from one experiment. Unpaired two-sided t-test: ****p < 0.0001. k. Immunoblot analysis. Positive control: Etoposide. Loading control: Vinculin. l. 53BP1 immunofluorescence intensity. N = 70 and 46 cells for −/+ IAA respectively, from one experiment. Unpaired two-sided t-test. In ac, f, j and l, the center lines are median values, the lower and upper bounds are 25th and 75th percentiles, the whiskers are the furthest observations within 1.5× the interquartile range and the dots outside the whiskers are the outlier data points. In g and i, the error bars represent s.e.m. Each dot is the mean of one experiment. Source data
Extended Data Fig. 3
Extended Data Fig. 3. NE alterations are triggered by chromosome mis-segregation.
a. Solidity, circularity and EFC ratio of palbociclib-released RPE-1 cells. N = 85, 114, 98, 96, 67, 61, 34, 66 cells for the treatment groups shown from left to right. Unpaired two-sided t-test: ****p < 0.0001. b. Nuclear solidity of CENP-AAID RPE-1 cells. Each dot: one nucleus. N = 66, 53, 156, 139 cells for the treatment groups shown from left to right, from one experiment. Unpaired two-sided t-test ****p < 0.0001. c. Solidity and p21 immunofluorescence of CENP-AAID RPE-1 cells. n = 4 independent replicates with N = 60 cells/experiment/condition. d. RPE-1 cell immunoblot (IAA: 72 h). Loading control: Vinculin. e. Coefficient of variation of Lamins (IAA 24 h). N = 105, 113, 85 and 96 cells for the treatment groups shown from left to right, from one experiment. Unpaired two-sided t-test: ***p = 0.0008; ****p < 0.0001. f. H3K9me3 immunofluorescence of RPE-1 cells. N = 64, 100, 62, 59, 43, 52, 50, 83, 63, 42, 64 and 101 cells for the treatment groups shown from left to right. Unpaired two-sided t-test: **p = 0.0028, ***p = 0.0007; ****p < 0.0001. g. H3K9me3 immunofluorescence of U-2 OS cells. Each dot: mean of one experiment. n = 7 independent replicates with 469 and 486 cells for −/+IAA, respectively. One sample two-sided t-test: *p = 0.0273. h. Left, TEM of CENP-CAID RPE-1 cells. Right, heterochromatin thickness. Each dot: one nucleus (N = 29 and 33 cells for −/+IAA, respectively, from one experiment). Scale bar: 2 μm. Unpaired two-sided t-test: **p = 0.0012. i. Nuclear stiffness of CENP-A/CAID RPE-1 cells. N = 31, 41, 36 and 51 cells for the treatment groups shown from left to right, from one experiment. Unpaired two-sided t-test: ****p < 0.0001. j. Force-distance curve of an indentation experiment (Cytochalasin D: 200 nM, 15 min). k. RPE-1 cell nuclear stiffness (Cytochalasin D: 200 nM, 15 min). N = 54, 56, 53 and 64 cells for the treatment groups shown from left to right for 3 independent replicates. Unpaired two-sided t-test. l. Left, actin (phalloidin) and microtubule (α-tubulin) imaging in G1 CENP-AAID RPE-1 cells (24 h post-release). Right, average areas of actin stress fibers (SFs) and microtubules (MT) per cell (N = 10 cells/field of view, each dot is one field of view of one experiment). Scale bars: 25 μm. In a, e, f, i and k, the center lines are medians, the lower and upper bounds are 25th and 75th percentiles, the whiskers are the furthest observations within 1.5× the interquartile range and the dots outside the whiskers are outlier data points. In b, c, g, h and l, the error bars are s.e.m. Source data
Extended Data Fig. 4
Extended Data Fig. 4. Restoration of heterochromatin and nuclear shape, but not perturbation of the cytoskeleton, prevent p53 activation.
a. p21 immunofluorescence signal of RPE-1 CENP-AAID cells (methylstat 3 μM). N = 87, 82, 51 and 67 cells for the indicated conditions (left to right in the graph), from one experiment. Kruskal-Wallis test: **p = 0.0016, ****p < 0.0001. b. p53 immunoblot analysis in RPE-1 CENP-AAID cells. Loading control: Vinculin. c. EFC ratio of CENP-A/CAID RPE-1 cells. N = 85, 114, 101, 34, 66 and 59 cells for the treatment groups shown from left to right, from one experiment. Kruskal-Wallis test: *p = 0.0398 and 0.0398. d. H3K9me3 immunofluorescence intensity in RPE-1 CENP-AAID cells (Remodelin: 50 μM). N = 103, 98 and 99 cells for the treatment groups shown from left to right, from one experiment. Kruskal-Wallis test: ****p < 0.0001. e. Nuclear stiffness of RPE-1 CENP-AAID cells (Remodelin: 50 μM, 24 h). N = 19, 25, 24, 24, 23, 22, 22, 27, 26, 23, 22 and 25 cells for the indicated conditions (left to right in the graph), from 3 independent replicates. Kruskal-Wallis test: *p = 0.0264; ***p = 0.0006. f. p21 immunofluorescence intensity in RPE-1 CENP-AAID cells (IAA 72 h). N = 87, 82, 69 and 59 cells for the indicated conditions (left to right in the graph), from one experiment. Kruskal-Wallis test: ****p < 0.0001. g. p21 immunofluorescence intensity of CENP-AAID RPE-1 cells (Blebbistatin: 100 μM; Dihydrocytochalasin B: 4 μM; Nocodazole: 100 ng/ml). N = 56, 52, 51, 60 and 71 cells for the indicated conditions (left to right in the graph), from one experiment. Kruskal-Wallis test. In a and cg, the center line is the median, the lower and upper bounds are the 25th and 75th percentiles, the whiskers are the furthest observations within 1.5× the interquartile range and the dots outside the whiskers are the outlier data points. Source data
Extended Data Fig. 5
Extended Data Fig. 5. p53/p21 activation is triggered by increased membrane tension.
a. γH2A.X immunofluorescence intensity (left) and quantification (right) after 3 h of compression at 3 μm or 10 μm (no compression) in RPE-1 cells. Each dot: mean of one experiment. Unpaired two-sided t-test *p = 0.0272. Scale bar 30 μm. n = 3 independent replicates with 1,221 and 2,290 cells for the treatment groups shown from left to right. b. Percentages of EGFP-FLAGcGASE225A/D227A RPE-1 cells with cGAS foci at the nuclear periphery before compression and foci induced by compression at 3 μm. n = 3 independent replicates with 1,888 cells. Two-sided Fisher’s exact test: **p = 0.0013. c. Percentages of cells positive for cytosolic NLS-GFP in CENP-AAID (circle) and CENP-CAID (square) RPE-1 cells (hypotonic buffer: 1 h, compression: immediately at 3 μm, IAA: 48 h). n = 3 independent replicates with 571, 2,412 and 1,658 cells for hypotonic buffer and compression −/+IAA, respectively. d. Percentages of mCherry-FLAGcGASE225A/D227A RPE-1 cells in suspension with cGAS foci at the nuclear periphery following compression for 2 h. n = 6 independent replicates with 231, 291, 349, 161 and 307 cells for 2/4/6/20/- μm compression, respectively. The center line is the median, the lower and upper bounds are the 25th and 75th percentiles, the whiskers are the furthest observations within 1.5× the interquartile range and the dots outside the whiskers are the outlier data points. Kruskal-Wallis test: **p = 0.0057. e. GFP signal intensity by live imaging of eGFPp21 RPE-1 cells in the presence of isotonic (left) or hypotonic (right) medium (added 30 min after video recording started; dotted line). The data are normalized to T0. Dashed line: 100 min. Continuous colored lines: single cells. In ac, the error bars are s.e.m. Each dot is the mean of one experiment. Source data
Extended Data Fig. 6
Extended Data Fig. 6. AKT and ATR are activated upon nuclear envelope stress.
a. Left, phospho-AKT (Ser473) immunofluorescence signal in CENP-AAID RPE-1 cells. Scale bars: 5 μm. Right, quantification of phospho-AKT in CENP-A/CAID RPE-1 cells. Positive control: hypotonic buffer. N = 1,913, 1,484 and 1,651 cells for the treatment groups shown from left to right, from 4 independent replicates. Kruskal-Wallis test: ****p < 0.0001. b. Immunoblot showing mTOR activation. Loading control: Vinculin. c. p53/p21 immunoblot with AKTi. Repeated 5 times with similar results. Loading control: Vinculin. d. ATR immunofluorescence signal in CENP-AAID RPE-1 cells. Scale bar: 5 μm. e. Left, p53 immunoblot of CENP-AAID RPE-1 cells (ATRi: 10 μM). Loading control: Vinculin. Right, quantification of p53 levels, normalized to Vinculin and untreated (dashed line). n = 6 independent replicates. Unpaired two-sided t-test *p = 0.0229. f. p53 phosphorylation immunoblot. Loading control: Vinculin. Positive control: Etoposide 20 μM. Repeated 2 times with similar results. g. p53 phosphorylation immunoblot (72 h; INK-128: 200 nM, MK-2206: 5 μM, Ipatasertib: 5 μM). Loading control: H3. Positive control: Etoposide 20 μM. Repeated 3 times with similar results. h. ATR nuclear intensity in RPE-1 cells. N = 43, 37, 44, 46 and 47 cells for the indicated conditions (left to right in the graph), from one experiment. Kruskal-Wallis test: **p = 0.0068; ****p < 0.0001. i. Left, AKT phosphorylation immunoblot. Loading control: Vinculin. Right, quantification of AKT phosphorylation normalized to Vinculin and untreated (dashed line). n = 3 independent replicates. Kruskal-Wallis test: *p = 0.0459. j. p21 immunofluorescence intensity (INK-128: 200 nM, JIB-04: 1.5 μM, Remodelin: 50 μM). n = 8, 7, 5, 6 and 4 independent replicates with 616, 684, 451, 287 and 285 cells for the indicated conditions (left to right in the graph). One-sample two-sided t-test: *p = 0.0170; ***p = 0.0001; ****p < 0.0001. k. Left, p53/p21 immunoblot in BJ-hTERT1 (MPS1i 0.5 μM + CENP-Ei 0.2 μM; ATRi VE-821). Loading control: Vinculin. Right, quantification of p53 levels normalized to Vinculin and DMSO. N = 6 (DMSO/Mps1i+CENP-Ei) and 3 (all other conditions) independent replicates. One sample two-sided t test: *p = 0.0112; **p = 0.0058; ****p < 0.0001. In a and h, the center lines are the medians, the lower and upper bounds are the 25th and 75th percentiles, the whiskers are the furthest observations within 1.5× the interquartile range and the dots outside the whiskers are the outlier data points. In e, i, j and k, the error bars are s.e.m. In e and i, each dot represents one experiment. In j and k, each dot is the mean of one experiment. Source data
Extended Data Fig. 7
Extended Data Fig. 7. mTORC2 senses nuclear membrane alterations in Progerin-expressing cells.
a. Cells with micronuclei. n = 3 independent replicates with 276, 215, 281 and 190 cells for the treatment groups shown from left to right. Kruskal-Wallis test. Doxycycline: 50 ng/mL for 72 h. b. Cell ploidy distribution. n = 3, 3, 4 and 4 independent replicates with 62, 61, 58 and 61 cells for the treatment groups shown from left to right. Kruskal-Wallis test. Doxycycline: 50 ng/mL for 72 h. c. γH2A.X immunoblot. Loading control: Vinculin. d. γH2A.X immunofluorescence. N = 551, 623, 363, 385, 216 cells for the treatment groups shown from left to right, from 3 or 2 (Etoposide) independent replicates. Etoposide: 20 μM for 24 h. Kruskal-Wallis test: ****p < 0.0001. e. Left, immunoblot in Progerin-expressing RPE-1 cells. Loading control: Vinculin. Right, quantification of p53 levels normalized to no Dox and Vinculin. n = 2, 4, 2 and 4 replicates for the treatment groups shown from left to right. f. Nuclear stiffness quantification. Doxycycline: 72 h 10 ng/mL for Lamin A cells, 72 h 50 ng/mL for Progerin cells; cytochalasin-D:200 nM; 15 min for all cells. n = 3 or 4 (Cytochalasin D) independent replicates with 97, 237, 90, 82, 162 and 118 cells for the indicated conditions (left to right in the graph). Kruskal-Wallis test: *p = 0.0468, 0.0396; ****p < 0.0001. g. Left, H3K9me3 immunofluorescence in Progerin-GFP RPE-1 cells (−/+ 72 h 50 ng/mL doxycycline). Right, ratio of the H3K9me3 signal at the nuclear periphery over that at the nuclear interior. Each dot: mean of one experiment. n = 3 independent replicates with 225 and 184 cells for −/+dox, respectively. Unpaired two-sided t-test: *p = 0.0472. Scale bar: 10 μm. h. Left, immunoblot of Lamin A-GFP or Progerin-GFP RPE-1 cells. INK-128: 200 nM. Loading control: Vinculin. Right, quantification of p53 levels normalized to no Dox and Vinculin. n = 3 independent replicates. One sample two-sided t-test: *p = 0.0390. i. Left, crystal violet-stained transwell membrane with invaded cells. Right, numbers of CENP-AAID RPE-1 cells treated for 48 (circle) or 72 h (square) with IAA below the Matrigel-coated transwell membrane. N = 3 or 7 independent replicates with 7,927 and 3,829 cells for NT and IAA, respectively. Two-sided Fisher’s exact test: ****p < 0.0001. In d and f, the center lines are the medians, the lower and upper bounds are the 25th and 75th percentiles, the whiskers are the furthest observations within 1.5× the interquartile range and the dots inside and outside the whiskers are the mean of one experiment and outlier data points, respectively. In a, b, e and gi, the error bars are s.e.m. In e, h and i, each dot represents one experiment. Source data

Similar articles

Cited by

References

    1. Santaguida, S. & Amon, A. Short- and long-term effects of chromosome mis-segregation and aneuploidy. Nat. Rev. Mol. Cell Biol.16, 473–485 (2015). - PubMed
    1. Gordon, D. J., Resio, B. & Pellman, D. Causes and consequences of aneuploidy in cancer. Nat. Rev. Genet.13, 189–203 (2012). - PubMed
    1. McKinley, K. L. & Cheeseman, I. M. The molecular basis for centromere identity and function. Nat. Rev. Mol. Cell Biol.17, 16–29 (2016). - PMC - PubMed
    1. Hoffmann, S. et al. CENP-A is dispensable for mitotic centromere function after initial centromere/kinetochore assembly. Cell Rep.17, 2394–2404 (2016). - PMC - PubMed
    1. Hafner, A., Bulyk, M. L., Jambhekar, A. & Lahav, G. The multiple mechanisms that regulate p53 activity and cell fate. Nat. Rev. Mol. Cell Biol.20, 199–210 (2019). - PubMed

MeSH terms

LinkOut - more resources