. 2025 Feb;27(2):347-359.
doi: 10.1038/s41556-024-01583-9. Epub 2025 Jan 8.

Mapping the developmental trajectory of human astrocytes reveals divergence in glioblastoma

Affiliations

Mapping the developmental trajectory of human astrocytes reveals divergence in glioblastoma

Caitlin Sojka et al. Nat Cell Biol. 2025 Feb.

Abstract

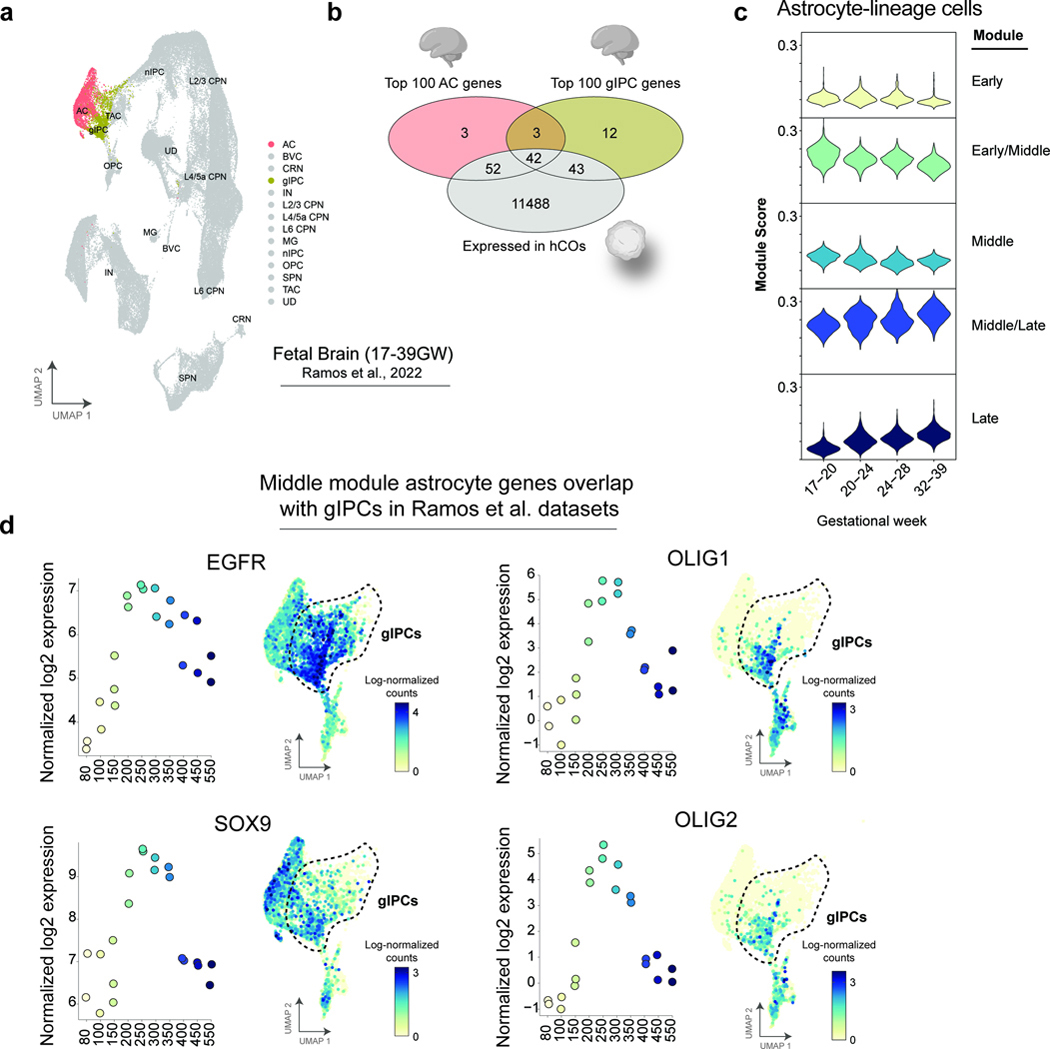
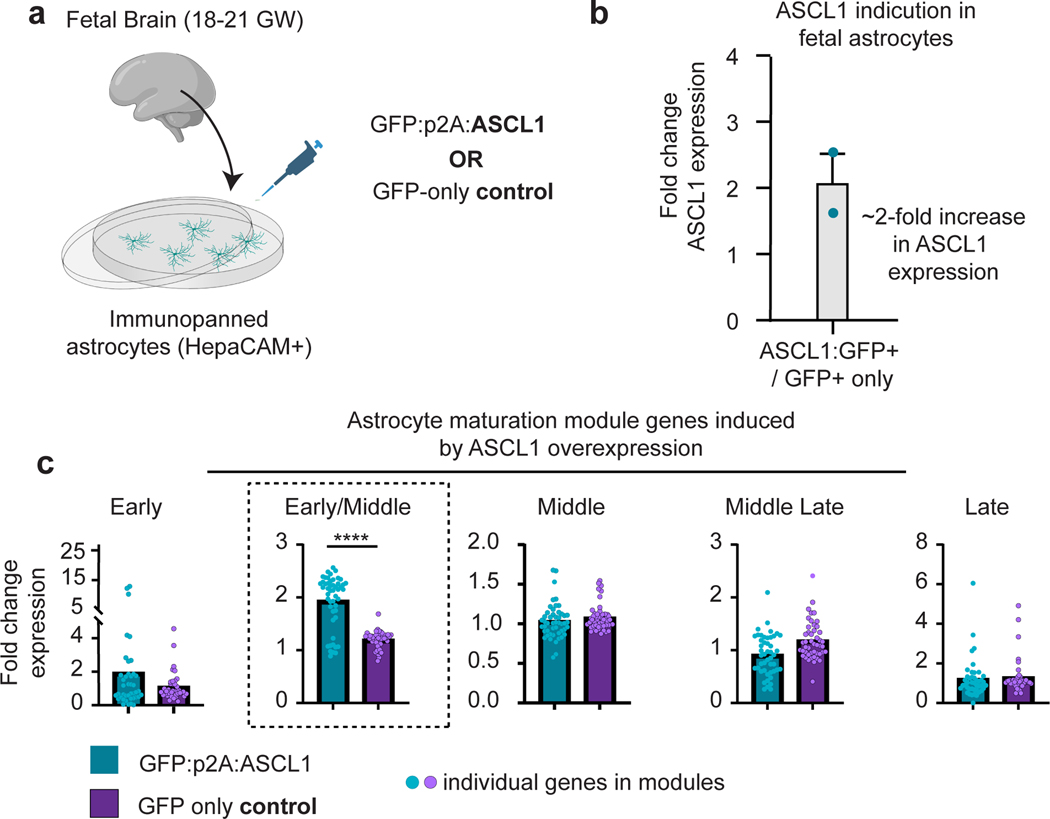
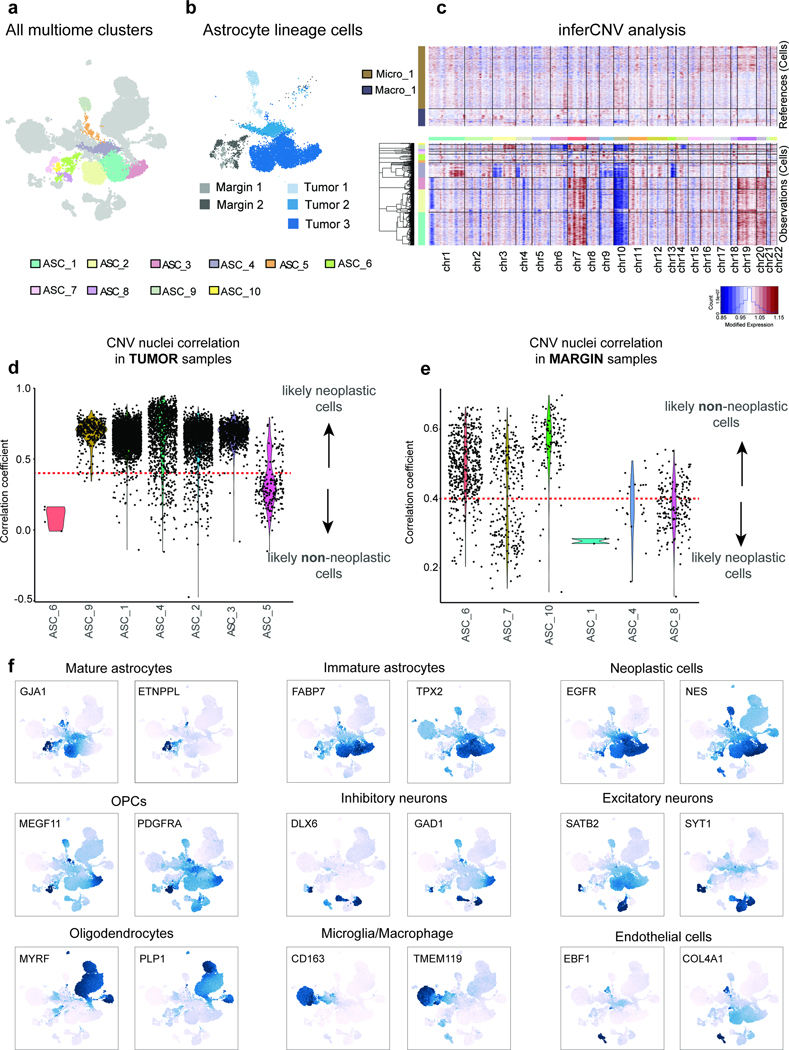
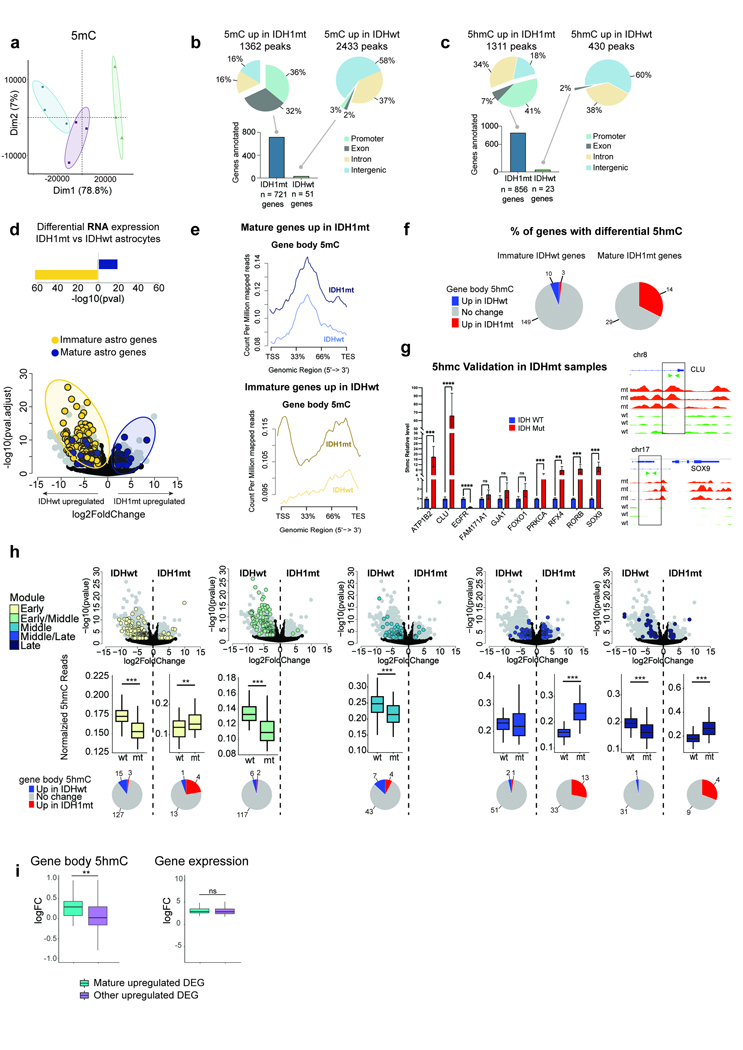
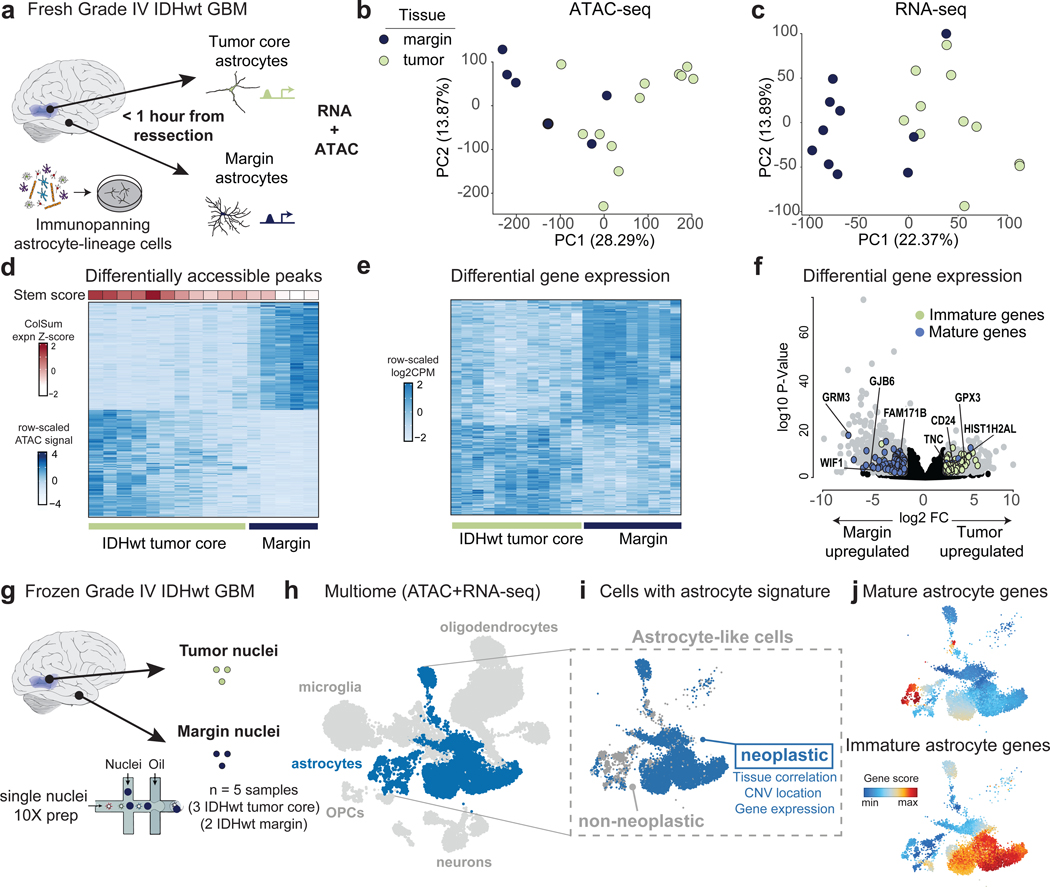
Glioblastoma (GBM) is defined by heterogeneous and resilient cell populations that closely reflect neurodevelopmental cell types. Although it is clear that GBM echoes early and immature cell states, identifying the specific developmental programmes disrupted in these tumours has been hindered by a lack of high-resolution trajectories of glial and neuronal lineages. Here we delineate the course of human astrocyte maturation to uncover discrete developmental stages and attributes mirrored by GBM. We generated a transcriptomic and epigenomic map of human astrocyte maturation using cortical organoids maintained in culture for nearly 2 years. Through this approach, we chronicled a multiphase developmental process. Our time course of human astrocyte maturation includes a molecularly distinct intermediate period that serves as a lineage commitment checkpoint upstream of mature quiescence. This intermediate stage acts as a site of developmental deviation separating IDH-wild-type neoplastic astrocyte-lineage cells from quiescent astrocyte populations. Interestingly, IDH1-mutant tumour astrocyte-lineage cells are the exception to this developmental perturbation, where immature properties are suppressed as a result of D-2-hydroxyglutarate oncometabolite exposure. We propose that this defiance is a consequence of IDH1-mutant-associated epigenetic dysregulation, and we identified biased DNA hydroxymethylation (5hmC) in maturation genes as a possible mechanism. Together, this study illustrates a distinct cellular state aberration in GBM astrocyte-lineage cells and presents developmental targets for experimental and therapeutic exploration.


Conflict of interest statement

Competing interests: The authors declare no competing interests. The funders had no role in study design, data collection and analysis, decision to publish or preparation of the manuscript.

Figures

Extended Data Figure 1.
Extended Data Figure 1.. iPSC and hCO karyotyping
(a, b) KaryoStat+ analysis results of 2 hiPSC lines (C3 and C4) across multiple developmental stages (hiPSCs through day 821 in organoid culture). (a) Cell id correlation plot of all SNP calls. Correlations >95% between samples are considered having an identical genetic background (green boxes), correlations <95% indicate different genetic backgrounds (red boxes). (b) Whole genome view of copy number state for iPSC and organoid samples. Y-axis is the smoothing of the log2 ratios which depicts the signal intensities of probes on the microarray. CN = 2 is a normal copy number state, CN = 3 represents chromosomal gain, and CN = 1 represents chromosomal loss. Colors indicate the raw signal for each individual chromosome probe, while the blue signal represents the normalized probe signal.
Extended Data Figure 2.
Extended Data Figure 2.. Additional maturation gene set comparisons
(a) Heatmap showing expression of NMF module genes (rows) across hCO astrocyte time points (columns). (b) Sankey plot demonstrating the overlap between NMF and WGCNA modules. (c) Dot plots showing top GO terms associated with each maturation module.
Extended Data Figure 3.
Extended Data Figure 3.. Additional comparisons with Ramos et al 2022 dataset
(a) UMAP of Ramos et al CP dataset with astrocyte (AC) and glial intermediate progenitor cell (gIPC) highlighted in red and yellow, respectively. (b) Venn diagram showing enrichment of AC and gIPC genes in hCO astrocytes. Expression in hCOs determined by normalized expression distribution with a cutoff of TPM > 100 (see methods). (c) Violin plots showing module scores for each maturation module in Ramos et al 2022 astrocyte lineage cells (AC + gIPC). (d) Dot plots and paired UMAPs showing expression of key gIPC genes (EGFR, OLIG1, OLIG2, SOX9) across hCO timeline (dot plots) and Ramos et al clusters (UMAPs). Dashed line on UMAP indicates border of gIPC population.
Extended Data Figure 4.
Extended Data Figure 4.. Additional TF IHC
(a-f) IHC with individual and merged channels showing expression of maturation TFs SOX21, OLIG2, and NR3C2 (cyan) with (a, b) GFAP (magenta) and (c-f) NFIA or SOX9 (yellow) in hCOs at (a, b, e, and f) d296 and (c, d) d131. Dashed white box indicates areas for zoom in (b, d). Scale bars are 50 um in (a, c, and e) and 12.5 um in (b, d, and f).
Extended Data Figure 5.
Extended Data Figure 5.. Maturation TF functional relevance in hCOs
(a) Schematic of experimental design with overexpression virus. (b) Fluorescent imaging of control (top) HEK cells and HEK cells transduced with ASCL1-inducible virus and treated with doxycycline for one week (bottom). (c) qPCR validation of ASCL1 expression in HEK cells transduced with ASCL1-inducible virus and treated with doxycycline, plus relevant controls. (d) FACS gating strategy to sort for GFP+ and GFP- hCO cells. (e) Fold change of ASCL1 expression in ASCL1/control conditions. Error bar represents standard deviation. (f) Log2 mean fold change (GFP+/GFP-) of 100 mature and fetal astrocyte genes and 100 neuronal genes with annotations for select markers. Solid black line indicates the mean. (g) Mean fold change of sample mature astrocyte genes in hCOs transduced with the ASCL1 (blue) and control (purple) viruses. **** p < 0.0001
Extended Data Figure 6.
Extended Data Figure 6.. Maturation TF functional relevance in primary human fetal astrocytes
(a) Schematic of overexpression ASCL1 overexpression paradigm in primary fetal astrocytes. (b) Fold change of ASCL1 expression in ASCL1/control conditions. Error bars represent standard deviation. (c) Mean fold change (GFP+/GFP-) of top 50 genes in each of the five maturation gene modules in fetal cells transduced with the ASCL1 (blue) and control (purple) viruses. **** p < 0.0001
Extended Data Figure 7.
Extended Data Figure 7.. sn-multiome quality control and cell-type identification
(a) UMAP of GBM single nuclei with clusters colored by cell type. (b) UMAP of astrocyte lineage clusters annotated by tissue source. Cells from margin tissue are gray and cells from tumor tissue are blue. (c) CNV analysis heatmap showing expression of genes on each chromosome (column annotation) for all astrocyte lineage cells (row annotation). (d, e) Violin plots showing distribution of nucleus vs host tissue correlation coefficients. (d) Correlations for nuclei from tumor host tissue. (e) Correlations for nuclei from margin host tissue. Red dashed line indicates correlation coefficient cutoff of 0.4 for assessing malignancy (see methods). (f) UMAPs showing gene activity score for cell type-specific markers.
Extended Data Figure 8.
Extended Data Figure 8.. Gene expression comparisons across IDHwt, IDH1mt, and margin astrocyte lineage cells
(a) RNA-seq heatmap showing gene signatures unique to astrocytes from tumors with various genomic diagnoses. Annotated with representative genes and enriched gene ontology terms. (b) Diverging bar plots of p-values for maturation module gene set enrichments in DEGs between IDHwt and IDH1mt tumor astrocytes (supplement to Fig. 5e). Bar color indicates maturation module. (c) Volcano plot showing DEGs between IDH1mt tumor (FDR<0.05; log2FC>2) and margin (FDR<0.05; log2FC<−2) astrocytes. DEGs colored in red. (d) Bar plots showing DEGs from Fig. S16c in mature (postnatal) and immature (fetal) astrocyte transcriptomic data . Values are mean log2CPM of the 747 margin and 146 tumor DEGs. *** P < 0.0005; ns, not significant, two-tailed student’s t-test. (e) Example mature DEGs upregulated in IDH1mt margin and downregulated in tumor astrocytes.
Extended Data Figure 9.
Extended Data Figure 9.. 5mC and 5hmC quantification in IDH1mt and IDHwt tumors
(a) PCA of 5mC data. (b, c) Pie charts of relative abundances of differentially (b) methylated regions and (c) hydroxymethylated regions across genomic features. Bar plots show number of genes that annotate to each differentially methylated/hydroxymethylated region. (d) Fig. 6f volcano with diverging bar plot quantifying representation of postnatal and fetal genes in IDHwt (fetal.pval= 4.8e-62, postnatal.pval= 0.92) and IDH1mt (fetal.pval= 0.99, postnatal.pval= 7.3e-19) DEGs. (e) NGS plots of gene body 5mC levels in IDH1mt and IDHwt for postnatal genes upregulated in IDH1mt astrocytes (left, purple) and fetal genes upregulated in IDHwt astrocytes (right, yellow). (f) Percent of genes with differential 5hmC in (left) fetal genes upregulated in IDHwt and (right) postnatal genes upregulated in IDH1mt. (g, left) 5hmC-Capture-qPCR validation for 10 developmental and oncogenic genes. Blue bars indicate relative 5hmC levels in IDHwt samples and red bars for IDH1mt samples. ns, not significant. (g, right) 5hmC levels for two representative genes included in 5hmC-Capture-qPCR, CLU (top) and SOX9 (bottom). 5hmC tracks for IDHwt samples in green and IDH1mt in red. (h, Top) Volcano plots from Fig 5e. (Middle) Box and whisker plots for each respective maturation module showing normalized gene body 5hmC for genes upregulated in IDHwt (left of dashed line) and for genes upregulated in IDH1mt (right of dashed line). No 5hmC data shown if fewer than 10 upregulated genes. (Bottom) Percent of genes with differential 5hmC. (i) Bar plots showing gene body 5hmC levels (left) and expression (right) in differentially expressed mature genes and all other DEGs. * if p.adj<0.01, ** if p.adj<0.001, *** if p.adj<0.0001
Extended Data Figure 10.
Extended Data Figure 10.. Additional data on human fetal astrocyte exposure to D2HG
(a) Brightfield images of CD49f+ cells exposed to three concentrations of D2HG (0.1, 0.5, and 1.0 mM) over a 48-hr period. (b) GFAP staining of CD49f+ cells exposed to low (0.1 mM) and high (1.0 mM) D2HG concentrations, and respective vehicle control concentrations. (c) CD49f+ cells stained for SOX21 (red) and DAPI (blue). (b, c) scale bars are 100 um. (d, e) Volcano plots showing DEGs (padj<0.05) for (d) CD49f+ cells that received normal media (no treatment) and media supplemented with 0.1% DMSO for 1 week. (e) DEGs between CD49f+ cells that received media supplemented with 0.1% DMSO and 0.1 mM D2HG for 1 week. DEGs that are upregulated in IDHwt and IDH1mt tumors (ref. Fig. 6f) are colored in red and blue, respectively. (f) Normalized expression for select genes in CD49f+ cells exposed to 0.1% DMSO and 0.1 mM D2HG for 1 week. Individual dots correspond to separate biological replicates.
Figure 1.
Figure 1.. A molecular trajectory of human astrocyte maturation
(a) Schematic of astrocyte maturation collection timepoints. (b) Immunohistochemistry of GFAP in hCOs across three time points- d100, d208, and d345. Scale bar for large images are 100 um. Scale bar for insets: 20um. (c) PCAs of RNA-seq and (d) ATAC-seq across timepoints. (e) WGCNA heatmaps across maturation time points for gene expression (top) and ATAC peaks (bottom). Heatmap values are module Eigengenes. (f) Expression of representative genes from Early, Middle, and Late gene modules. Color corresponds to time point. (g) UMAP of human fetal cortical plate nuclei from Ramos et al 2022 dataset. Glial nuclei used for comparative analysis are colored. (h) Color-coded cell-type clusters used for analysis, including astrocytes, gIPCs, OPCs, and TACs. (i) UMAP depicting age of tissue sample. (j) Feature plots depicting maturation module gene scores. Heatmap of correlation between hCO astrocyte data and pseudobulk (k) age-binned astrocytes and (l) gIPC data from Ramos et al 2022. Glial intermediate progenitor cells (gIPCs), oligodendrocyte precursor cells (OPCs), transit amplifying cells (TACs).
Figure 2.
Figure 2.. Predicted TF drivers of human astrocyte maturation
(a) Schematic depicting use of PECA algorithm to predict transcription factor (TF) – target gene (TG) interactions during early, middle, and late stages of astrocyte maturation. (b-e) Example validation of PECA-predicted TF-TG networks. (b, d) Expression of TGs (IL17RD and GFAP) and TFs (OTX2 and NR3C2) across maturation time points. (c, e) ATAC signal in regulatory regions. TF (OTX2 and NR3C2) binding sites are located at thin black line. ATAC signal displayed across early (C4 d80), middle (C4 d200), and late (C4 d450) time points. (f) Approach to filter for TFs that regulate astrocyte maturation. (g) Accessibility (left) and gene expression (right) of candidate drivers of astrocyte maturation. (h) Percent of TGs in each maturation gene module for all candidate TFs. (i, j) IHC assessing co-expression of maturation TF candidates SOX21, OLIG2, and NR3C2 (cyan) with (i) GFAP (magenta) and (j) NFIA (yellow) in hCOs. Scale bars are 50 um. (k - n) Quantification of (l) SOX21, (m) NR3C2, and (n) OLIG2 fluorescence intensity in SOX9+ (l,m) or NFIA+ (n) cells. A two-tailed Wilcoxon signed-rank test was used for these comparisons.**** p < 2.2e-16
Figure 3.
Figure 3.. Diverging molecular profiles of GBM tumor and margin astrocyte lineage cells
(a) Schematic showing collection of IDHwt tumor and margin astrocytes for joint ATAC-seq and RNA-seq profiling. (b) PCAs of ATAC-seq and (c) RNA-seq data from IDHwt tumor (green) and margin (purple) astrocyte enriched samples. (d) Differentially accessible peaks between IDHwt tumor and margin astrocyte lineage cells (padj < 0.05 and |log2FC| > 1). Columns are annotated with a stemness score derived from the scaled and summed expression of common stem markers (Supplementary Table 9). (e) Heatmap showing differential gene expression between margin (FDR<0.05 and log2FC<−2) and tumor (FDR<0.05 and log2FC>2) astrocyte lineage cells. (f) Volcano plot showing DEGs between margin (padj < 0.05 and log2FC < −2) and tumor (padj < 0.05 and log2FC > 2) astrocyte lineage cells (gray). Mature astrocyte markers are colored purple and fetal astrocyte markers are green. (g) Schematic of collection of IDHwt tumor and margin nuclei from frozen primary tissue samples for single-nuclei multiome (ATAC-seq and RNA-seq) profiling. (h) UMAP of single nuclei (gene activity; combined RNA and ATAC). Astrocyte-lineage clusters are in blue (see Extended Data Figure 7a). (i) Non-neoplastic astrocyte-lineage cells in gray and neoplastic cells in blue, as defined by gene expression and CNV identity (see Extended Data Figure 7). (j) Combined gene activity score of postnatal (top) and fetal (bottom) astrocyte gene signatures within astrocyte lineage clusters.
Figure 4.
Figure 4.. GBM astrocyte lineage cells deviate from normal development at middle stages
(a) Approach for projecting astrocyte maturation trajectory onto IDHwt tumor and margin astrocyte lineage cells. (b) Spearman correlation of maturation signature between IDHwt tumor and margin astrocyte lineage cells and hCO-derived astrocytes at each timepoint. (c) UMAPs of scaled gene activity for top 50 genes within each maturation module across astrocyte lineage clusters. (d, Top) GBmap scRNA-seq data annotated for neoplastic astrocyte-like (light blue), neoplastic astrocyte-like proliferating (dark blue), and non-neoplastic parenchymal astrocyte (purple) clusters. (d, Bottom) Scaled expression of top 100 genes in each maturation module across each GBmap astrocyte lineage cluster. (e) Spatial transcriptomic surface plots showing enrichment of “early”, “middle”, and “middle/late” maturation gene modules in (left) histologically defined regions . (f) Normalized motif enrichment of PECA maturation TFs in neoplastic and non-neoplastic astrocyte lineage clusters with a line of best fit and SEM envelope. (g) Scaled motif deviation scores for PAX3 (top) and RFX4 (bottom) across astrocyte lineage clusters.
Figure 5:
Figure 5:. Subtype-specific molecular signatures in tumor astrocyte lineage cells
(a-c) Heatmaps of ATAC and gene signatures unique to astrocytes from tumors with various genomic diagnoses. (b) Top 5 TF motifs enriched in each categorical peak set with select TFs annotated on heatmap. (c) RNA-seq heatmap with hierarchical clustering of genetic signatures enriched in various GBM molecular backgrounds. These gene signatures can be broadly classified as pan-tumor, enriched in EGFR amplified astrocytes, or enriched in IDH1 mutant astrocytes. Pie charts indicate enrichment of maturation module genes within each of the above genetic groupings. (d) PCA of RNA-seq data from IDHwt, IDH1mt, and margin astrocyte samples. (e) Volcano plots showing overlay of maturation module genes with DEGs between IDHwt and IDH1mt (FDR<0.05 and |log2FC|>2) astrocyte lineage cells. DEGs in gray and colored based on maturation state. (f) (Top line) PC2 for RNA-seq data from immature (fetal, primary tissue) and mature (adult, primary tissue). (Bottom line) IDHwt tumor, IDH1mt tumor, and all GBM margin astrocyte lineage cells project on same PC. (g) Schematic of proposed molecular maturation spectrum across all tumor astrocyte lineage cells.
Figure 6:
Figure 6:. DNA hydroxymethylation and D2HG in IDH1mt tumor astrocyte lineage cells
(a) Schematic of aberrant DNA methylation (5mC) and hydroxymethylation (5hmC) in IDH1mt cells and approach for comparing global 5mC and 5hmC levels in IDH1mt and IDHwt samples. (b) Bar plot showing the number of genes that annotate differentially hydroxymethylated regions. (c) PCA of 5hmC data. (d, e) Example plots of differential 5hmC in (d) EGFR and (e) NTRK2. Plots depict 5hmC signal across IDHwt (gray) and IDH1mt (red) samples. (f) DEGs (|log2FC|>2, FDR<0.05) between IDH1mt and IDHwt astrocyte lineage cells. DE fetal astrocyte genes are shown in yellow and postnatal astrocyte genes in purple. (g, h) NGS plots and corresponding box and whisker plots showing gene body 5hmC levels in IDH1mt and IDHwt tumors at (g) postnatal (n = 43) and (h) fetal astrocyte (n = 162) genes. Box and whisker plots reflect five variables: minimum (lower whisker), first quartile (the lower bounds of the box), median (center line), third quartile (the upper bounds of the box), and maximum (upper whisker). (i) Schematic showing experimental paradigm for exposing human fetal astrocytes to D2HG and vehicle control (DMSO). (j) Bar plot and (k) ICC images showing relative abundance of EdU+ cells in control (left) and D2HG (right) treatments (n = 3). (j) Bars represent the mean FC of EdU/DAPI levels for DMSO/no treatment and D2HG/DMSO comparisons (n = 3; two-tailed paired t-test; p = 0.002). (k) EdU+ cells are in yellow and DAPI is in magenta. (l) Volcano plot showing DEGs (p.adj < 0.05) between control and D2HG-treated astrocytes. Immature DEGs are in yellow and mature DEGs are in purple (n = 6). (m, n) Bar plots show mean expression of example genes, (m) TOP2A and (n) EZH2, across conditions (DMSO-treated n=6, D2HG-treated n=5). Bar graphs depict group means +/− SD (Wald test; p.adj TOP2A = 2.60E-20, p.adj EZH2 = 3.44E-05). (o) Hypothesized mechanism by which IDH-mutant-associated D2HG affects expression of astrocyte maturation genes.

References

    1. Aiello NM & Stanger BZ Echoes of the embryo: using the developmental biology toolkit to study cancer. Dis Model Mech 9, 105–114 (2016). - PMC - PubMed
    1. Garraway LA & Sellers WR Lineage dependency and lineage-survival oncogenes in human cancer. Nat Rev Cancer 6, 593–602 (2006). - PubMed
    1. Filbin M & Monje M Developmental origins and emerging therapeutic opportunities for childhood cancer. Nat Med 25, 367–376 (2019). - PMC - PubMed
    1. Tirosh I et al. Single-cell RNA-seq supports a developmental hierarchy in human oligodendroglioma. Nature 539, 309–313 (2016). - PMC - PubMed
    1. Venteicher AS et al. Decoupling genetics, lineages, and microenvironment in IDH-mutant gliomas by single-cell RNA-seq. Science 355 (2017). - PMC - PubMed

METHODS-ONLY REFERENCES

    1. Corces MR et al. An improved ATAC-seq protocol reduces background and enables interrogation of frozen tissues. Nat Methods 14, 959–962 (2017). - PMC - PubMed
    1. Ryan Corces WJG, Howard Y Chang Isolation of nuclei from frozen tissue for ATAC-seq and other epigenomic assays. (2019).
    1. Kuehner JN et al. 5-hydroxymethylcytosine is dynamically regulated during forebrain organoid development and aberrantly altered in Alzheimer’s disease. Cell Reports 35, 109042 (2021). - PMC - PubMed
    1. Bolger AM, Lohse M & Usadel B Trimmomatic: a flexible trimmer for Illumina sequence data. Bioinformatics 30, 2114–2120 (2014). - PMC - PubMed
    1. Dobin A et al. STAR: ultrafast universal RNA-seq aligner. Bioinformatics 29, 15–21 (2013). - PMC - PubMed

MeSH terms

Substances